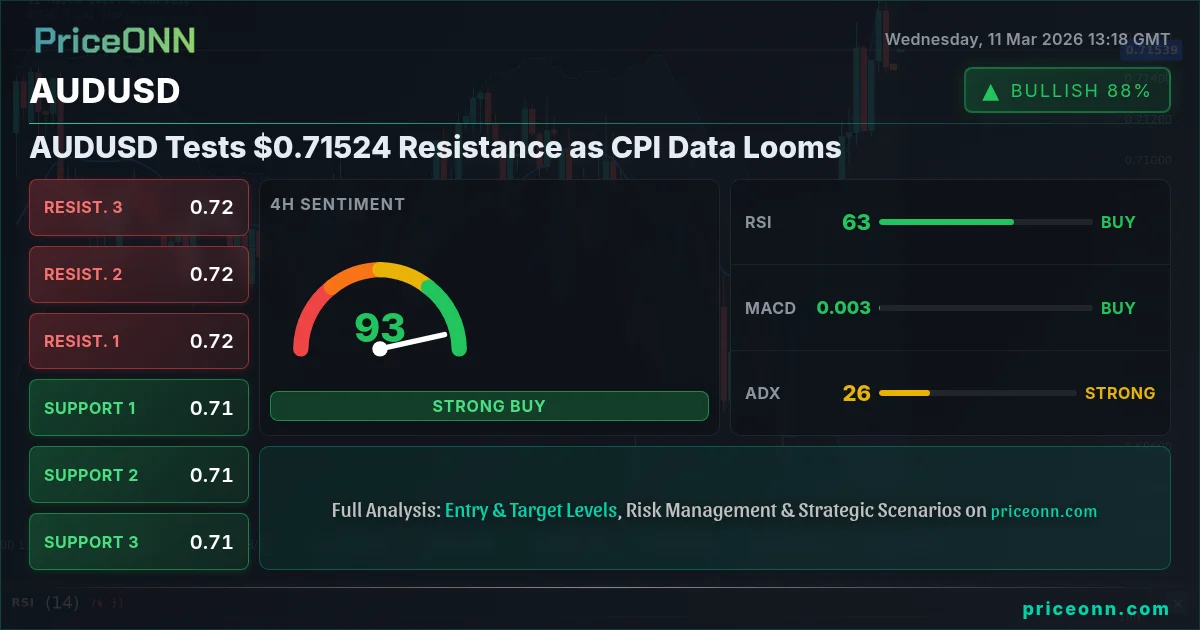
The AUDUSD pair finds itself at a critical juncture, trading around $0.71524, as bulls and bears wrestle for control. The Aussie has shown resilience, fueled by expectations of an aggressive rate hike by the Reserve Bank of Australia (RBA) and rising commodity prices. However, the US dollar's strength, driven by geopolitical uncertainties and anticipation of key economic data, poses a significant challenge. The upcoming CPI data release is expected to be a major catalyst, potentially setting the stage for the next significant move in the pair.
- RSI at 53.38 on the 1H chart indicates neutral momentum, suggesting a potential breakout in either direction.
- Key resistance lies at $0.71705, a break above which could signal further bullish momentum.
- MACD histogram showing negative momentum on the 1H timeframe hints at possible short-term pullbacks.
- Strong ADX of 28.4 on the daily chart confirms a strong underlying uptrend, favoring bullish setups.
The Bullish Case for AUDUSD
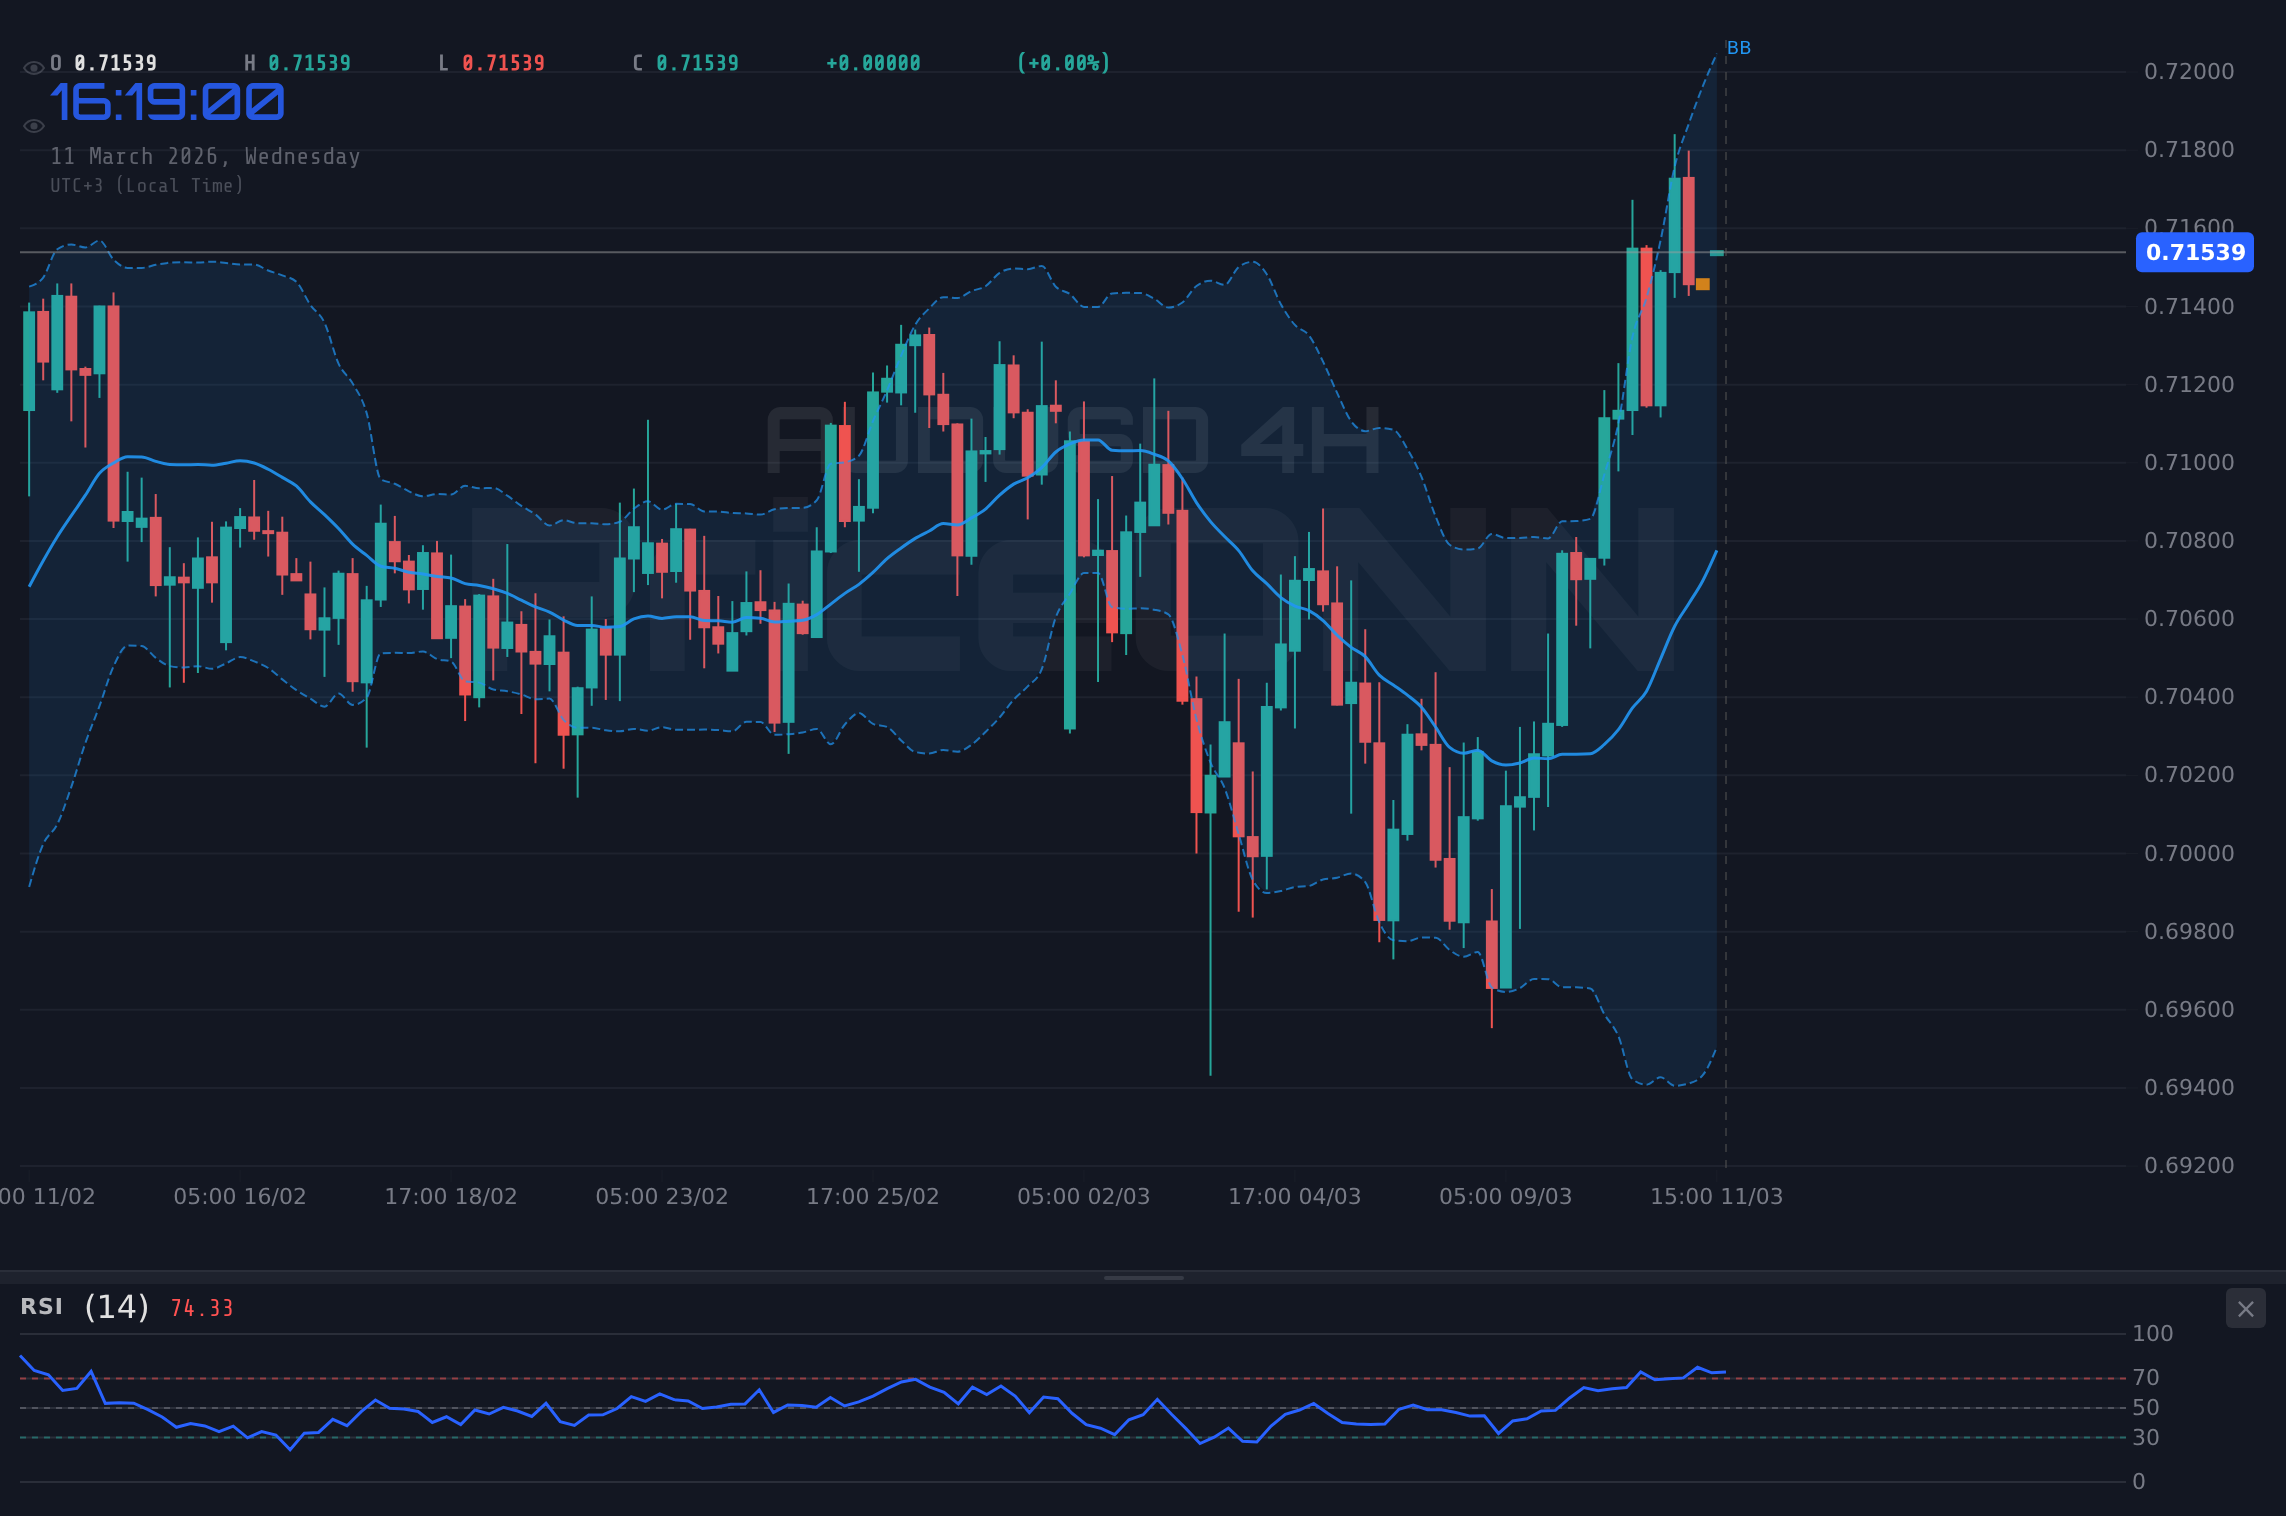
The bullish argument for AUDUSD hinges on several factors. Firstly, expectations of an aggressive RBA rate hike are providing strong tailwinds for the Aussie. As highlighted in recent news, AUDUSD broke above key resistance at 0.7140, fueled by these expectations. This bullish sentiment is underpinned by Australia's strong economic recovery and rising commodity prices, particularly iron ore, a major export for the country. Technically, the 4H chart shows a strong uptrend with the price trading above the 200-period moving average. The Stochastic oscillator at 83.76 on the 4H timeframe indicates overbought conditions, but the overall trend remains upward. Scalpers might look for intraday pullbacks to enter long positions, targeting $0.71705. Swing traders should watch for a breakout above this resistance to add to their positions, targeting $0.72263. Long-term investors may consider accumulating AUDUSD on dips, betting on the RBA's hawkish stance and Australia's economic outlook.
The Bearish Counter-Argument
Despite the bullish factors, the bearish case for AUDUSD cannot be ignored. The primary headwind is the strength of the US dollar, which is attempting to regain its footing near the 99.50 level as geopolitical fears subside. A stronger dollar typically puts downward pressure on AUDUSD. Furthermore, the upcoming US CPI data could be a game-changer. If the CPI data comes in higher than expected, it could strengthen the dollar and trigger a sell-off in AUDUSD. Technically, the 1H chart shows the RSI at 39.56, indicating neutral momentum with a slight downward bias. The MACD histogram is also showing negative momentum, suggesting a possible short-term pullback. Intraday traders could look for shorting opportunities on rallies, targeting the support level at 0.71523. Swing traders should be cautious about adding to long positions and consider tightening their stop losses. Long-term investors should monitor the CPI data closely and be prepared to adjust their positions accordingly.
Technical Analysis: A Multi-Timeframe Perspective
A comprehensive multi-timeframe analysis reveals a mixed picture for AUDUSD. On the daily timeframe, the trend is strongly bullish, as confirmed by the ADX at 28.4. However, the Stochastic oscillator at 77.45 suggests that the pair may be overbought in the short term. On the 4H timeframe, the RSI is at 60.9, indicating neutral momentum. The MACD is showing positive momentum, but the Stochastic oscillator is also in overbought territory. On the 1H timeframe, the RSI is at 53.38, indicating neutral momentum, while the MACD histogram is showing negative momentum. The Bollinger Bands on the 1H chart indicate that the pair is trading near the upper band, suggesting that it may be overextended. This mixed picture suggests that caution is warranted, and traders should wait for confirmation before making any significant moves.
Correlation Analysis: DXY and Commodity Prices
Understanding the correlations between AUDUSD, the DXY (Dollar Index), and commodity prices is crucial for making informed trading decisions. The DXY, currently at 98.88, is inversely correlated with AUDUSD. A rising DXY typically puts downward pressure on AUDUSD, while a falling DXY provides support. Therefore, traders should closely monitor the DXY's movements for clues about the future direction of AUDUSD. Commodity prices, particularly iron ore, are positively correlated with AUDUSD. Rising iron ore prices tend to support the Aussie, while falling prices tend to weigh on it. The recent oil price dip, as reported in recent news, could boost Sterling (GBP/USD) but offset Dollar weakness in other pairs. Traders should therefore keep an eye on commodity prices to gauge the strength of the Aussie.
The Looming CPI Data and Its Potential Impact
The upcoming US CPI data release is a major event that could significantly impact AUDUSD. The data is expected to hold steady at 2.4%, but persistent inflation above the Fed's 2% target, combined with a robust labor market, could force the Fed to maintain its hawkish stance. A higher-than-expected CPI reading could strengthen the dollar and trigger a sell-off in AUDUSD. Conversely, a lower-than-expected reading could weaken the dollar and provide support for AUDUSD. Traders should therefore be prepared for increased volatility around the CPI data release. It is important to note that the market may have already priced in some of the CPI data, so the actual impact may be less than expected.
Trade Plan for AUDUSD: Navigating the Uncertainty
Given the mixed technical picture and the looming CPI data, a cautious approach is warranted. However, a well-defined trade plan can help traders navigate the uncertainty and capitalize on potential opportunities. For swing traders, the key level to watch is the resistance at $0.71705. A decisive break above this level could signal further bullish momentum, targeting $0.72263. A stop loss should be placed below the support level at 0.71523 to protect against downside risk. For intraday traders, potential shorting opportunities may arise on rallies, targeting the support level at 0.71523. A stop loss should be placed above the resistance level at 0.71705 to limit losses. Long-term investors should monitor the CPI data closely and be prepared to adjust their positions accordingly.
AUDUSD breaks above $0.71705 resistance, fueled by dovish CPI data and continued RBA rate hike expectations, targeting $0.72263 and potentially $0.72853.
AUDUSD fails to break $0.71705 and falls below $0.71523 support due to strong CPI data and dollar strength, targeting $0.71244 and potentially $0.70557.
Risk Management: Navigating the Volatility
Effective risk management is crucial for trading AUDUSD, especially in the current environment of uncertainty. Traders should always use stop losses to limit their potential losses. The size of the stop loss should be determined by the trader's risk tolerance and the volatility of the pair. It is also important to manage position size to avoid overexposure to any single trade. A general rule of thumb is to risk no more than 1-2% of your trading capital on any single trade. Furthermore, traders should be aware of the economic calendar and avoid trading during major news releases, such as the CPI data release, unless they have a clear strategy for managing the increased volatility.
Frequently Asked Questions: AUDUSD Analysis
What happens if AUDUSD breaks above $0.71705 resistance?
A break above the $0.71705 resistance level could signal further bullish momentum, potentially targeting the next resistance at $0.72263. This scenario would likely be driven by dovish CPI data or continued RBA rate hike expectations.
Should I buy AUDUSD at current levels of $0.71524 given the RSI at 53.38?
With the RSI at 53.38 on the 1H chart, momentum is neutral, so buying at the current level is risky. Wait for a breakout above $0.71705 to confirm bullish momentum before entering a long position, or look for a pullback to support at $0.71523 for a lower-risk entry.
Is the Stochastic reading of 77.45 a sell signal for AUDUSD?
The Stochastic oscillator at 77.45 on the daily chart indicates overbought conditions, suggesting a possible short-term pullback. However, the overall trend remains bullish, so it's not a definitive sell signal. Look for confirmation from other indicators, such as the MACD, before considering a short position.
How will the US CPI data affect AUDUSD this week?
Higher-than-expected CPI data could strengthen the US dollar and trigger a sell-off in AUDUSD, while lower-than-expected data could weaken the dollar and provide support for AUDUSD. Traders should be prepared for increased volatility around the CPI data release.
Technical Outlook Summary
| Indicator | Value | Signal |
|---|---|---|
| RSI (14) | 53.38 (1H) | Neutral |
| MACD Histogram | Negative (1H) | Bearish |
| Stochastic | 77.45 (1D) | Overbought |
| ADX | 28.4 (1D) | Strong Trend |
| Bollinger | Upper Band (1H) | Watch |
Key Levels
Support Levels
Resistance Levels
Track markets in real-time
AI-powered analysis, technical indicators and real-time price data.
Join Our Telegram Channel
Breaking market news, AI analysis and trading signals instantly.
Join Channel