

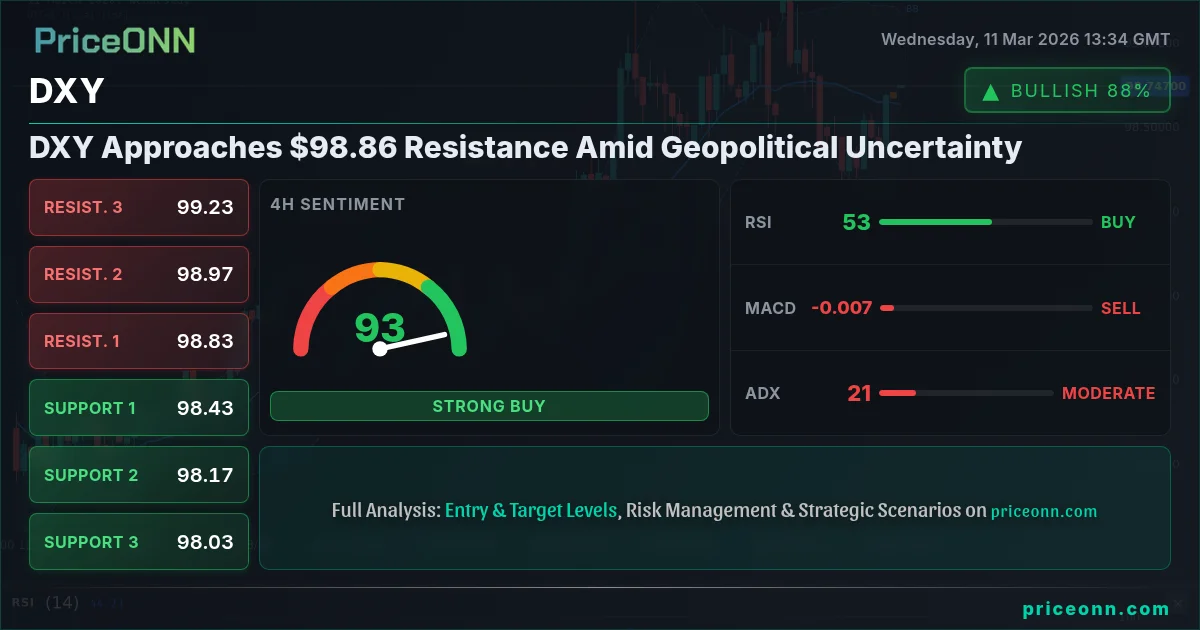
With the Dollar Index (DXY) currently hovering around $98.86, a critical juncture is forming. Is the dollar poised to break through resistance, or will it face a rejection, setting the stage for a pullback?
- RSI at 66.39 on the 1H chart suggests increasing buying pressure, but not yet overbought conditions.
- A break above the immediate resistance at 98.70 could trigger further bullish momentum.
- The ADX reading of 22.41 on the 4H chart signals a moderate uptrend, suggesting a sustainable move higher.
- Upcoming USD data releases on Wednesday and Friday could act as catalysts for the next directional move.
The DXY's recent performance has been closely tied to shifting geopolitical dynamics and evolving expectations surrounding US monetary policy. After tensions in the Middle East eased, the US dollar is attempting to regain its footing near the 99.50 level, but faces resistance. This comes amid a backdrop of fluctuating oil prices and anticipation of key US CPI data that could influence the Federal Reserve's upcoming decisions. The US Dollar Eyes 99.50 Resistance as Geopolitical Fears Subside.
From a technical perspective, the 1-hour chart reveals a neutral trend, but the RSI at 66.39 indicates increasing buying pressure, though not yet at overbought levels. The Stochastic oscillator, with K=83.38 and D=71.46, confirms the upside momentum, but warns of potential overextension. The immediate resistance to watch is 98.70, followed by 98.74 and 98.82. A successful breach of these levels could pave the way for a test of higher targets.
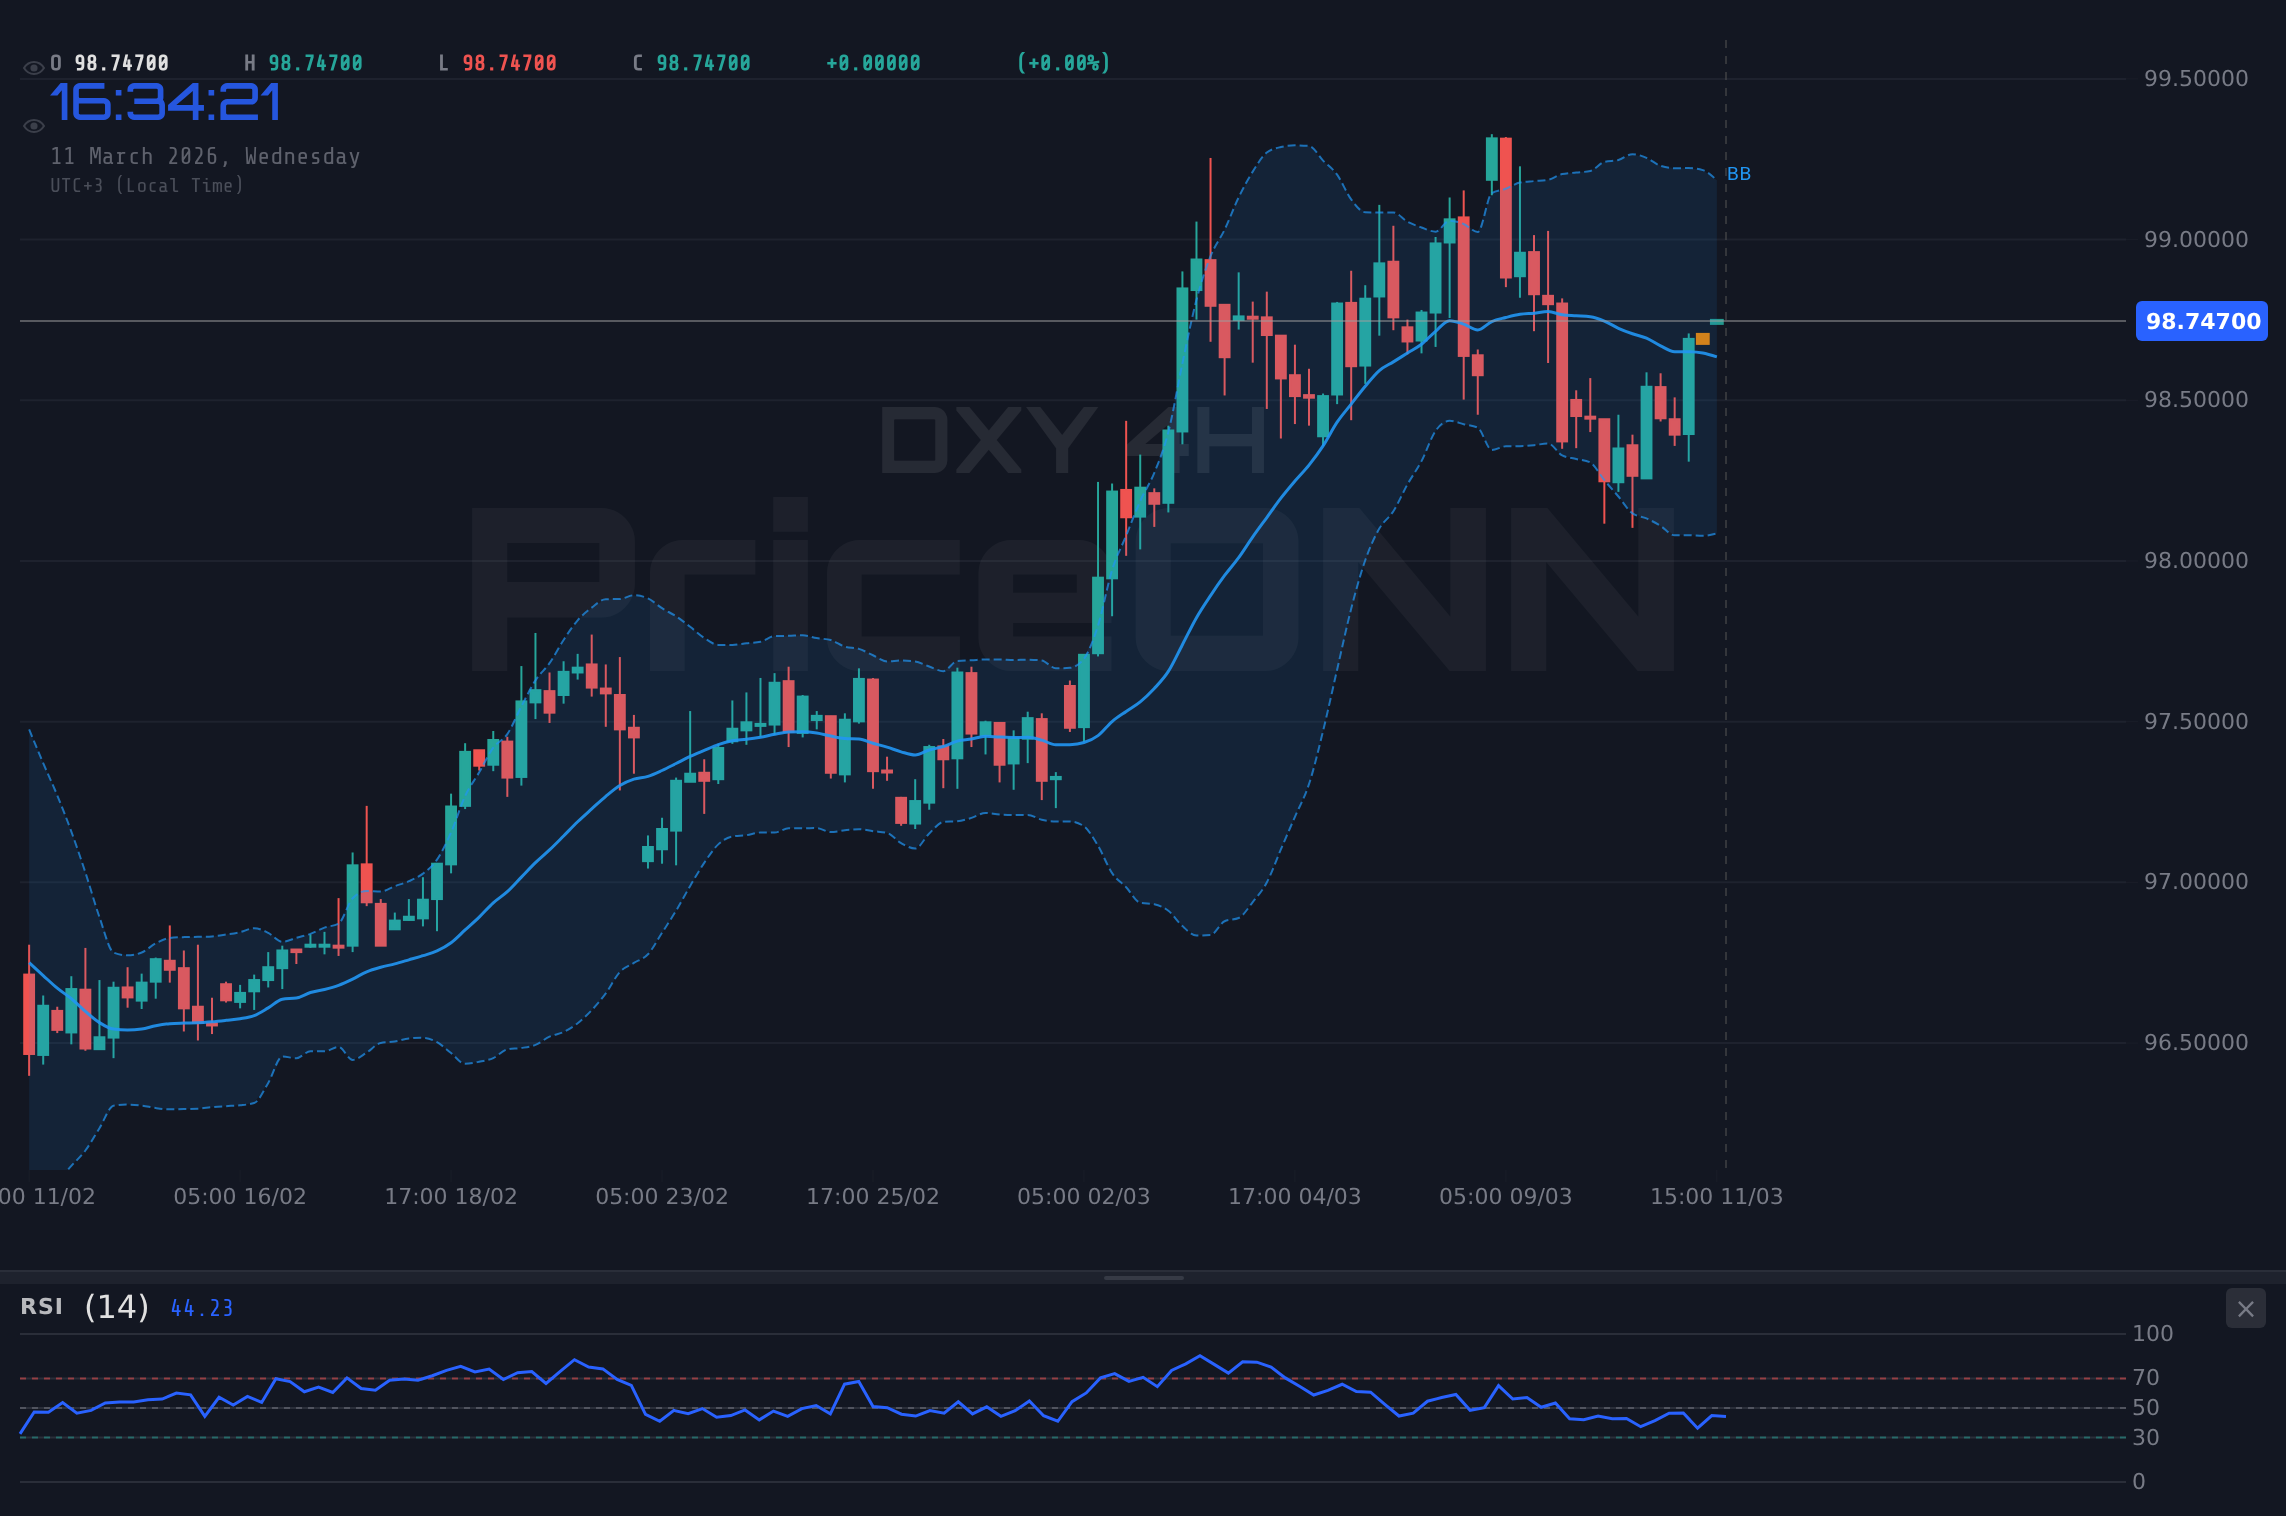
Zooming out to the 4-hour timeframe, the picture becomes slightly more nuanced. While the overall trend remains neutral, the ADX reading of 22.41 suggests a moderate uptrend is in play. This implies that the recent bullish momentum has some underlying strength, increasing the likelihood of a sustained move higher. However, the MACD histogram, while positive, shows a slight deceleration, indicating that the upward momentum may be waning. Key resistance levels on this timeframe are 98.48, 98.57, and 98.63.
On the daily chart, the DXY exhibits a clear uptrend, with an ADX reading of 25.92 confirming the strength of the prevailing trend. However, the Stochastic oscillator, with K=65.77 and D=68.76, is signaling a potential pullback, suggesting that the dollar may be due for a period of consolidation. Critical resistance levels to monitor on the daily chart are 98.72, 98.89, and 99.2. A decisive break above these levels would reinforce the bullish outlook and open the door for a test of higher targets.
The support levels are equally important to consider. On the 1-hour chart, immediate support lies at 98.57, followed by 98.49 and 98.44. A break below these levels could trigger a short-term correction. On the 4-hour chart, key support levels are situated at 98.33, 98.27, and 98.18. A violation of these levels would raise concerns about the sustainability of the current uptrend. Finally, on the daily chart, critical support rests at 98.23, 97.93, and 97.75. A sustained move below these levels would signal a potential trend reversal.
Analyzing the broader market context, the DXY's movements are intricately linked to the performance of other asset classes. As a general rule, a rising DXY tends to exert downward pressure on gold and major currency pairs, while a falling DXY provides a tailwind for these assets. Currently, with the DXY at $98.86, gold is facing headwinds, trading at $5,176.09 with a daily change of -0.32%. EURUSD is also under pressure, trading at 1.15862, down 0.19% on the day. These correlations underscore the importance of monitoring the DXY's price action to gauge the overall market sentiment and potential trading opportunities.
The economic calendar also plays a crucial role in shaping the DXY's trajectory. The upcoming USD data releases, including [EUR] releases on Wednesday and [USD] releases on Friday, could inject significant volatility into the market. Stronger-than-expected data could bolster the dollar, while weaker-than-expected data could trigger a sell-off. Traders should closely monitor these releases and adjust their positions accordingly.
While the technical indicators suggest a potential breakout, the overall picture remains somewhat mixed. The ADX readings indicate moderate to strong trends across various timeframes, but the Stochastic oscillator is flashing overbought signals, warranting caution. The RSI also suggests increasing buying pressure, but the dollar is not at overbought conditions. A daily close above 98.72 would open the door for a test of the 99.00 level, while a break below 98.57 could trigger a deeper correction.
Traders should also be mindful of the potential for geopolitical events to disrupt the market. Any escalation of tensions in the Middle East or other regions could trigger a flight to safety, boosting demand for the dollar and pushing the DXY higher. Conversely, a de-escalation of tensions could lead to a reversal of these flows, weighing on the dollar.
Given the current technical picture and the looming economic data releases, a WATCH_ZONE stance appears prudent. While the potential for a breakout exists, the conflicting signals from the indicators and the ever-present risk of geopolitical shocks warrant caution. A decisive move above 98.72 would signal a higher probability setup for a bullish trade, while a break below 98.57 would suggest a potential short opportunity.
Frequently Asked Questions: DXY Analysis
What happens if DXY breaks above 98.72 resistance?
A break above the 98.72 resistance level would confirm the bullish momentum, potentially opening the door for a test of the 99.00 level. Traders should watch for a sustained move above this level to validate the breakout.
Should I buy DXY at current $98.86 levels given the RSI at 66.39?
While the RSI at 66.39 indicates increasing buying pressure, it's not yet at overbought levels, suggesting there may be more upside potential. However, traders should exercise caution and wait for confirmation of a breakout above the 98.72 resistance before initiating long positions.
Is Stochastic at K=83.38 a sell signal for DXY right now?
The Stochastic oscillator, with K=83.38, is signaling a potential overextension, which could lead to a short-term pullback. However, it's important to consider the broader trend context and wait for confirmation from other indicators before acting on this signal.
How will the [EUR] data release on Wednesday affect DXY this week?
The EUR data release on Wednesday could act as a catalyst for the DXY. Stronger-than-expected data could weigh on the dollar, while weaker-than-expected data could bolster the dollar, potentially triggering a breakout above resistance.
Volatility creates opportunity-those prepared will be rewarded. Markets are cyclical; every downturn plants seeds for the next rally. With disciplined risk management, these choppy waters can be navigated safely. Patient investors always find opportunities-the key is waiting for the right moment. Be bold when the market is fearful, cautious when euphoric-this golden rule applies today.
Technical Outlook Summary
| Indicator | Value | Signal |
|---|---|---|
| RSI (14) | 66.39 | Neutral |
| MACD Histogram | Positive | Bullish |
| Stochastic | K=83.38 | Bearish |
| ADX | 22.41 | Moderate Trend |
| Bollinger | Upper Band | Watch |
Key Levels
Support Levels
Resistance Levels
Track markets in real-time
AI-powered analysis, technical indicators and real-time price data.
Join Our Telegram Channel
Breaking market news, AI analysis and trading signals instantly.
Join Channel