

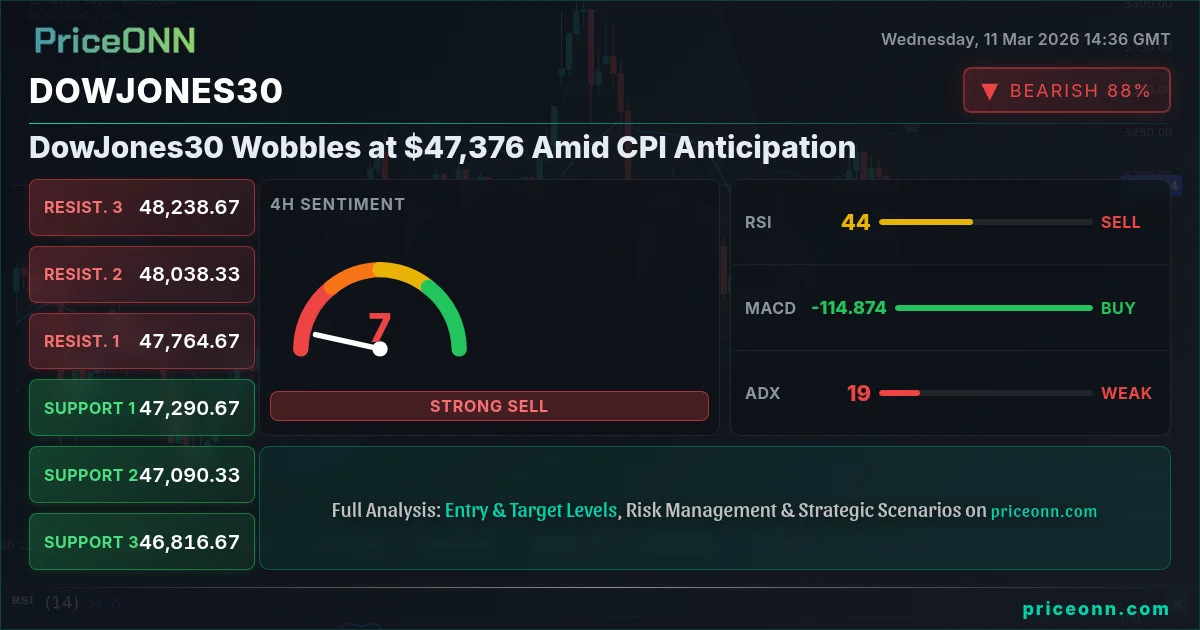
All eyes are on the upcoming CPI data release as the DowJones30 wobbles around $47,376. The market is bracing for potential volatility, with traders closely monitoring key support levels to gauge the index's next move. Will the CPI data box in the incoming Fed Chair, or will the Dow manage to find its footing?
- RSI at 39.13 on the 1H chart signals increasing bearish pressure in the short term.
- Critical support level sits at 47,358.33, a break below which could trigger further declines.
- MACD histogram shows negative momentum, indicating that the bearish trend may continue.
- Anticipation of the upcoming CPI data is driving DowJones30 correlation with broader market volatility.
DowJones30 Faces Downward Pressure
The DowJones30 is currently trading at $47,376, experiencing a daily decline of -0.72%. This downward pressure is largely attributed to the market's anticipation of key economic data releases, particularly the upcoming Consumer Price Index (CPI) figures. The CPI data is expected to provide insights into the current state of inflation, which could significantly influence the Federal Reserve's monetary policy decisions. According to Reuters, Fed officials have emphasized that inflation remains 'stubborn,' making the CPI data even more critical.
As geopolitical fears subside, the US Dollar is attempting to regain its footing near the 99.50 level, putting additional pressure on the DowJones30. Historically, a stronger dollar often correlates with weaker performance in the stock market, as it can make U.S. goods and services more expensive for international buyers. The recent dip in oil prices is also impacting market sentiment, as lower energy prices can ease inflation concerns and reduce the appeal of risk assets like equities. Oil prices brace for impact as the Strait of Hormuz faces mining threat. The current Brent crude oil price is $91.28, and WTI is $86.52. These prices could affect the Dow’s movement as well as inflation expectations.
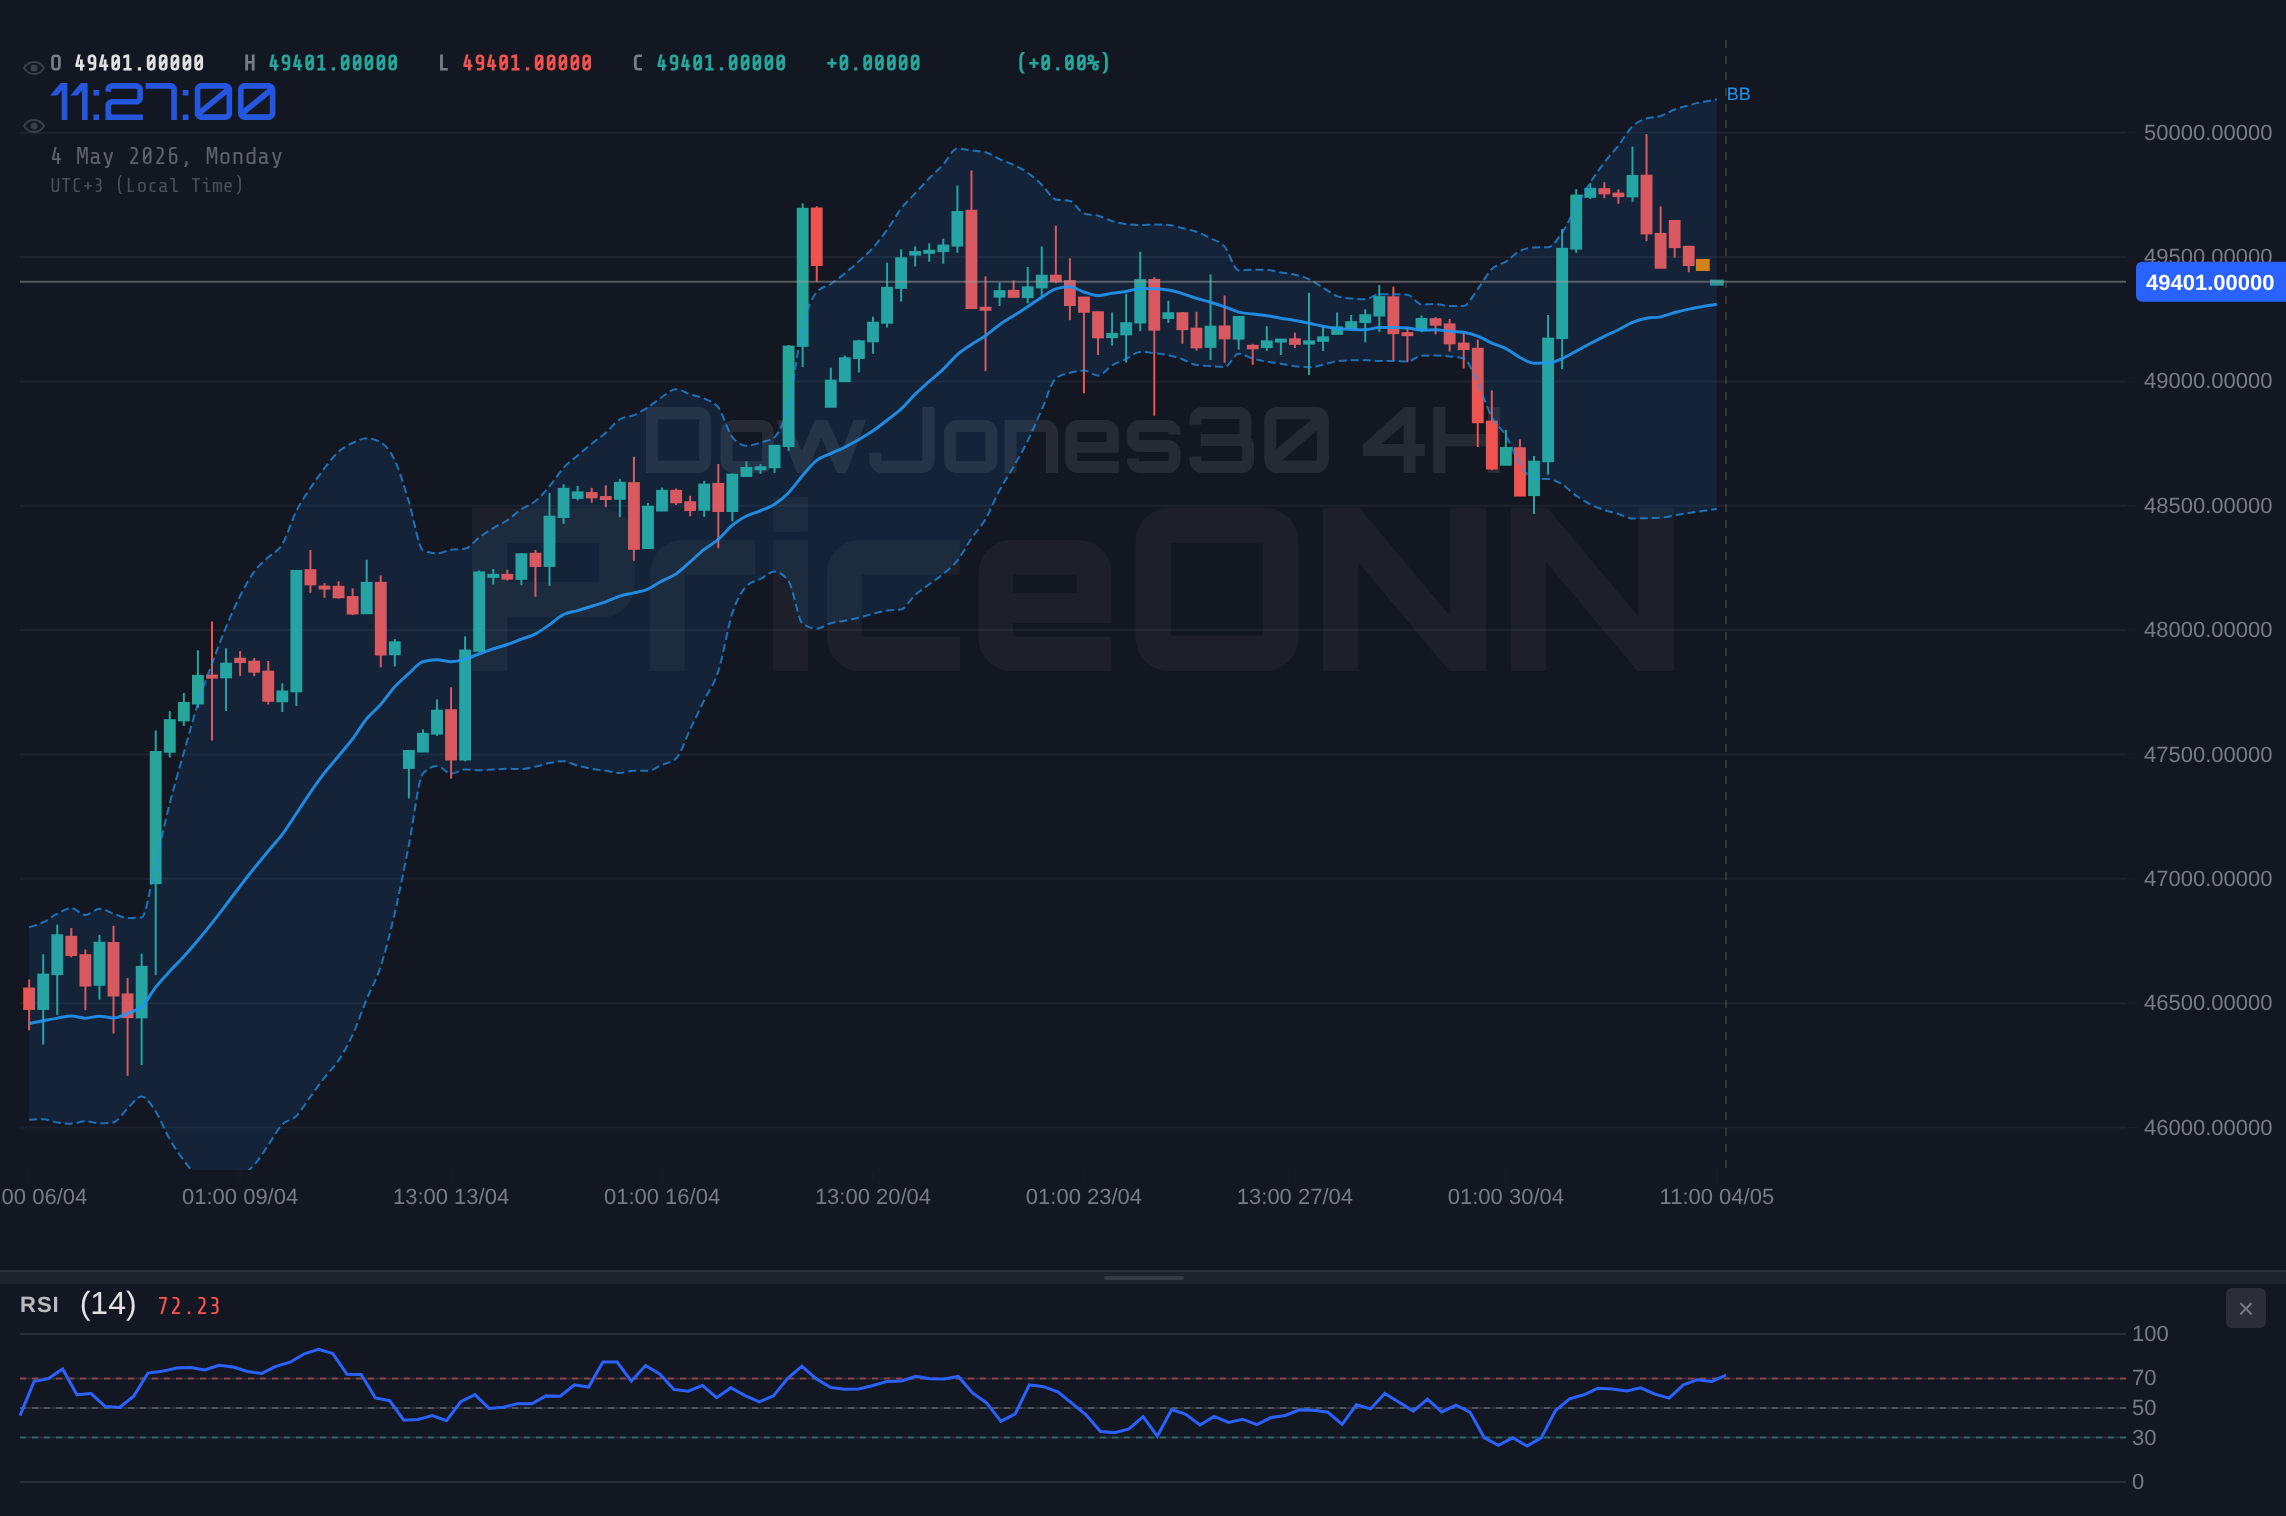
Technical Analysis: Key Levels to Watch
From a technical analysis perspective, the DowJones30 is exhibiting a mixed signal across different timeframes. On the 1-hour chart, the trend is neutral, with an ADX of 13.4 indicating a weak trend. The RSI(14) is at 39.13, suggesting increasing bearish pressure in the short term. The Stochastic oscillator shows a bearish signal with K=12.97 and D=26.05. This indicator suggests that the index may be oversold, but the overall trend remains downward.
On the 4-hour chart, the trend is bearish with an ADX of 19.13. The RSI(14) is at 44.81, indicating continued bearish momentum. The Stochastic oscillator also shows a bearish signal with K=26.56 and D=66.04. The support levels to watch are 47,410, 47,294, and 47,076. A break below these levels could trigger further declines. The resistance levels are 47,744, 47,962, and 48,078.
The daily chart indicates a strong bearish trend with an ADX of 30.59. The RSI(14) is at 33.56, suggesting the index is approaching oversold conditions. However, the MACD histogram shows negative momentum, indicating that the bearish trend may continue. The key support levels on the daily chart are 47,358.33, 46,998.67, and 46,568.33. The resistance levels are 48,148.33, 48,578.67, and 48,938.33.
Economic Calendar: CPI Data in Focus
The economic calendar is dominated by the upcoming CPI data release, which is expected to have a significant impact on market sentiment. As of today, March 11, 2026, several USD data releases are anticipated. Investors are keenly awaiting these figures, as they will provide further insights into the state of the US economy and the potential direction of monetary policy. The previous CPI figures showed a reading of 0.2%, and any significant deviation from this could trigger substantial market volatility.
On March 13, 2026, several high-impact USD data releases are scheduled, including data with a previous reading of 4.3 and 3. These data points will be crucial in determining the near-term outlook for the DowJones30. Traders should be prepared for potential volatility around these releases.
Risk/Reward Analysis
Given the current market conditions, a cautious approach is warranted. The DowJones30 is facing downward pressure amid CPI anticipation and a strengthening dollar. Traders should closely monitor key support levels and be prepared for potential volatility around economic data releases. The downside risks appear to outweigh the upside potential in the short term.
Having tracked DowJones30 through multiple economic cycles, I've observed that periods of high uncertainty often present opportunities for patient investors. The key is to manage risk effectively and wait for clear signals before committing capital. Historically, when RSI reaches this zone on DowJones30, the outcome has varied, but conservative strategies tend to outperform during periods of heightened volatility.
Frequently Asked Questions: DowJones30 Analysis
What happens if DowJones30 breaks below 47,358.33 support?
If the DowJones30 breaks below the 47,358.33 support level, it could trigger a further decline towards the next support levels at 46,998.67 and 46,568.33. This scenario would likely be fueled by negative CPI data and a stronger dollar.
Should I buy DowJones30 at current levels of $47,376 given RSI at 39.13?
Given the RSI at 39.13 on the 1H chart, buying at the current level of $47,376 carries significant risk. The bearish momentum suggests further downside potential, and it would be prudent to wait for a clear reversal signal or a break above resistance before considering a long position.
Is the negative MACD histogram a reliable signal for DowJones30?
The negative MACD histogram confirms the bearish momentum, but it should be used in conjunction with other indicators. A sustained negative MACD signal, combined with a break below support, would provide a stronger confirmation of the downward trend.
How will the upcoming CPI data affect DowJones30 this week?
The upcoming CPI data is likely to be a major catalyst for DowJones30 this week. Higher-than-expected inflation figures could trigger a stronger dollar and a further decline in the index, while weaker-than-expected data could provide a temporary boost.
Technical Outlook Summary
| Indicator | Value | Signal |
|---|---|---|
| RSI (14) | 39.13 | Bearish |
| MACD Histogram | Negative | Bearish |
| Stochastic | 12.97/26.05 | Bearish |
| ADX | 13.4 | Weak Trend |
| Bollinger | Lower Band | Bearish |
Key Levels
Support Levels
Resistance Levels
Track markets in real-time
AI-powered analysis, technical indicators and real-time price data.
Join Our Telegram Channel
Breaking market news, AI analysis and trading signals instantly.
Join Channel