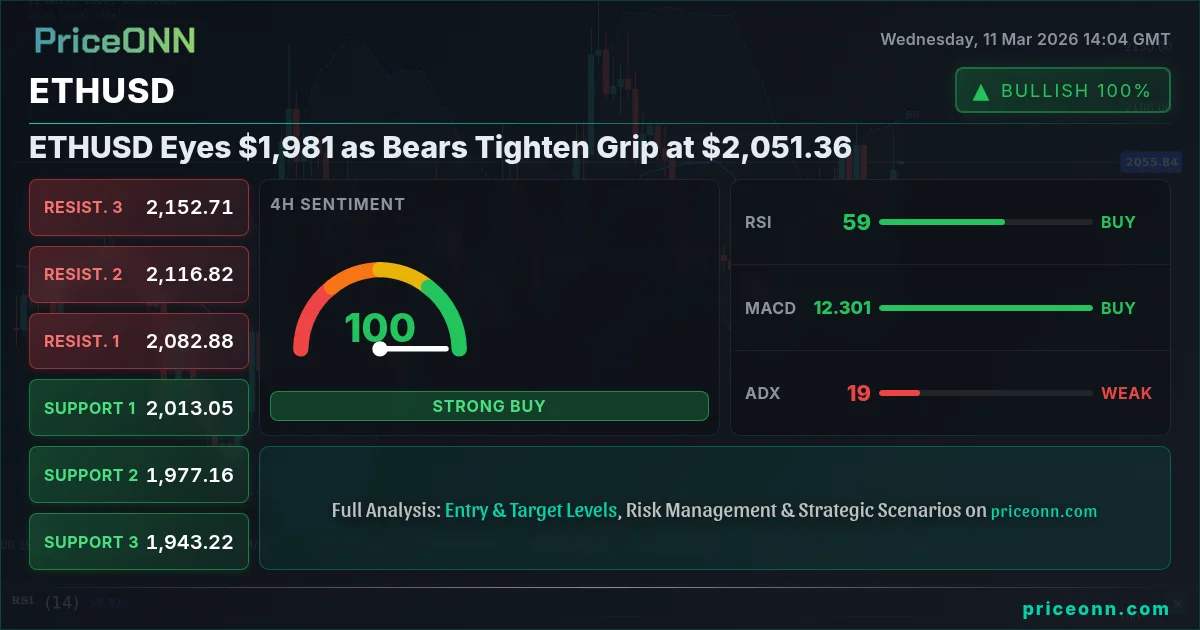
ETHUSD is facing increasing bearish pressure, currently trading at $2,051.36. The question now is whether it will hold above critical support or succumb to further declines. This ETHUSD today analysis examines the technical factors driving this potential breakdown.
- RSI at 49.53 on the daily chart suggests further downside potential for ETHUSD.
- Key resistance level is at $2,079.95, a break above which could negate the bearish outlook.
- MACD histogram shows positive momentum, but the overall trend remains bearish.
- Rising oil prices due to geopolitical tensions in the Middle East could indirectly influence ETHUSD market sentiment.
Technical Breakdown: Pressure Builds Below $2,050
The short-term technical picture for ETHUSD reveals increasing vulnerability. The hourly chart shows a neutral trend, but with a bearish bias. The price is hovering around the middle band of the Bollinger indicator, suggesting indecision, but the negative momentum on the MACD signals the bears are gaining ground. A break below the immediate support at $2,009.87 could accelerate the decline. The ADX is quite weak at 16.83, suggesting the current sideways movement won't last.
Looking at the 4-hour timeframe, the trend remains neutral. The RSI at 56.47 is also neutral, but trending downwards, indicating building bearish momentum. A failure to hold above the $2,005.38 support on the 4-hour chart would likely trigger a test of lower levels. The Stochastic indicator shows a bearish signal, further confirming the downside risks. The support at $1,981 is a critical level to watch. The weak ADX on the 4H timeframe suggests that any move could easily be reversed.
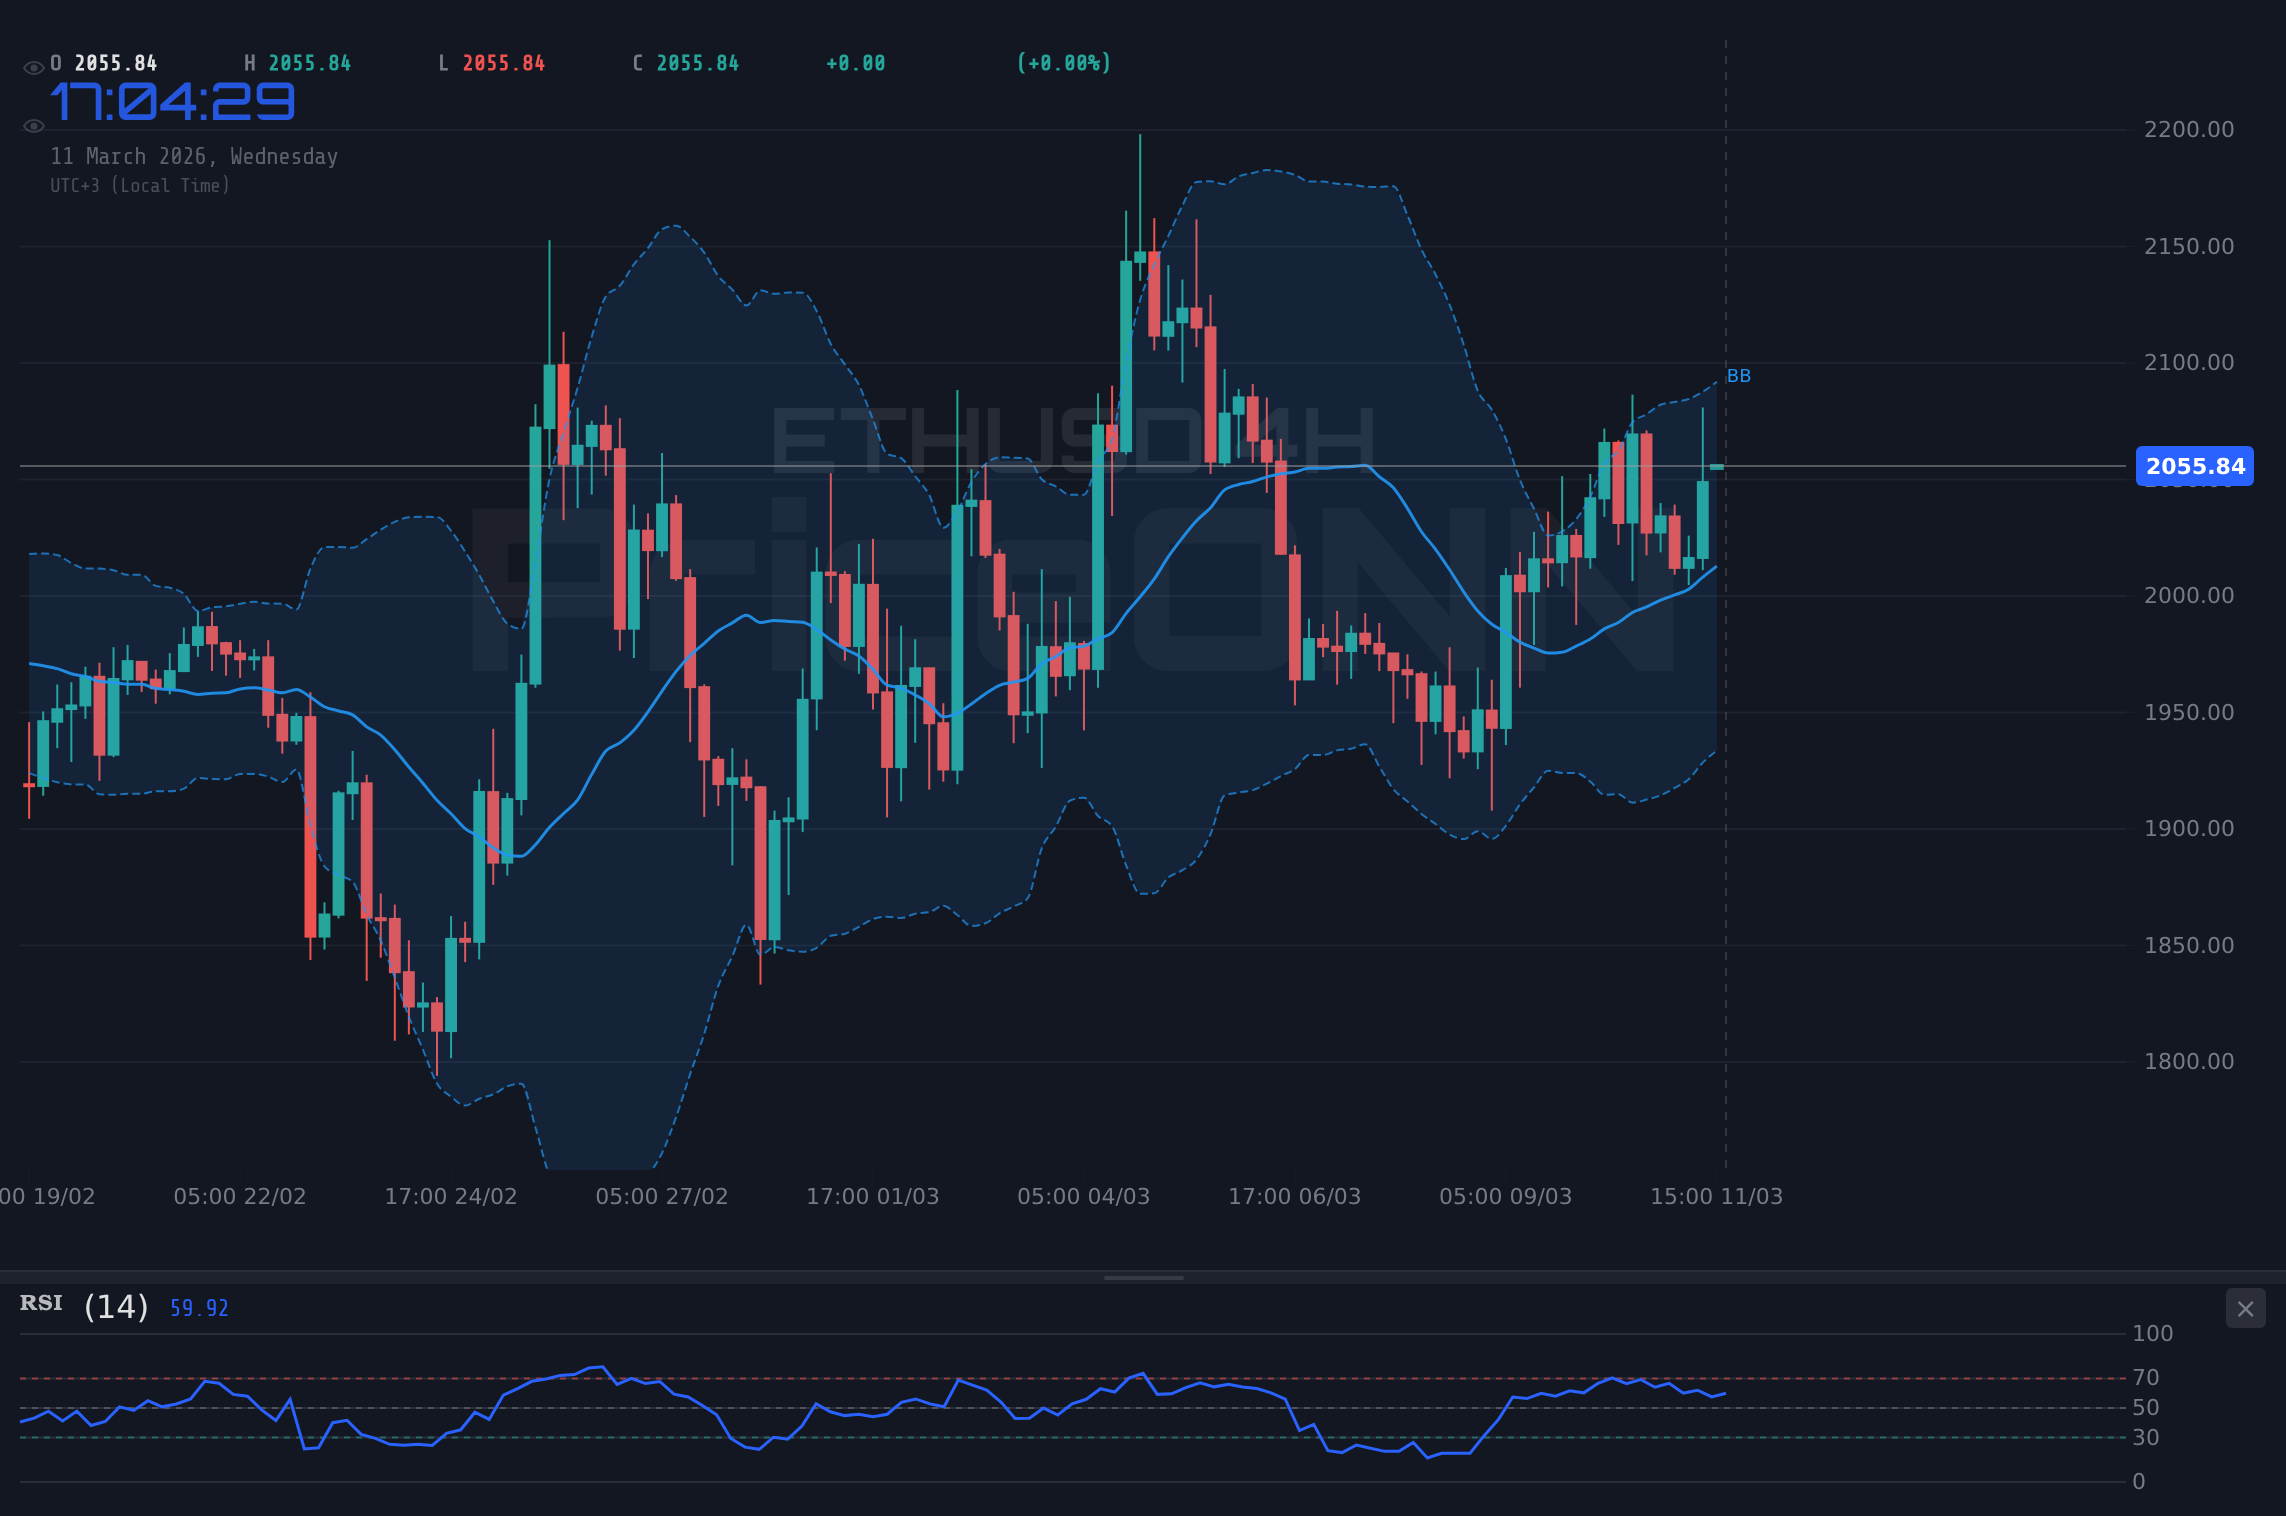
The daily chart paints a more definitive bearish picture. Although the overall trend is bearish, the ADX is 24.89 which indicates a moderately strong trend. The RSI is at 49.53, indicating further room for ETHUSD to move into oversold territory. The MACD histogram, while showing positive momentum, is not strong enough to counter the overall bearish trend. The stochastic indicator gives a bearish signal as K is at 43.9 and D is at 44.8. The first major support is at $1,981.1, which aligns with the overall bearish target. A daily close below this level would open the door for a test of the $1,934.93 level.
Why $1,981 is the Line in the Sand
The $1,981 level represents a confluence of technical support on multiple timeframes. It's not just a random number- it's a price where buyers have historically stepped in to defend against further declines. A break below this level would signal a significant shift in market sentiment, potentially triggering a cascade of stop-loss orders and accelerating the downward momentum. The 1D support is at $1981.10, which is only 10 cents away from the $1981 level. If the bulls cannot defend $1981, the next major level to watch out for would be $1934.93.
Conversely, if ETHUSD can hold above $1,981, it would suggest that the current bearish pressure is merely a temporary pullback within a broader uptrend. In this scenario, a rally back towards the $2,079.95 resistance level would become more likely. However, given the current technical picture, this scenario appears less probable.
Correlation with DXY: Watching the Dollar's Next Move
The strength of the US Dollar Index (DXY) is a critical factor influencing ETHUSD. The DXY is currently at 98.83, up 0.29% on the day. A rising DXY typically puts downward pressure on ETHUSD, as it makes the cryptocurrency more expensive for holders of other currencies. The DXY trend is up on all timeframes. With the DXY at 98.83, ETHUSD is under pressure. This inverse correlation needs to be closely monitored. If the DXY continues to strengthen, ETHUSD will likely face further headwinds.
Economic Data and Market Sentiment
Several key economic data releases are on the horizon that could impact ETHUSD. Upcoming USD data releases on March 13, including Unemployment Claims and the Core Retail Sales, will be closely watched by investors. Better-than-expected data could further strengthen the dollar and put downward pressure on ETHUSD. Conversely, weaker-than-expected data could weaken the dollar and provide some relief for ETHUSD.
Recent news highlights the broader market context. As reported, geopolitical tensions in the Middle East are impacting oil prices, and this has a ripple effect on market sentiment. The Forex news indicates that the US Dollar is attempting to regain its footing near the 99.50 level as tensions in the Middle East ease. Such developments may influence trader risk appetite, which, in turn, can affect ETHUSD.
Actionable Insight: Patience is Key
Given the current technical and fundamental backdrop, the most prudent approach for traders is to exercise patience. The bearish momentum is building, but a clear break below $1,981 is needed to confirm the downside move. Trying to anticipate the breakdown could lead to premature entries and potential losses. Instead, waiting for confirmation will increase the probability of a successful trade.
A daily close below $1,981 would open the door for a short position, targeting the $1,934.93 level. However, it's crucial to manage risk carefully and set appropriate stop-loss orders. Conversely, if ETHUSD manages to hold above $1,981 and stage a rally, it would signal a potential buying opportunity. But even in this scenario, it's important to wait for confirmation before entering a long position.
Frequently Asked Questions: ETHUSD Analysis
What happens if ETHUSD breaks below $1,981 support?
A break below the $1,981 support level would likely trigger a further sell-off, potentially targeting the $1,934.93 level. This scenario would indicate a significant shift in market sentiment and increase the probability of a bearish continuation.
Should I short ETHUSD at current levels of $2,051.36 given the bearish signals?
While the technical picture suggests bearish momentum, it's prudent to wait for confirmation before entering a short position. A daily close below $1,981 would provide a clearer signal and reduce the risk of a premature entry.
Is the RSI at 49.53 a sell signal for ETHUSD on the daily chart?
An RSI of 49.53 on the daily chart indicates further room for ETHUSD to move into oversold territory, suggesting potential for further downside. However, it's important to consider other indicators and price action before making a trading decision.
How will the upcoming USD data releases on March 13 affect ETHUSD this week?
Better-than-expected USD data releases on March 13 could strengthen the dollar and put downward pressure on ETHUSD. Conversely, weaker-than-expected data could weaken the dollar and provide some relief for ETHUSD.
Technical Outlook Summary
| Indicator | Value | Signal |
|---|---|---|
| RSI (14) | 57.34 | Neutral |
| MACD Histogram | Positive | Bullish |
| Stochastic | 47.49 | Neutral |
| ADX | 16.83 | Weak Trend |
| Bollinger | Upper Band | Watch |
Key Levels
Support Levels
Resistance Levels
Track markets in real-time
AI-powered analysis, technical indicators and real-time price data.
Join Our Telegram Channel
Breaking market news, AI analysis and trading signals instantly.
Join Channel