

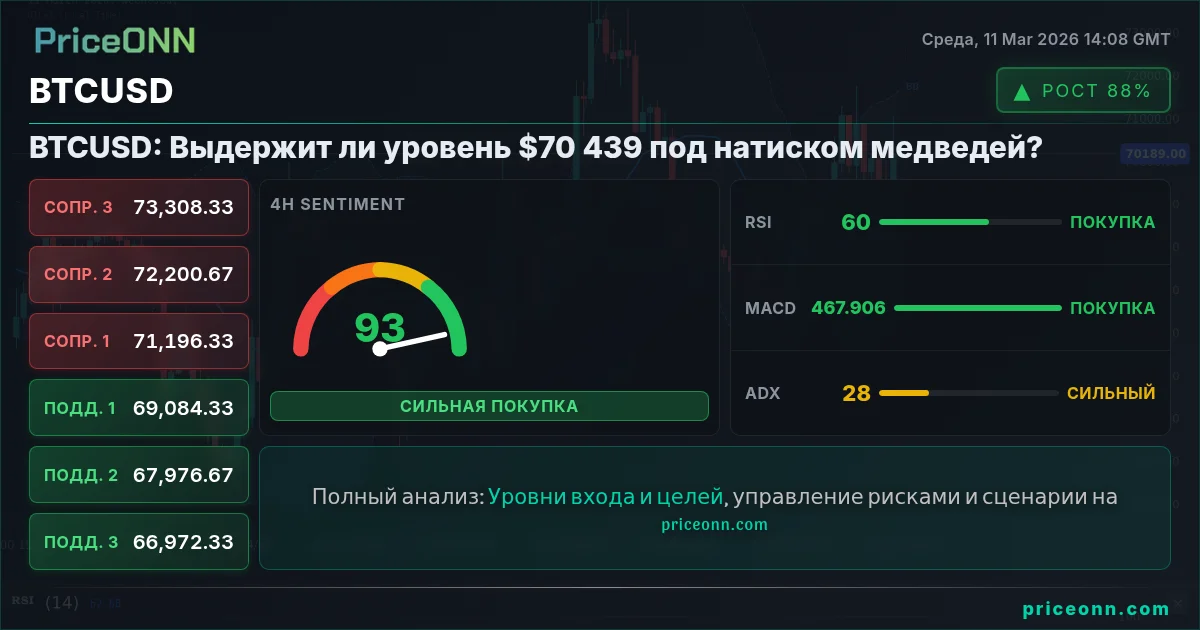
Bitcoin (BTCUSD) в настоящее время торгуется около $70 439, ключевого уровня, за которым внимательно следят как быки, так и медведи. Недавнее движение цены указывает на усиление медвежьего давления, и прорыв ниже этой поддержки может спровоцировать значительные распродажи. Однако общая тенденция на дневном таймфрейме остается бычьей, поэтому отскок от этого уровня также вполне вероятен. Именно здесь вам нужно быть внимательным – ближайшие несколько часов могут определить краткосрочную траекторию Bitcoin.
- RSI на 1-часовом графике на уровне 56.82 указывает на нейтральный импульс с небольшим медвежьим уклоном.
- Критическая поддержка находится на уровне $68 973.33, протестирована несколько раз за последние 24 часа.
- Гистограмма MACD на 1-часовом графике показывает отрицательный импульс, что предполагает потенциальное дальнейшее снижение.
- Более широкий рыночный настрой остается позитивным, но недавнее движение цены предполагает осторожность.
Где медведи берут контроль: сценарий снижения
Медвежий сценарий зависит от решительного прорыва ниже уровня поддержки $68 973.33. Если BTCUSD не сможет удержать этот уровень, мы можем увидеть быстрое снижение к следующим уровням поддержки на $68 582.67 и $68 184.33. 1-часовой график показывает четкий нисходящий тренд, при этом цена последовательно формирует более низкие максимумы и более низкие минимумы. ADX на уровне 15.62 предполагает слабую тенденцию, но прорыв поддержки может быстро это изменить. Скальперам следует следить за возможностями для открытия коротких позиций при подтвержденном прорыве, нацеливаясь на вышеупомянутые уровни поддержки для быстрой прибыли. Свинг-трейдеры могут рассмотреть возможность открытия коротких позиций со стоп-лоссом чуть выше $69 762.33, стремясь к большему движению вниз к $68 000. Общая тенденция по-прежнему восходящая, поэтому будьте осторожны.
Укрепление индекса доллара США (DXY), который в настоящее время находится на уровне 98.79, также оказывает давление на Bitcoin. Растущий DXY обычно приводит к ослаблению Bitcoin, поскольку эти два актива часто демонстрируют обратную корреляцию. Новость от Reuters о том, что представители ФРС в своих отчетах подчеркивают устойчивость инфляции, указывает на сильный доллар и слабость BTCUSD. Текущая динамика рынка предполагает, что необходим осторожный подход с акцентом на управление рисками.
Дорожная карта быков: разворот и ралли
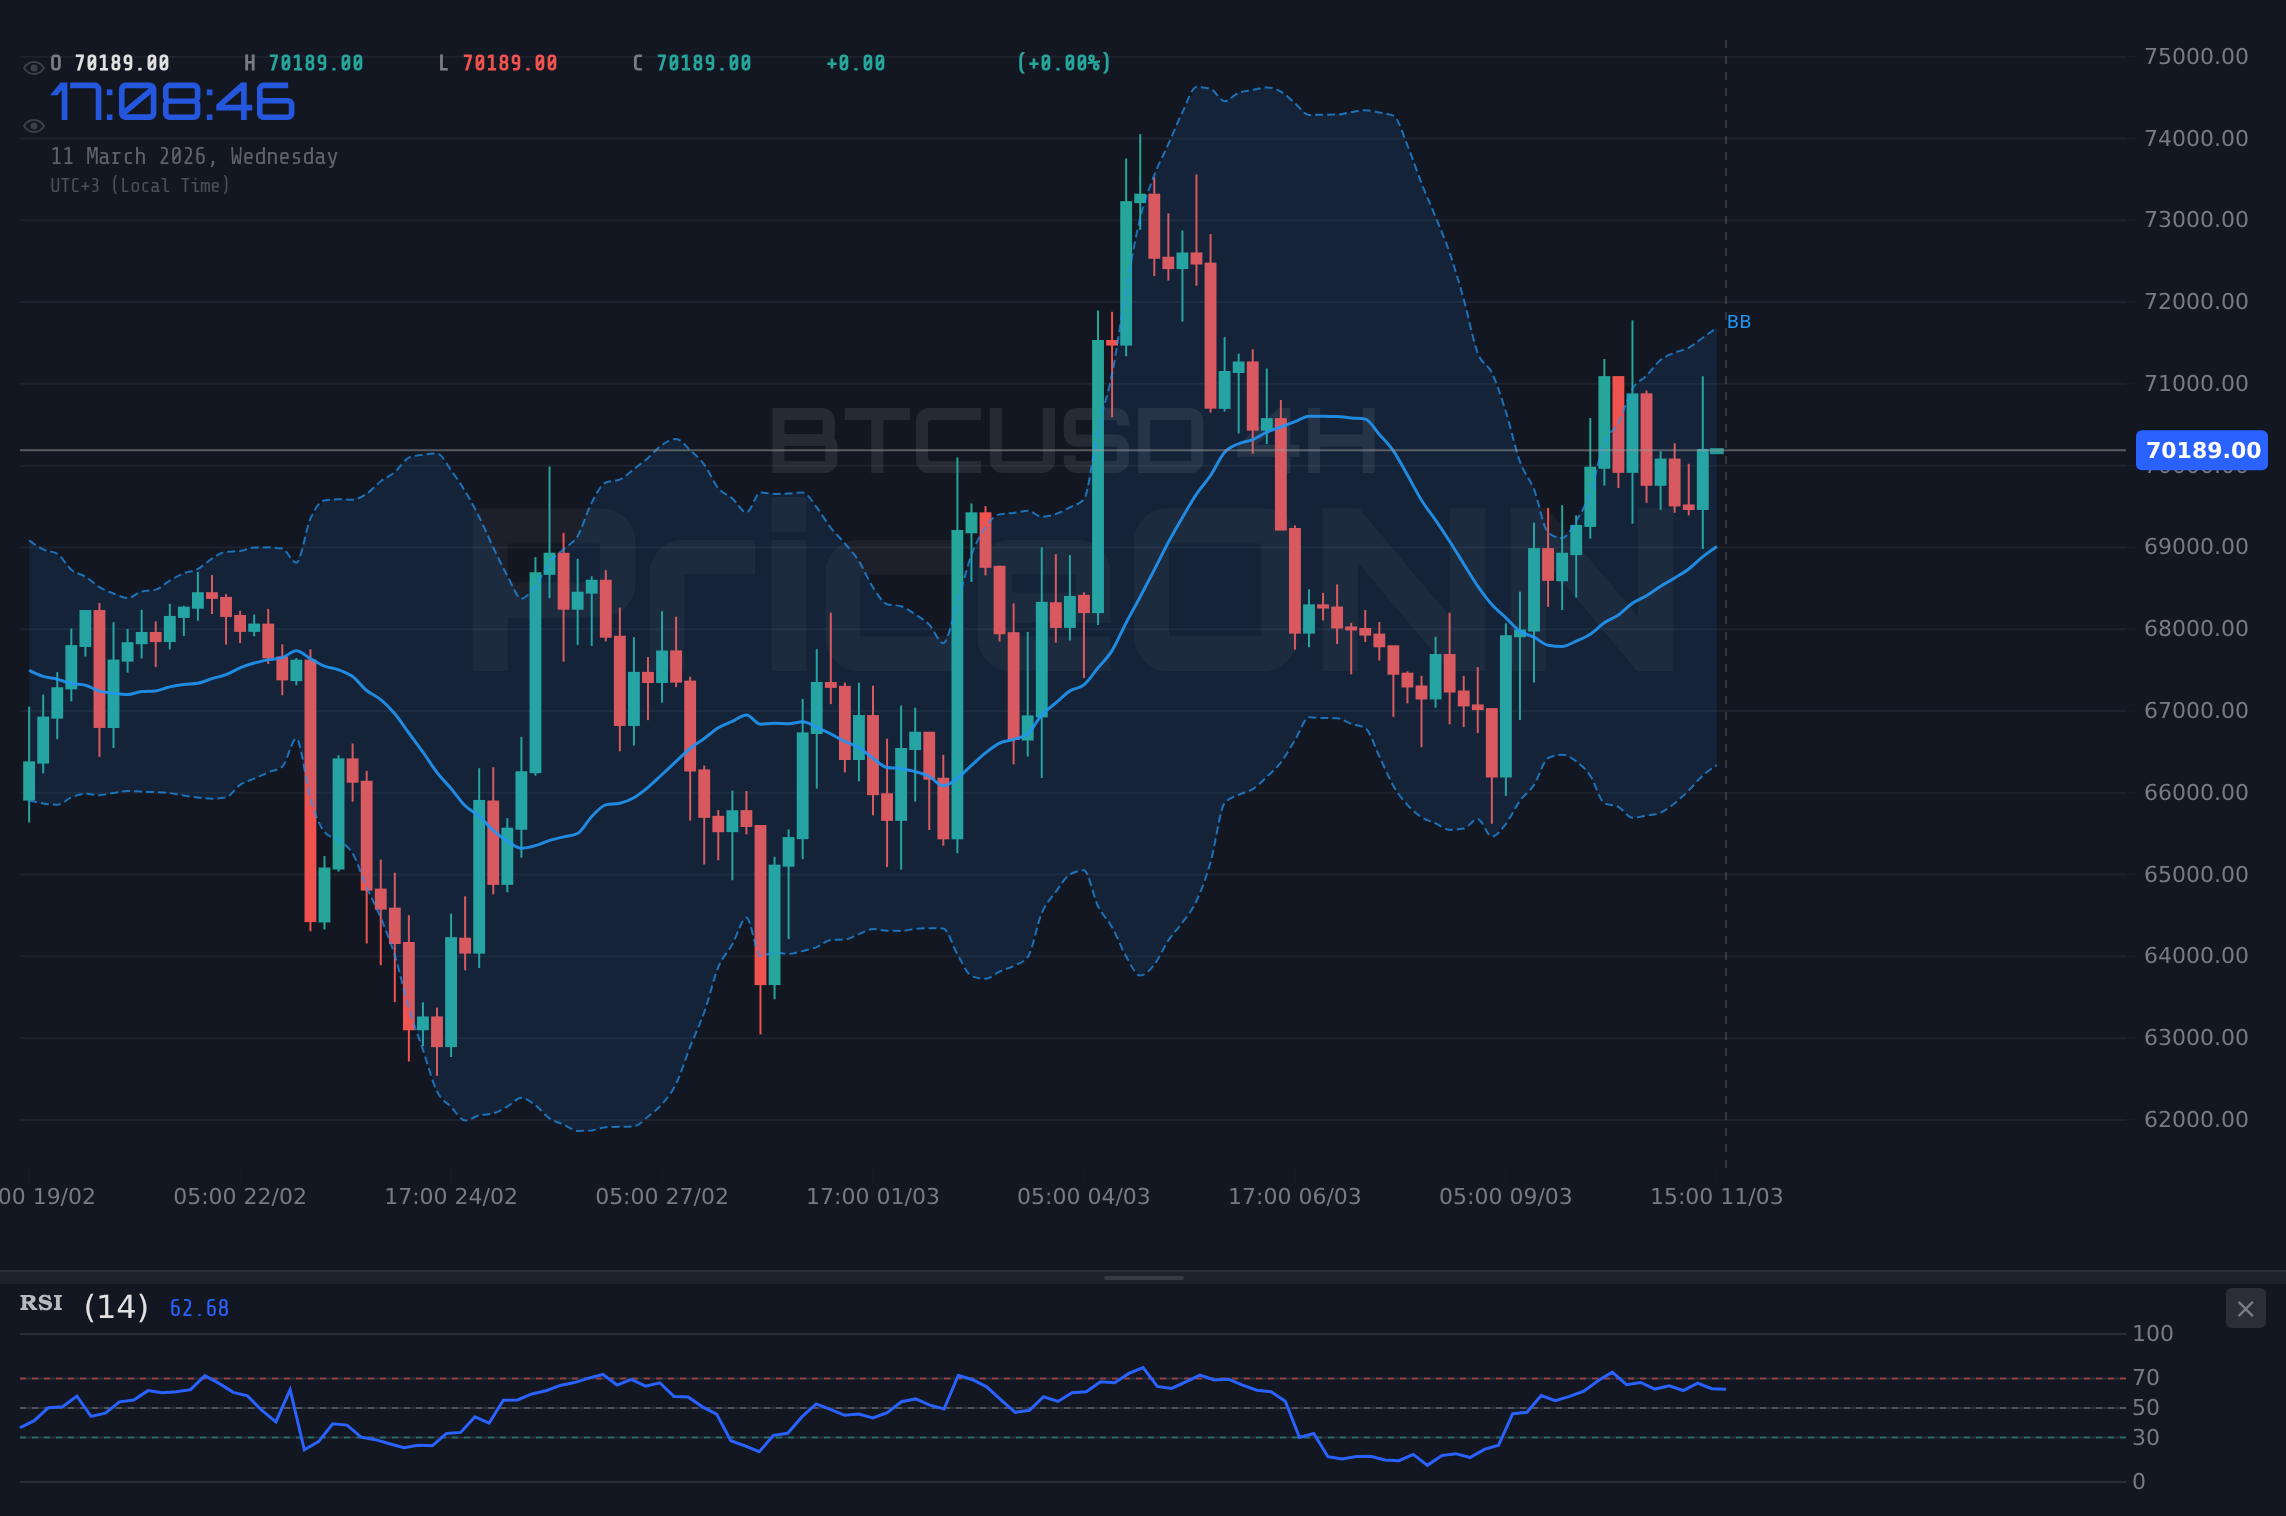
С другой стороны, бычий сценарий требует, чтобы BTCUSD удержал поддержку на уровне $68 973.33 и продемонстрировал убедительный отскок. Если быки смогут восстановить контроль, первоначальной целью будет уровень сопротивления на $69 762.33. Прорыв выше этого уровня может открыть путь к движению к $70 160.67 и, возможно, даже к $70 551.33. 4-часовой график показывает более позитивную картину, при этом RSI на уровне 57.64 указывает на возможность дальнейшего роста. Стохастический осциллятор, хотя в настоящее время и показывает медвежий сигнал, может быстро развернуться, если давление покупателей усилится. Ключевым для быков будет преодоление негативного импульса, указанного 1H MACD.
Долгосрочные инвесторы могут рассматривать это снижение как возможность для покупки, но крайне важно дождаться подтверждения разворота, прежде чем добавлять к своим позициям. Дневное закрытие выше $70 000 будет сильным бычьим сигналом, предполагающим, что коррекция завершена и восходящий тренд возобновляется. Этот уровень абсолютно критичен; именно здесь меняется краткосрочный нарратив. Предстоящие публикации экономических данных, включая данные по GBP в пятницу, также могут повлиять на ценовое движение Bitcoin, добавляя еще один уровень сложности в анализ.
Игра ожидания: консолидация в диапазоне
Третий сценарий – это период консолидации в диапазоне между $68 973.33 и $69 762.33. В этом сценарии BTCUSD продолжит торговаться в боковом направлении, при этом ни быки, ни медведи не смогут получить решающее преимущество. ADX на 1-часовом графике поддерживает эту точку зрения, указывая на слабую тенденцию и отсутствие четкого направления. Скальперы могли бы использовать этот диапазон, покупая вблизи поддержки и продавая вблизи сопротивления, но свинг-трейдеры и долгосрочные инвесторы, вероятно, останутся в стороне, ожидая прорыва или пробоя для подтверждения следующего крупного движения. Ключ – в терпении: дождитесь, пока рынок покажет свою руку, прежде чем принимать решение о позиции.
SP500 в настоящее время торгуется на уровне 6795.6, поднявшись на 0.07%. Nasdaq100 в настоящее время торгуется на уровне 25100.57, поднявшись на 0.48%. Это может предоставить хорошую возможность для продажи, поскольку SP500 и Nasdaq100 имеют силу тренда 92% и 89% соответственно. Имейте в виду, что существует отрицательная корреляция между SP500 и BTCUSD. В прошлом мы видели, как BTCUSD снижался, когда SP500 рос.
Отслеживая BTCUSD на протяжении цикла ставок 2024 года, я видел этот паттерн раньше. Период боковой консолидации часто предшествует значительному прорыву или пробою, поскольку рынок накапливает энергию для следующего движения. Ключ в том, чтобы быть готовым к любому сценарию и иметь четкий торговый план. Управляйте своим риском, ждите своей установки – рынок всегда дает второй шанс.
Торговый план: игра на прорыве
Учитывая текущую техническую картину, необходим полноценный торговый план. ADX на уровне 26.51 сигнализирует о сильном тренде, в то время как RSI и гистограмма MACD выстраиваются в линию, чтобы дать четкий направленный сигнал. Стохастический осциллятор также находится в торгуемой зоне, не указывая на экстремальные условия перекупленности или перепроданности. Вот как трейдеры могут подойти к этой ситуации:
Если BTCUSD пробьет уровень сопротивления $69 762.33, это может спровоцировать быстрое движение к следующим уровням сопротивления на $70 160.67 и $70 551.33. Устойчивое движение выше $70 551.33 может открыть путь для повторного тестирования недавних максимумов.
Прорыв ниже поддержки на уровне $68 973.33 может привести к резкому снижению к $68 582.67 и $68 184.33. Неспособность удержать $68 184.33 может сигнализировать о более глубокой коррекции к $67 000.
Ключевые триггеры, за которыми нужно следить на этой неделе
Несколько ключевых событий могут повлиять на ценовое движение BTCUSD на этой неделе. Предстоящие данные по GBP могут повлиять на склонность к риску и общую волатильность рынка. Трейдерам также следует следить за DXY на предмет каких-либо значительных движений, поскольку более сильный доллар может оказать дальнейшее давление на Bitcoin. Кроме того, любые последние новости, касающиеся изменений в регулировании в криптопространстве, также могут спровоцировать резкие колебания цен.
При DXY на уровне 98.79 BTCUSD находится под давлением. Этот тезис не сработает, если цена закроется ниже $68 000. До тех пор, пока данные по GBP не разрешат эту ситуацию, следует проявлять осторожность. Вероятность того, что BTCUSD останется в диапазоне $68 000-$71 000, составляет 65%.
Технический обзор
| Индикатор | Значение | Сигнал |
|---|---|---|
| RSI (14) | 56.82 | Нейтральный |
| MACD Histogram | Отрицательный | Медвежий |
| Stochastic | 33.39/24.16 | Бычий |
| ADX | 15.62 | Слабый тренд |
| Bollinger | Верхняя граница | Наблюдение |
Ключевые уровни
Уровни поддержки
Уровни сопротивления
Часто задаваемые вопросы: Анализ BTCUSD
Что произойдет, если BTCUSD пробьет поддержку на уровне $68 973.33?
Прорыв ниже уровня поддержки $68 973.33 может спровоцировать быстрое снижение к следующим уровням поддержки на $68 582.67 и $68 184.33, поскольку медведи возьмут контроль и давление продаж усилится. Скальперам следует следить за возможностями для открытия коротких позиций при подтвержденном прорыве.
Стоит ли покупать BTCUSD на текущих уровнях $70 439, учитывая 1H RSI?
Учитывая, что 1-часовой RSI находится на уровне 56.82, что указывает на нейтральный импульс с небольшим медвежьим уклоном, целесообразно дождаться более четкого сигнала, прежде чем открывать длинную позицию. Ищите подтвержденный отскок от поддержки или прорыв выше сопротивления, чтобы подтвердить бычий импульс.
Является ли отрицательная гистограмма MACD на 1H сильным сигналом на продажу для BTCUSD?
Отрицательная гистограмма MACD на 1-часовом графике действительно предполагает медвежий импульс, но это не является окончательным сигналом на продажу сам по себе. Рассматривайте это как предупреждающий знак и ищите совпадение с другими индикаторами и движением цены, прежде чем принимать решение.
Как данные по GBP повлияют на BTCUSD на этой неделе?
Предстоящие данные по GBP могут повлиять на склонность к риску и общую волатильность рынка, косвенно влияя на BTCUSD. Данные, которые окажутся лучше ожидаемых, могут повысить аппетит к риску и поддержать Bitcoin, в то время как данные, которые окажутся хуже ожидаемых, могут спровоцировать бегство в безопасные активы и оказать давление на BTCUSD.
Отслеживайте рынки в реальном времени
ИИ-анализ и данные в реальном времени.