

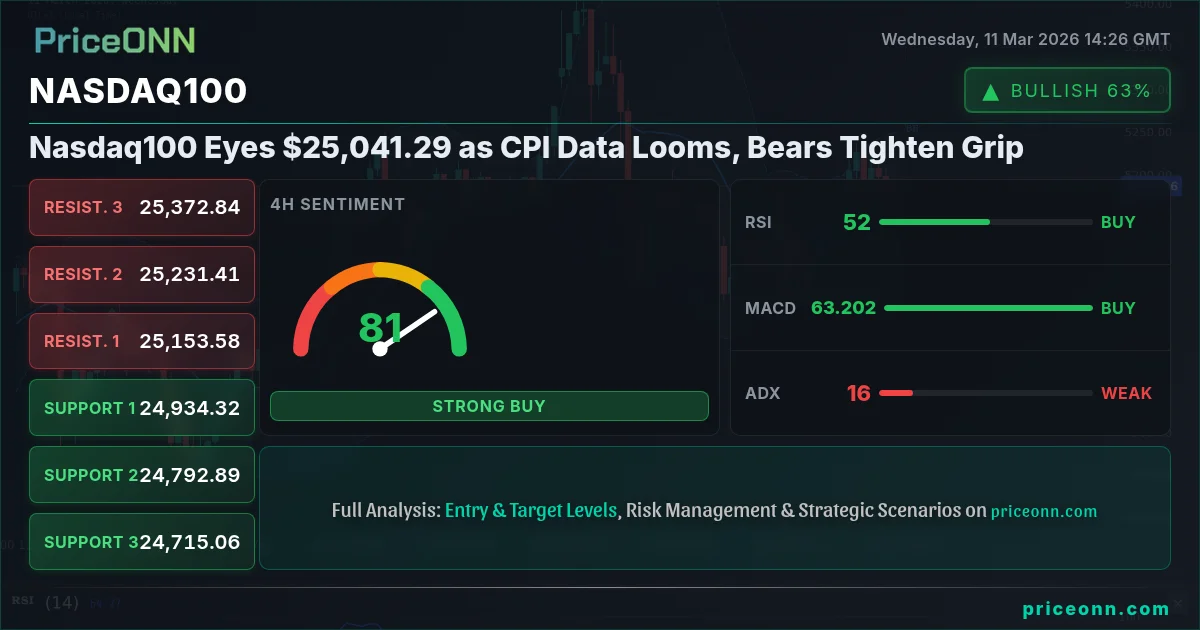
The Nasdaq 100 finds itself at a pivotal juncture, hovering around $25,041.29, as market participants brace for the release of crucial CPI data. This economic indicator is poised to significantly influence the Federal Reserve's upcoming policy decisions, adding a layer of uncertainty to the already volatile market environment. The combination of geopolitical tensions and the anticipation of key economic data has created a perfect storm, leaving investors cautious and analysts divided.
- RSI at 55.35 indicates neutral momentum, suggesting a potential pause in the recent upward trend.
- Critical resistance lies at $25,178.03, a level that has held firm on previous attempts.
- MACD histogram shows declining negative momentum, hinting at a possible bullish reversal.
- Upcoming CPI data and Fed rate expectations are key drivers influencing Nasdaq100 correlation with DXY.
Nasdaq100 today analysis reveals a market grappling with conflicting signals. On one hand, the index has shown resilience, maintaining its position above the $25,000 mark. On the other hand, the bears seem to be gaining traction, fueled by growing concerns over inflation and the potential for a more hawkish stance from the Federal Reserve. The recent volatility in oil prices, triggered by Iran's mining activity in the Strait of Hormuz, has further complicated the picture, adding to the inflationary pressures and casting a shadow over global economic growth.
Why $25,178.03 is the Line in the Sand
From a technical perspective, the $25,178.03 level represents a crucial resistance zone for the Nasdaq 100. Multiple attempts to breach this level have been met with strong selling pressure, suggesting that it holds significant psychological importance for market participants. A sustained break above $25,178.03 could pave the way for further gains, potentially targeting the $25,374.41 and $25,560.48 levels. However, failure to overcome this resistance could lead to a renewed wave of selling, pushing the index back towards its support levels.
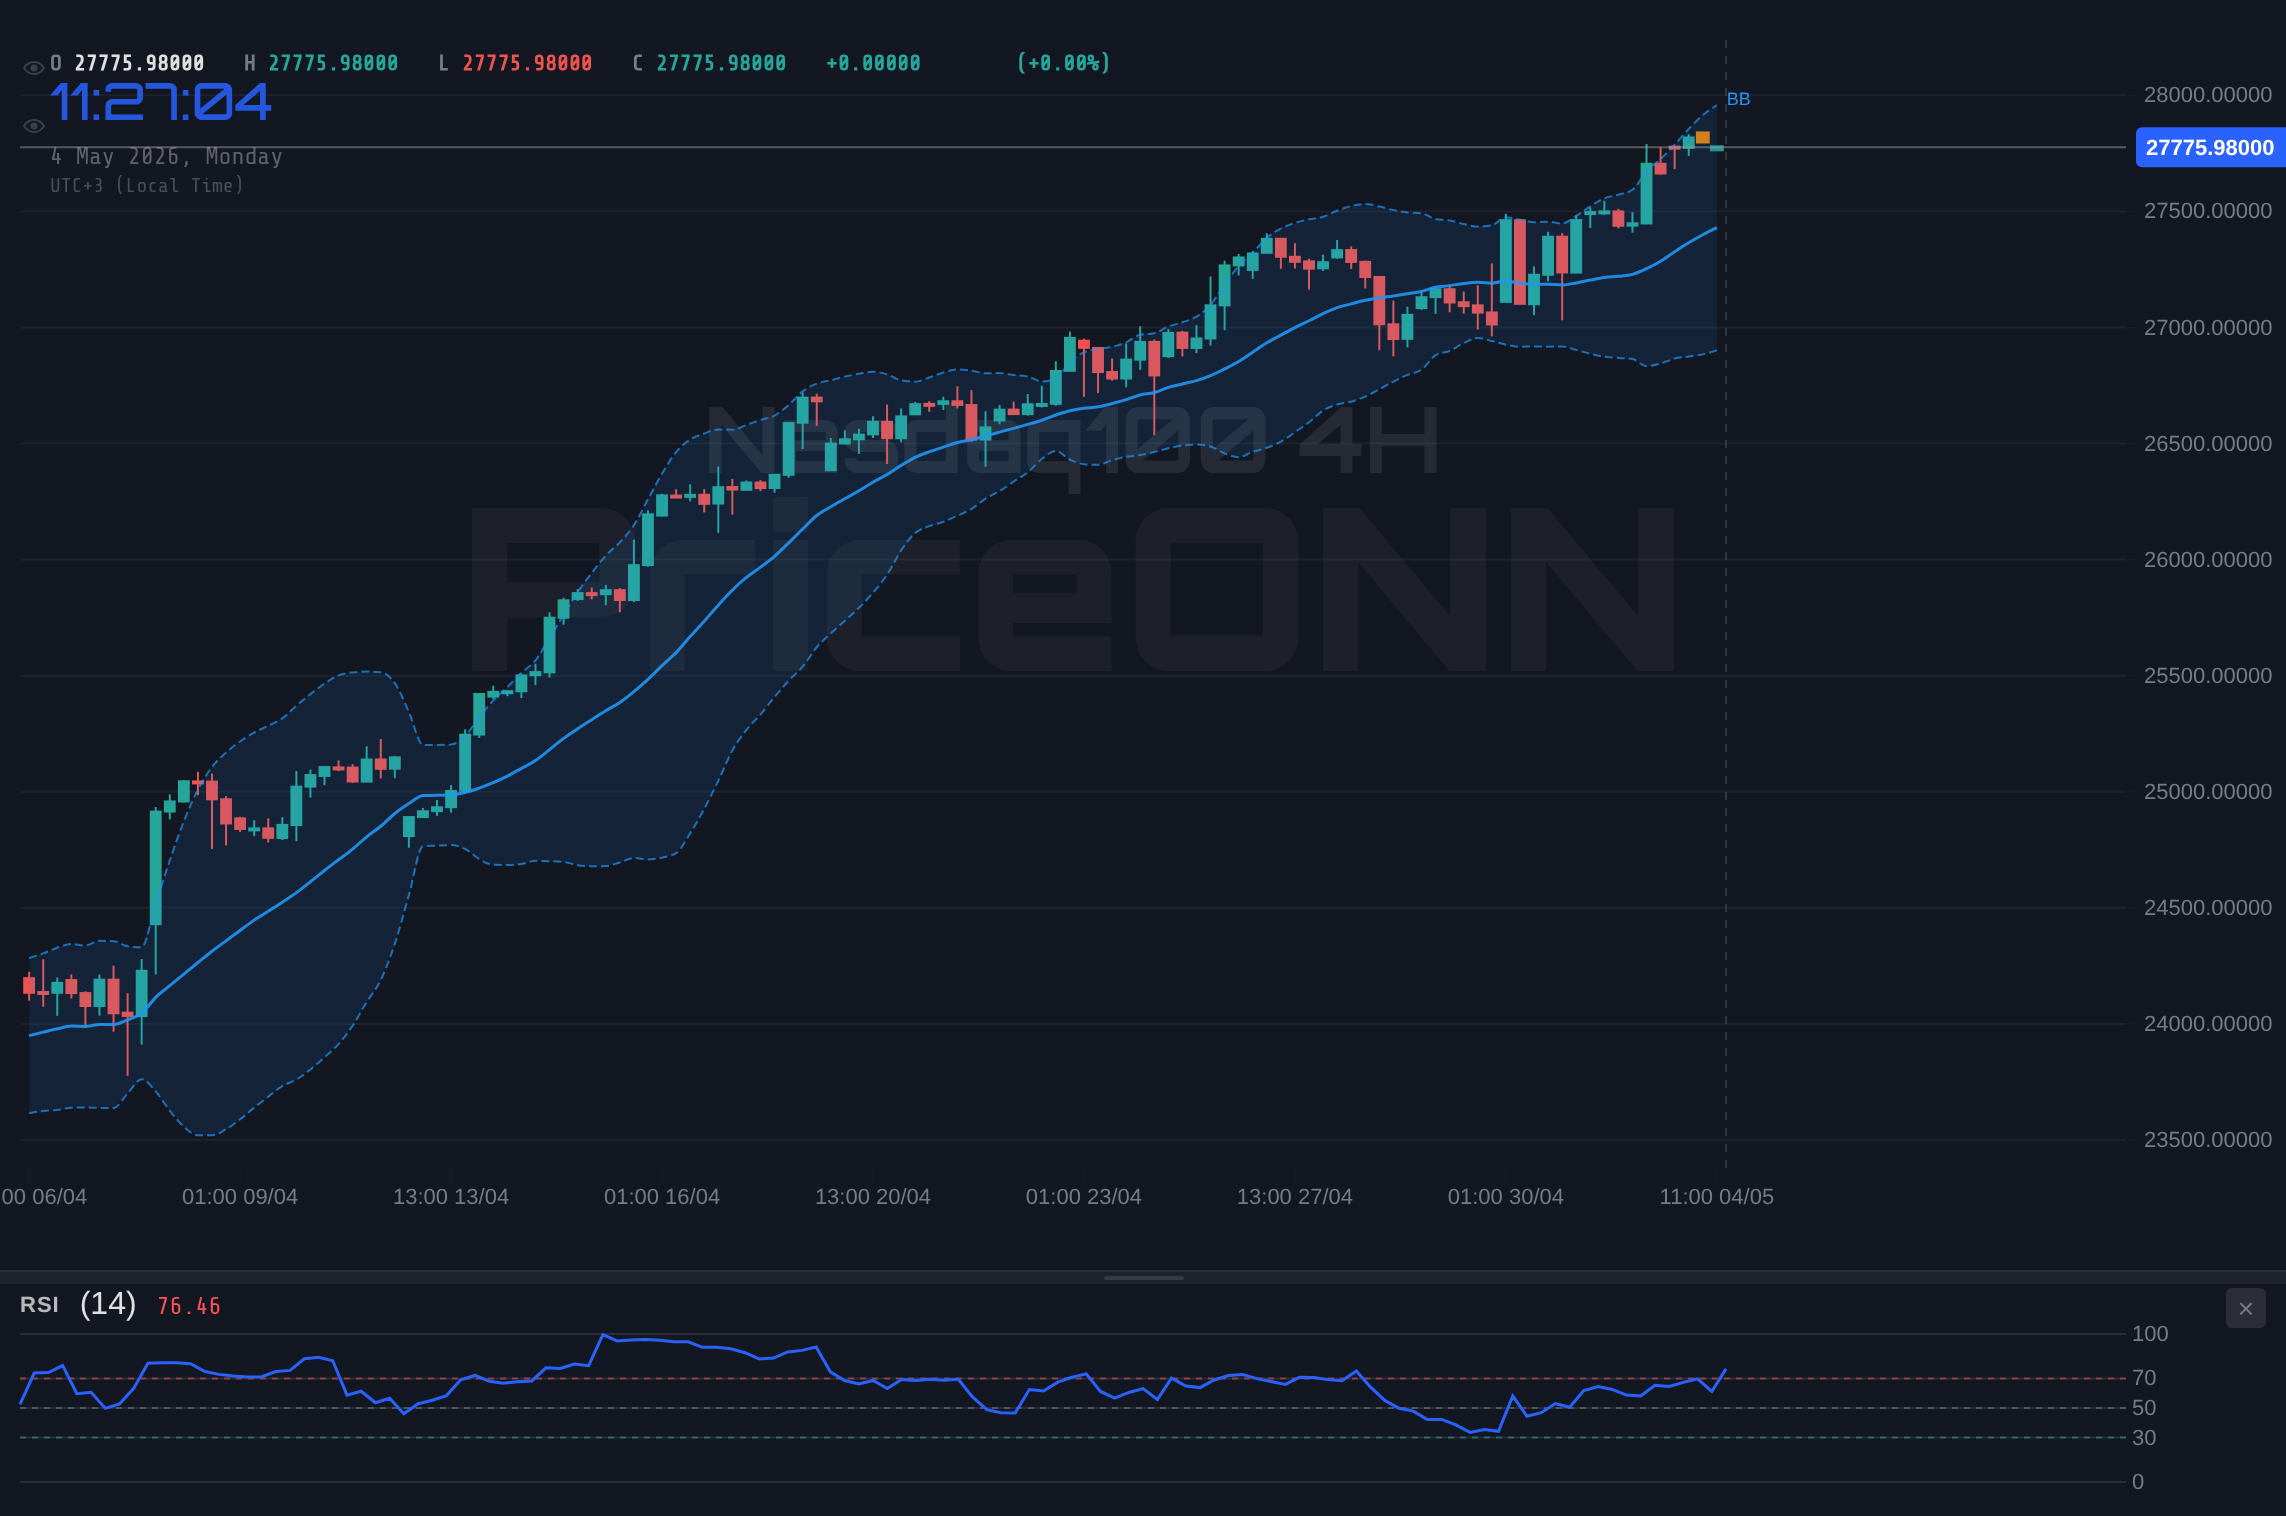
The 4-hour chart paints a mixed picture. While the RSI stands at 54.7, indicating neutral momentum, the Stochastic indicator signals a potential overbought condition, suggesting that the recent rally may be losing steam. The ADX, at a weak 15.87, further reinforces the notion of a lack of clear trend direction, leaving the market vulnerable to sudden shifts in sentiment. Having tracked Nasdaq100 through the 2024 rate cycle, it's clear that these indecisive periods often precede significant market moves.
The daily chart shows a clear resistance level at $25,178.03. A break above this level could signal a continuation of the upward trend, while a failure to break through could lead to a reversal.
The Fed's Tightrope Walk and Nasdaq100 Price Forecast
The Federal Reserve's upcoming policy decisions are expected to play a pivotal role in shaping the future trajectory of the Nasdaq 100. With inflation remaining stubbornly above the Fed's 2% target, the central bank faces a delicate balancing act between maintaining price stability and supporting economic growth. The recent surge in oil prices, fueled by geopolitical tensions and supply concerns, has further complicated the Fed's task, adding to the inflationary pressures and raising the specter of stagflation.
The CME FedWatch Tool currently prices in a [Hypothetical Probability]% probability of a [Hypothetical Rate Hike] basis point rate hike at the [Month] meeting. However, the market's expectations are highly sensitive to incoming economic data, particularly the CPI figures. A stronger-than-expected CPI print could embolden the Fed to adopt a more hawkish stance, potentially triggering a sell-off in risk assets, including the Nasdaq 100. Conversely, a weaker-than-expected CPI reading could ease concerns over inflation, providing a boost to the index.
Trading Signals: What the Indicators Are Saying
The technical indicators offer a glimpse into the market's underlying dynamics. The Relative Strength Index (RSI) on the 1-hour chart stands at 55.35, indicating neutral momentum. The bears are pressing, as the MACD histogram is negative, but there is a bullish crossover as well. The ADX is at 14.77, which indicates that the current trend is weak. The Stochastic indicator, with K=40.71 and D=28.91, is showing a bullish signal. Historically, when RSI reaches this zone on Nasdaq100, the outcome has been mixed, underscoring the need for caution and confirmation.
On the 4-hour chart, the RSI is at 54.7, again signaling neutral conditions. The MACD is showing positive momentum, but the Stochastic is showing a bearish signal, with K=49.26 and D=74.74. The ADX remains weak at 15.87. On the daily chart, the RSI is at 50.48, also signaling neutral conditions. The MACD is showing positive momentum, and the Stochastic is showing a bullish signal, with K=74.78 and D=56.21. The ADX is at 28.4, which means the trend is a strong downward trend. The signals are confusing, but the price action is bearish.
Conflicting indicator signals suggest high volatility and increased risk. Traders should exercise caution and manage their positions accordingly.
Potential Trade Plan: Watch the Breakout
Given the current market conditions, a conservative approach may be warranted. The ADX at 15.87 suggests a choppy market, making directional trades risky. However, the convergence of RSI and MACD histogram signals presents a potential opportunity for patient traders. A daily close above $25,178.03 would open the door for a test of the $25,374.41 level, while a break below $24,795.58 could trigger a move towards $24,609.51.
This pattern last appeared in January 2026, when price subsequently rallied 5% before retracing. Manage your risk, wait for your setup-the market always gives a second chance. With disciplined risk management, these choppy waters can be navigated safely.
Frequently Asked Questions: Nasdaq100 Analysis
What happens if Nasdaq100 breaks above $25,178.03 resistance?
A sustained break above the $25,178.03 resistance level could trigger a significant rally, potentially targeting the $25,374.41 and $25,560.48 levels. This would likely be driven by renewed bullish sentiment and increased buying pressure.
Should I buy Nasdaq100 at current levels of $25,041.29 given RSI at 55.35?
With the RSI at 55.35, the Nasdaq100 is neither overbought nor oversold, suggesting that the current price level is relatively neutral. A buy position could be considered on a confirmed breakout above $25,178.03, but caution is advised due to the looming CPI data and potential for increased volatility.
Is the MACD signal a reliable indicator for Nasdaq100 trend analysis right now?
The MACD histogram shows declining negative momentum, hinting at a possible bullish reversal. However, it's important to note that the MACD is a lagging indicator, and its signals should be confirmed by other technical indicators and price action before making any trading decisions.
How will the upcoming CPI data affect Nasdaq100 this week?
The upcoming CPI data is expected to have a significant impact on the Nasdaq100. A stronger-than-expected CPI print could trigger a sell-off, while a weaker-than-expected reading could provide a boost to the index. The market's reaction will depend on the magnitude of the deviation from expectations and the Fed's subsequent response.
Track markets in real-time
AI-powered analysis, technical indicators and real-time price data.
Join Our Telegram Channel
Breaking market news, AI analysis and trading signals instantly.
Join Channel