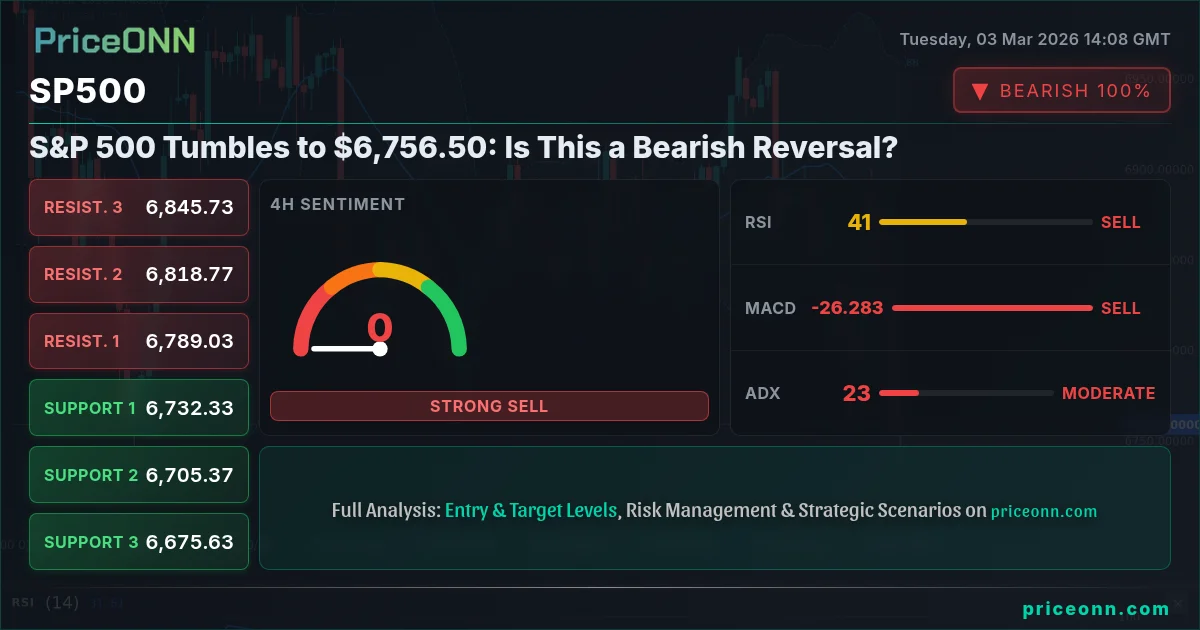
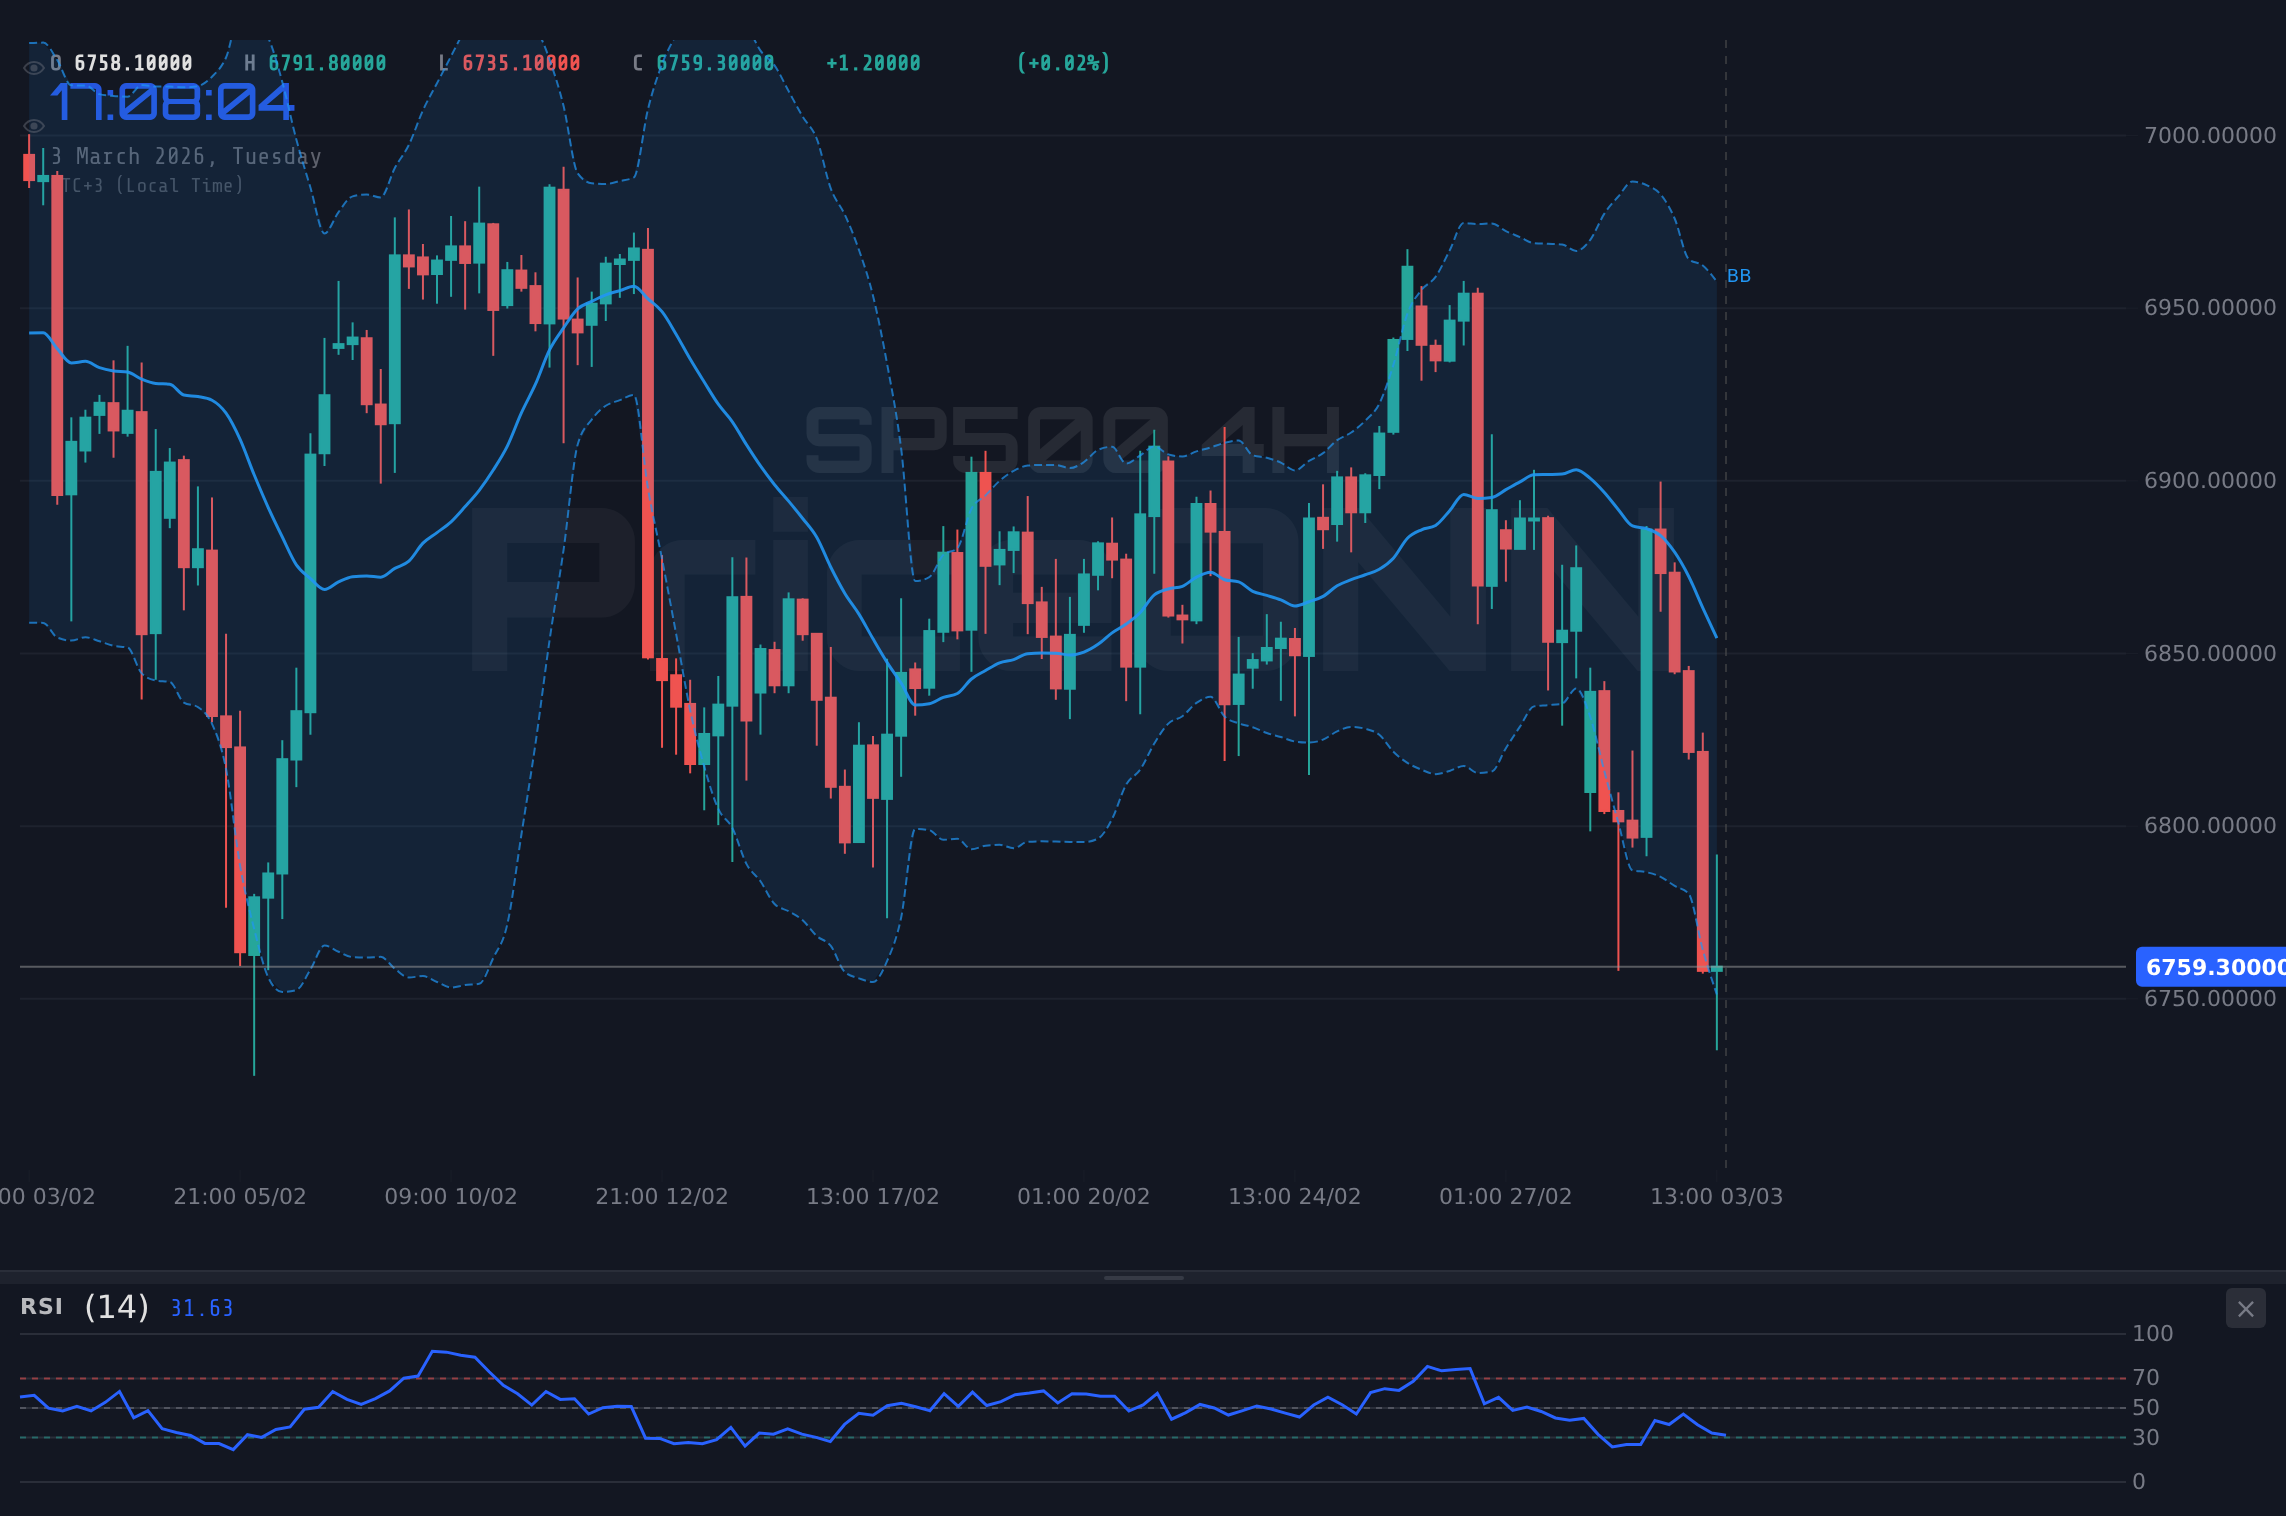
The S&P 500 finds itself at a critical juncture, currently trading at $6,756.50, as bulls and bears wrestle for control. A confluence of factors, including escalating geopolitical tensions in the Middle East and concerning signals from recent PMI data, have fueled a sharp sell-off. The question now is whether this is a temporary pullback or the beginning of a more sustained bearish trend. This s&p 500 analysis today will examine the key levels, technical indicators, and fundamental drivers shaping the index's outlook.
- RSI at 33.91 on the 1H chart suggests potential oversold conditions, but not a definitive reversal signal.
- Critical support lies at $6,734.57, a break below which could trigger further downside.
- MACD histogram confirms negative momentum on multiple timeframes, favoring the bearish scenario.
- DXY strength, currently at 98.92, continues to exert downward pressure on the S&P 500.
The Bullish Case: A Temporary Pullback
Despite the recent downturn, there are arguments to be made for a potential bullish reversal. One key factor is the oversold conditions emerging on shorter timeframes. The 1-hour RSI, for instance, sits at 33.91, suggesting that the index may be due for a bounce. Furthermore, the Stochastic oscillator on the 1-hour chart shows %K at 31.44 crossing above %D at 13.78, generating a potential buy signal. From a historical perspective, similar RSI levels have often preceded short-term rallies in the S&P 500. Scalpers might look for intraday long opportunities as price tests the $6,734.57 support.
Another bullish argument centers on the potential for a shift in market sentiment. As Forex News reported, the Dollar Index (DXY) has broken out amid geopolitical tensions. While a stronger dollar generally weighs on equities, a resolution to these tensions could lead to a relief rally in risk assets. Additionally, the upcoming U.S. ADP Nonfarm Employment Change data on Wednesday could surprise to the upside, providing a boost to the S&P 500. A strong jobs report could quell concerns about economic slowdown and reignite bullish sentiment. Long-term investors might view the current dip as a buying opportunity, as long as the index holds above key long-term support levels, which we'll discuss later.
Technically, a break above the immediate resistance at $6,796.5 on the 1-hour chart would lend credence to the bullish case. This would suggest that the bears are losing momentum and that buyers are stepping in to defend the index. A sustained move above this level could pave the way for a retest of the $6,808.9 resistance, and potentially even the $6,826 level. However, it's crucial to acknowledge the conflicting signals. While the 1-hour RSI suggests oversold conditions, the 4-hour and daily charts paint a different picture, with the RSI remaining in neutral territory.
The Bearish Case: A Deeper Correction is Brewing
On the other side of the coin, there are compelling reasons to believe that the S&P 500 is headed for a deeper correction. The recent decline has been driven by a combination of factors, including rising geopolitical risks and weak economic data. The Forex Market reacted to Middle East Tensions, which has caused the S&P to fall. The negative momentum on multiple timeframes is a cause for concern. The MACD histogram, for instance, is negative on the 1-hour, 4-hour, and daily charts, indicating that selling pressure is intensifying. The ADX on the daily chart sits at 27.62, confirming that the downtrend has considerable strength behind it. Swing traders might consider short positions as the index tests resistance levels, with a stop-loss placed above $6,800.
Furthermore, the strength of the U.S. dollar, as reflected in the rising DXY, is creating headwinds for the S&P 500. With the DXY currently at 98.92, and showing a strong upward trend on the 1-hour and 4-hour charts, it's likely that the S&P 500 will continue to face downward pressure. Historically, there's an inverse correlation between the DXY and the S&P 500. A stronger dollar makes U.S. exports more expensive, which can negatively impact corporate earnings and weigh on the index. Look at the EURUSD which is currently trading at 1.15954 and is down 0.77% for the day. This indicates that the dollar is strong relative to the euro.
Technically, a break below the $6,734.57 support level would be a significant bearish signal. This would confirm that the bears are in control and that the index is likely to test lower levels. The next key support level to watch is $6,711.03, followed by $6,664.77. The Bollinger Bands on the daily chart show that the price is trading near the lower band, further suggesting that the downtrend has room to run. The overall signal is SAT (sell), which represents that most technical indicators are pointing to the asset being oversold.
Correlation Analysis: DXY, Bonds, and Oil
A comprehensive analysis of the S&P 500 requires examining its correlation with other key asset classes. As previously mentioned, the DXY plays a crucial role in shaping the index's outlook. A rising DXY typically exerts downward pressure on the S&P 500, while a falling DXY provides a tailwind. Bond yields also play a significant role. Rising Treasury yields can weigh on equities, as they increase borrowing costs for companies and make bonds more attractive to investors. Conversely, falling yields can support equities. The price of oil is another important factor to consider. Rising oil prices can fuel inflation concerns, which can lead to tighter monetary policy from the Federal Reserve, ultimately weighing on the S&P 500. Currently, WTI is at $77.15 and is up 8.77% for the day, indicating the potential for inflation.
The correlation between the S&P 500 and the Nasdaq 100 is also worth noting. Historically, the two indices have moved in tandem, but there can be periods of divergence. If the Nasdaq 100 is outperforming the S&P 500, it suggests that investors are favoring growth stocks over value stocks. Conversely, if the S&P 500 is outperforming the Nasdaq 100, it suggests that investors are favoring value stocks over growth stocks. Currently, the Nasdaq 100 is at 24441.26 and is down 2.06% for the day, while the S&P 500 is at 6756.5 and is down 1.7% for the day. This indicates that the Nasdaq 100 is underperforming the S&P 500, which suggests that investors are favoring value stocks over growth stocks.
What Happens Next? Short-Term and Medium-Term Forecasts
Given the conflicting signals, it's crucial to adopt a balanced approach and consider both bullish and bearish scenarios. In the short term (1-3 days), the S&P 500 is likely to remain volatile, with price action driven by news headlines and economic data releases. The upcoming U.S. ADP Nonfarm Employment Change data on Wednesday will be a key catalyst. A strong jobs report could trigger a short-term rally, while a weak report could exacerbate the sell-off. The key level to watch is the $6,734.57 support. A break below this level would likely lead to a test of the $6,711.03 support. The probability of a short-term rally is currently assessed at 40%, while the probability of a further decline is assessed at 60%.
In the medium term (1-2 weeks), the outlook for the S&P 500 will depend on the resolution of geopolitical tensions and the overall trajectory of the U.S. economy. If tensions ease and economic data remains strong, the index could stage a more sustained recovery. However, if tensions escalate and economic data deteriorates, the S&P 500 could be headed for a deeper correction. The key levels to watch are the $6,804.37 resistance and the $6,664.77 support. A sustained move above the resistance would suggest that the bulls are back in control, while a break below the support would confirm the bearish trend. The probability of a medium-term recovery is currently assessed at 35%, while the probability of a further decline is assessed at 65%.
The current market environment is characterized by uncertainty and volatility. The S&P 500 is at a critical juncture, with bulls and bears battling for control. The index is down 1.7% for the day and is currently trading at $6,756.50. Scalpers, swing traders, and long-term investors should all be monitoring the key levels and technical indicators discussed in this analysis. Patience and disciplined risk management will be crucial for navigating the choppy waters ahead. Remember that markets always provide a second chance, so wait for your setup and manage your risk accordingly.
Frequently Asked Questions: SP500 Analysis
Is SP500 a good buy right now?
Given the current downtrend and negative momentum, it's premature to call the S&P 500 a good buy right now. Wait for a confirmed break above the $6,804.37 resistance level, or a test of the $6,711.03 support, before considering a long position.
What is the SP500 price forecast for this week?
The SP500 price forecast for this week is highly uncertain, with a 65% probability of further decline. The key target to the downside is the $6,664.77 support. A break above $6,804.37 would shift the outlook to neutral.
What are the key support and resistance levels for SP500?
Key support levels for the SP500 are $6,734.57, $6,711.03, and $6,664.77. Key resistance levels are $6,804.37, $6,850.63, and $6,874.17. These levels represent potential areas of buying and selling pressure.
Why is SP500 moving today?
The SP500 is moving lower today due to a combination of factors, including rising geopolitical tensions in the Middle East, weak economic data from PMI releases, and strength in the U.S. dollar.
Track markets in real-time
AI-powered analysis, technical indicators and real-time price data.
Join Our Telegram Channel
Breaking market news, AI analysis and trading signals instantly.
Join Channel