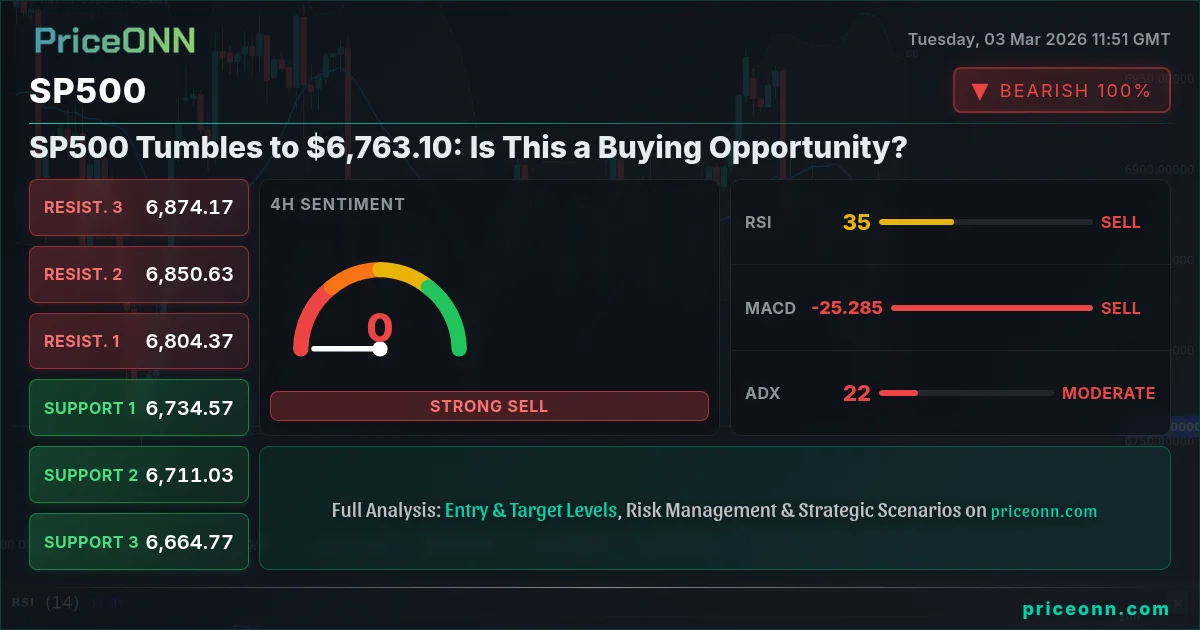
The S&P 500 (SP500) is under pressure, currently trading at $6,763.10, as geopolitical tensions escalate and recent PMI data disappoints. This raises the question: Is this a temporary pullback or the beginning of a more significant correction? The "sp500 technical analysis today" reveals a complex picture of both bearish and potentially bullish signals.
- RSI at 30.53 suggests oversold conditions on the 1-hour chart, potentially signaling a short-term bounce.
- Key support level at $6,739.30, a break below which could trigger further downside.
- MACD histogram shows negative momentum, indicating sustained selling pressure.
- DXY strength, currently at 98.94, is weighing on the SP500's performance.
Having tracked the SP500 through multiple economic cycles, the current situation presents a unique confluence of factors. The dollar index (DXY) has surged past 98.70 as reported by Forex News, fueled by escalating tensions in the Middle East and a flight to safe-haven assets. This DXY strength is putting downward pressure on the SP500. Simultaneously, recent economic data, particularly the Purchasing Managers Index (PMI), has come in weaker than expected, adding to investor concerns. The upcoming U.S. ADP Nonfarm Employment Change data on Wednesday will be critical.
SP500: Decoding the Technical Signals
From a technical perspective, the SP500's one-hour chart paints a mixed picture. The RSI (14) currently sits at 30.53, indicating that the index is nearing oversold territory. This suggests that a short-term bounce could be imminent. However, it's crucial to remember that oversold conditions can persist for extended periods, especially in a strong downtrend. The ADX, currently at 25.89, confirms a strong downtrend on the 1H timeframe, advising caution against aggressively betting on a reversal just yet. It is important to note that the Stochastic values on the 1H timeframe are showing K=7.71 and D=4.45, both in oversold territory, which could suggest a potential buying opportunity for short-term traders.
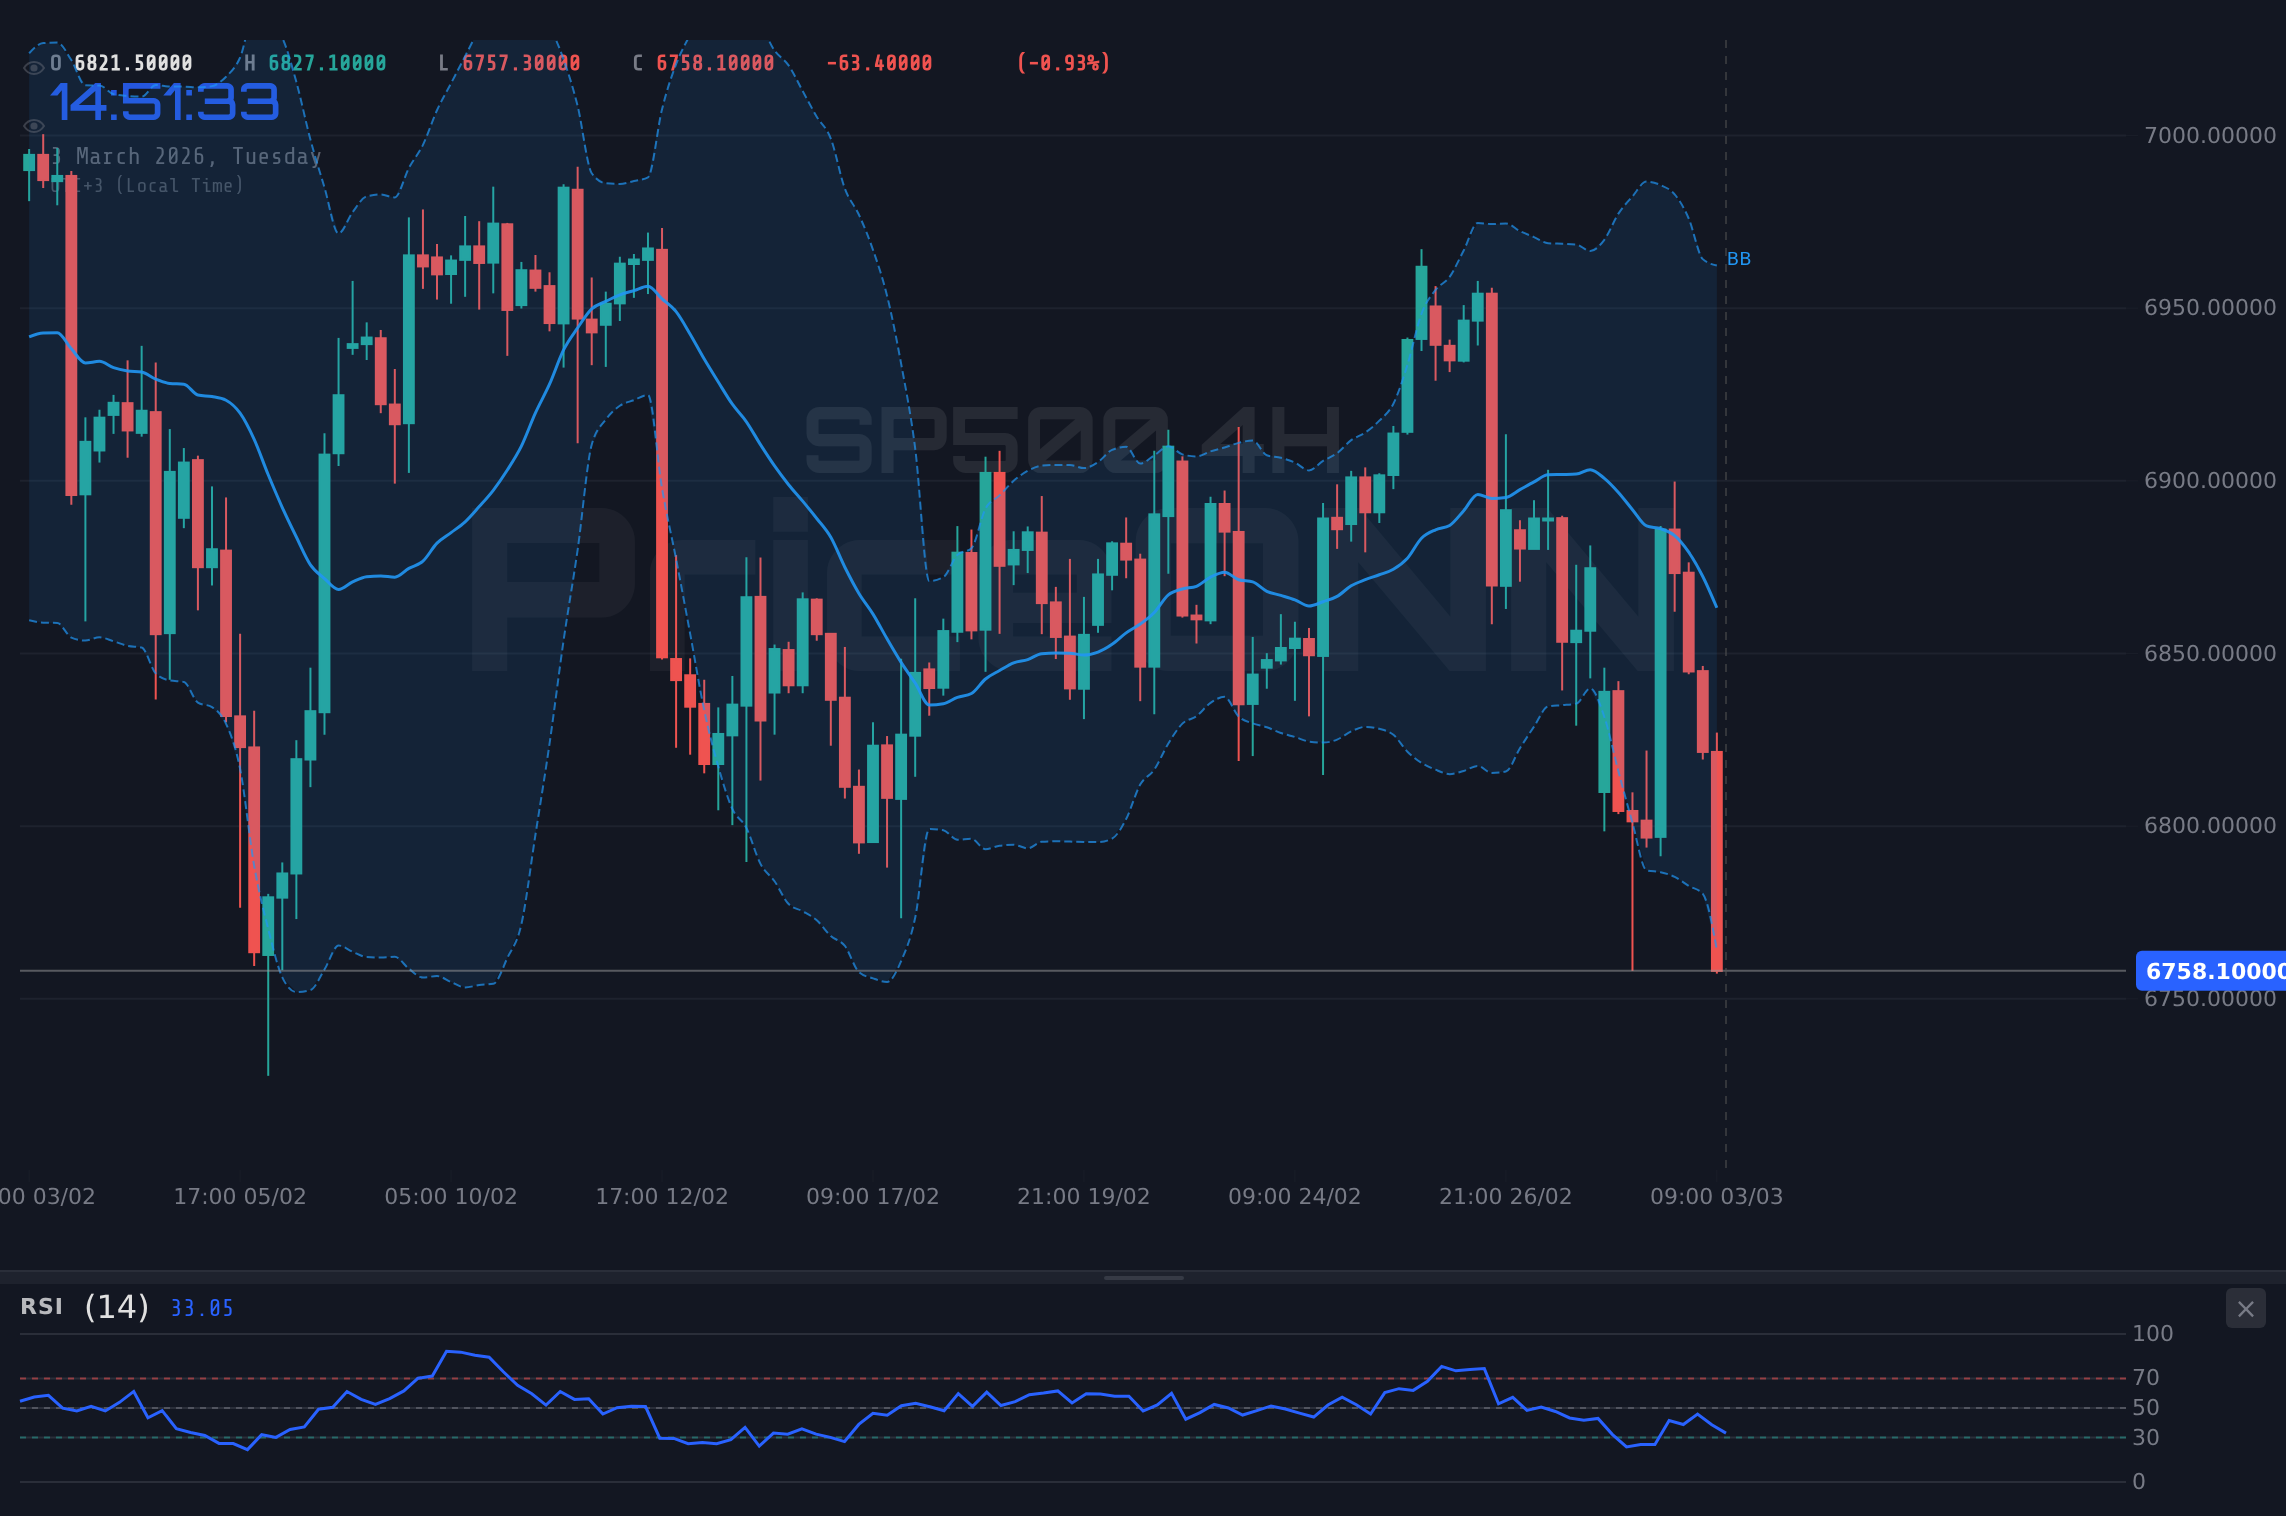
On the 4-hour timeframe, the SP500 presents a less optimistic picture. The RSI (14) sits at 35.67, still in neutral territory but trending downward. The MACD histogram displays negative momentum, suggesting that selling pressure remains dominant. The SP500 is trading below its middle Bollinger Band, further reinforcing the bearish bias. The first support level to watch is $6748.70. A decisive break below this level could open the door for a test of the lower supports at $6739.30 and $6721.30.
Why $6,739.30 is the Line in the Sand
The $6,739.30 level is particularly significant because it represents a confluence of technical support and psychological importance. It has been tested multiple times in recent sessions, and each test has seen a temporary bounce. However, the repeated tests weaken the support, making it more vulnerable to a breakdown. If the SP500 closes below $6,739.30 on the 4-hour chart, it would signal a potential continuation of the downtrend and could trigger further selling pressure. This is exactly where you need to pay attention.
Looking at the daily chart, the SP500 trend is classified as a downtrend with a strength of 99%. The RSI(14) is at 39.87, and the Stochastic shows K=39.84, D=58.39, which is giving a bearish signal. The ADX is showing a strong downtrend at 27.62. The first support level is at 6787.67, but a break below that could open the door to further declines.
USD Strength Adds Fuel to the Fire
With the DXY currently at 98.94, the dollar's strength is adding to the SP500's woes. A stronger dollar makes U.S. equities less attractive to foreign investors, further dampening demand. The SP500 and DXY often exhibit an inverse relationship, and the current dynamic is a clear example of this. If the DXY continues to climb amid ongoing geopolitical tensions, the SP500 is likely to face continued headwinds. However, it's crucial to monitor upcoming economic data releases, such as the U.S. ADP Nonfarm Employment Change on Wednesday. A weaker-than-expected number could trigger a reversal in the DXY and provide some relief for the SP500.
Potential Scenarios for the SP500
Given the current technical and fundamental landscape, several scenarios could play out in the coming sessions.
A short-term bounce from oversold conditions, driven by a weaker-than-expected ADP Nonfarm Employment Change on Wednesday. This would require a decisive break above the $6776.10 resistance level, with a target of $6794.10.
Continued selling pressure driven by DXY strength and weak economic data. This would involve a break below the $6739.30 support level, with a target of $6721.30 and potentially lower supports.
SP500 Weekly Outlook: What Traders Need to Watch
For swing traders, the weekly outlook for the SP500 is crucial. The index is currently testing a key support level on the weekly chart. A breakdown below this level would signal a more significant correction and could lead to further downside in the coming weeks. Traders should closely monitor the price action around this level and be prepared to adjust their positions accordingly.
Long-term investors should remain cautious but also recognize that market corrections can present buying opportunities. Patient investors always find opportunities-the key is waiting for the right moment. As the SP500 navigates this turbulent period, disciplined risk management is paramount.
SP500 News Impact: Geopolitical Tensions and Economic Data
Escalating geopolitical tensions in the Middle East are contributing to the overall risk-off sentiment in the market. The surge in oil prices, as reported by commodities outlets, is adding to inflationary pressures and further complicating the economic outlook. The conflict between Iran, Israel, and the U.S. is driving gold prices higher as investors seek safe-haven assets. This flight to safety is further weighing on risk assets like the SP500.
As mentioned earlier, the upcoming U.S. economic data releases will be critical in determining the SP500's near-term trajectory. The U.S. ADP Nonfarm Employment Change, U.S. Services Purchasing Managers Index (PMI), and U.S. ISM Non-Manufacturing Purchasing Managers Index (PMI) are all closely watched indicators that could significantly impact market sentiment and the Fed's policy outlook. The FOMC Member Williams Speaks and Kashkari Speaks events today could offer further insights into the Fed's thinking.
Frequently Asked Questions: SP500 Analysis
Is SP500 a good buy right now?
Given the current downtrend, SP500 is not a clear buy right now. The price of $6,763.10 is below key resistance levels, suggesting further downside. A more attractive entry point may emerge upon a confirmed reversal signal or a break above $6,776.10.
What is the SP500 price forecast for this week?
The SP500 price forecast for this week depends heavily on upcoming economic data. A bearish scenario targets $6,721.30, while a bullish scenario aims for $6,794.10. The probability of each scenario will depend on the data releases.
What are the key support and resistance levels for SP500?
Key support levels for SP500 are at $6,739.30, $6,721.30 and $6787.67. Key resistance levels are at $6776.10, $6794.10 and $6803.5. A break of either support or resistance will dictate the next move.
Why is SP500 moving today?
SP500 is moving today due to a combination of factors including geopolitical tensions, weaker-than-expected PMI data, and a stronger dollar. These factors are creating a risk-off environment and weighing on equity prices.
Technical Outlook Summary
| Indicator | Value | Signal |
|---|---|---|
| RSI (14) - 1H | 30.53 | Neutral |
| MACD Histogram - 4H | Negative | Bearish |
| Stochastic - 1H | K=7.71, D=4.45 | Oversold |
| ADX - 1H | 25.89 | Strong Downtrend |
| Bollinger - 4H | Middle Band | Below |
Key Levels
Support Levels
Resistance Levels
Track markets in real-time
AI-powered analysis, technical indicators and real-time price data.
Join Our Telegram Channel
Breaking market news, AI analysis and trading signals instantly.
Join Channel