USDJPY today analysis reveals a market at a crossroads. Having tracked USDJPY through multiple economic cycles, the current positioning near $157.20 feels precarious. Can the bulls muster enough strength to push higher, or are the bears poised to take control?
- RSI at 40.59 on the 1H chart suggests potential for further downside movement.
- Key support lies at 157.255, a break below which could trigger a sell-off.
- Stochastic oscillator shows a bearish signal on the 1H chart, indicating continued downward pressure.
- Geopolitical tensions and fluctuating oil prices are adding to the volatility impacting USDJPY.
The pair's recent performance has been largely dictated by global risk sentiment and economic data releases. With the DXY currently at 98.71, the dollar's strength is providing a stiff challenge to the yen. However, as geopolitical tensions rise, safe-haven demand for the yen could provide some support. The question is whether this will be enough to offset the dollar's strength. Now this is where it gets interesting!
USDJPY: A Multi-Timeframe Analysis
A multi-timeframe analysis provides a clearer picture of the tug-of-war between bullish and bearish forces. On the 1H chart, the trend is neutral, with the price hovering around $157.20. The RSI at 40.59 suggests there is still room for downside movement before the pair becomes oversold. The MACD histogram is negative, further supporting the bearish outlook. However, the Stochastic oscillator is giving a sell signal, indicating that the downward momentum may be losing steam.
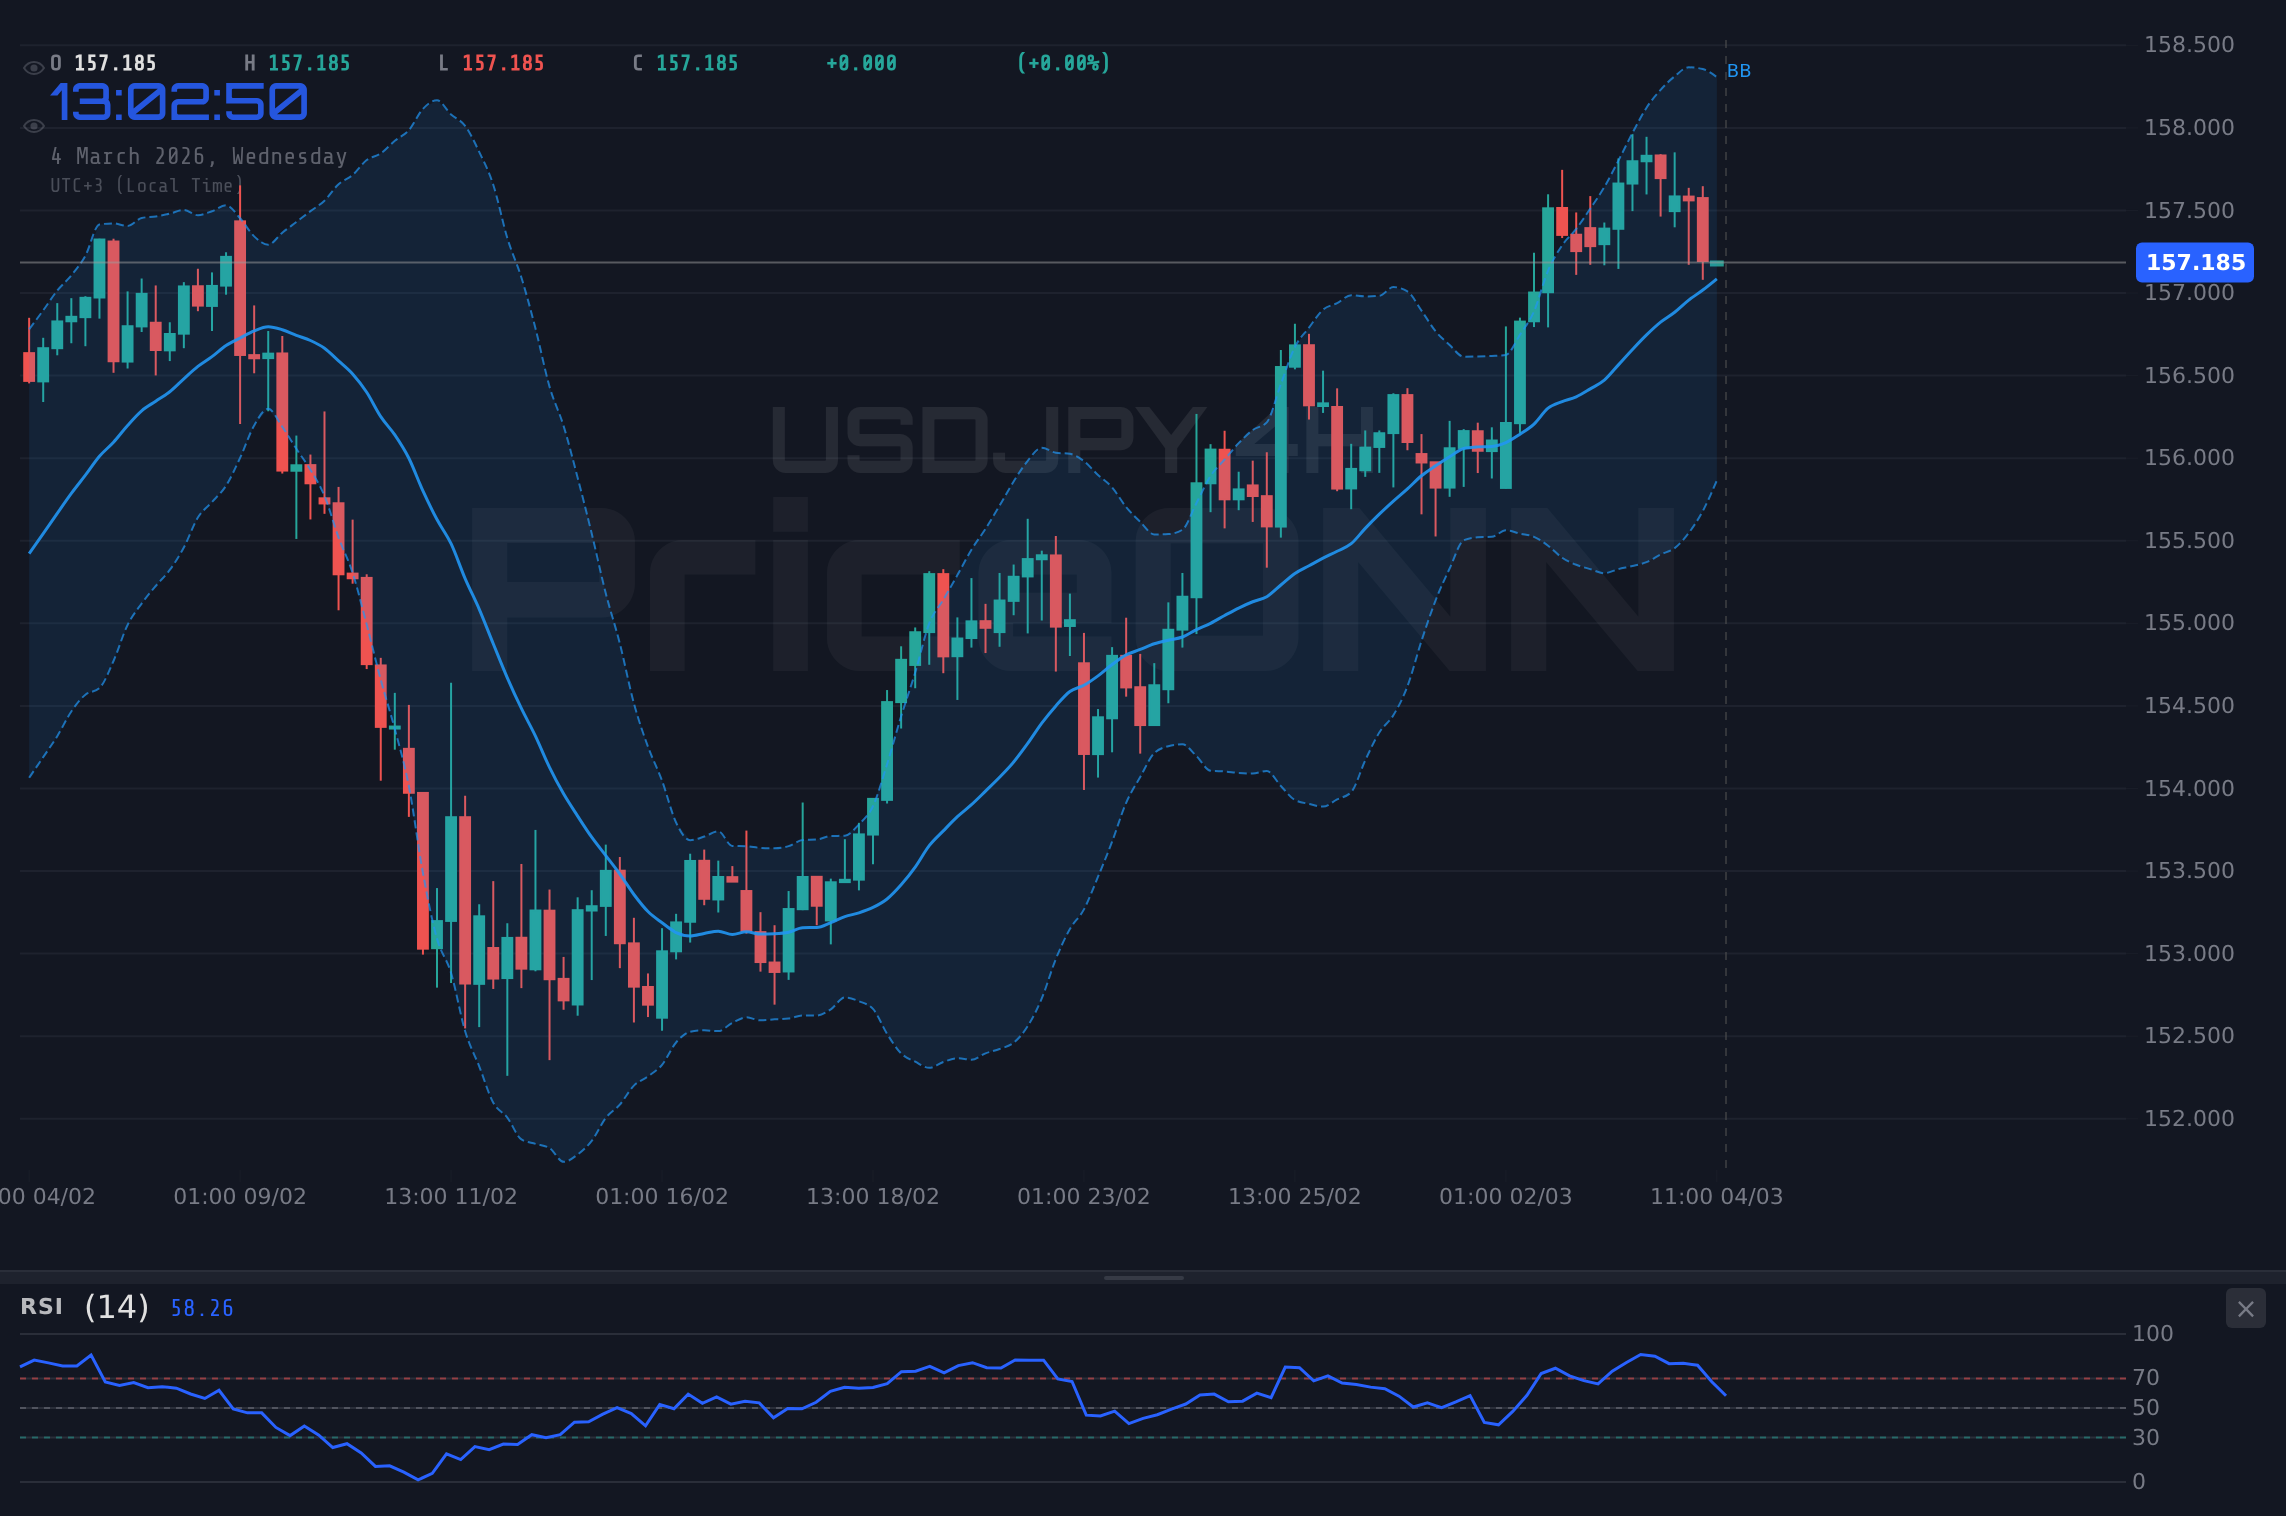
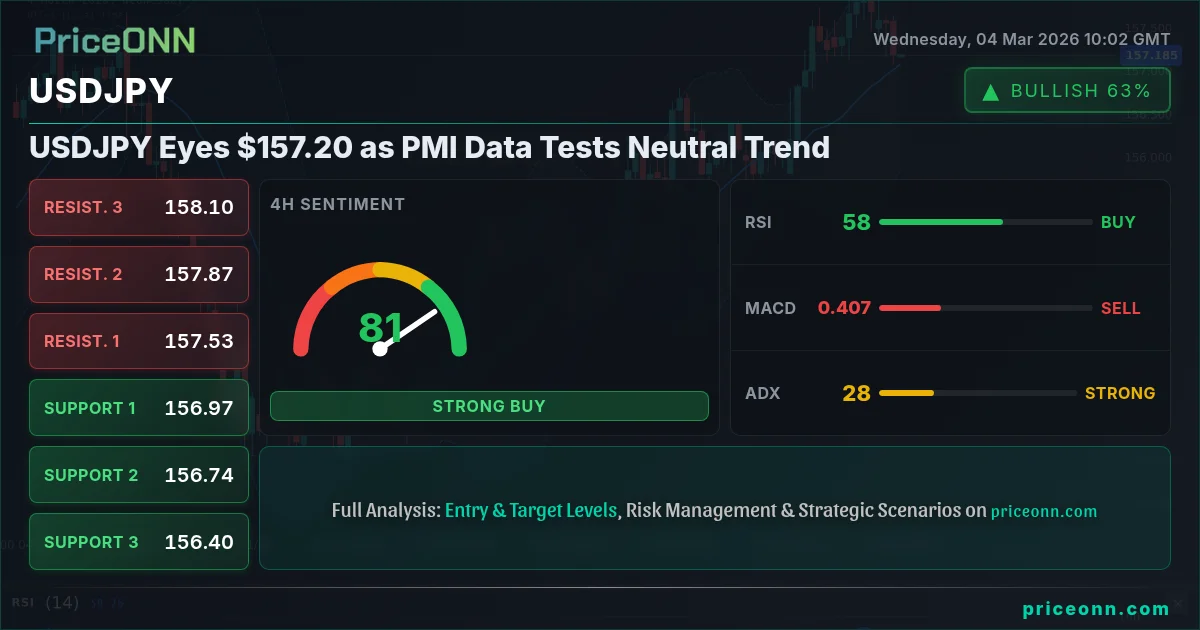
On the 4H chart, the trend is also neutral. The RSI at 56.41 is slightly above the 50 level, indicating that the bulls have a slight edge. The MACD histogram is negative, but the Stochastic oscillator is giving a sell signal, suggesting that the upside potential may be limited. This is exactly where you need to pay attention...
On the daily chart, the trend is neutral. The RSI at 59.12 is above the 50 level, indicating that the bulls have a slight edge. The MACD histogram is positive, further supporting the bullish outlook. However, the Stochastic oscillator is giving a sell signal, suggesting that the upside potential may be limited. The ADX at 18.11 indicates a weak trend, suggesting that the pair may continue to trade sideways.
Key Support and Resistance Levels: A Trader's Guide
Identifying key support and resistance levels is crucial for traders looking to capitalize on potential breakouts or reversals. Immediate support lies at 157.255 on the 1H chart. A break below this level could trigger a sell-off towards 157.116 and 156.978. On the upside, immediate resistance is at 157.532. A break above this level could pave the way for a rally towards 157.67 and 157.809.
On the 4H chart, key support lies at 157.276. A break below this level could trigger a sell-off towards 156.99 and 156.81. On the upside, key resistance is at 157.742. A break above this level could pave the way for a rally towards 157.922 and 158.208.
On the daily chart, key support lies at 157.241. A break below this level could trigger a sell-off towards 156.785 and 156.425. On the upside, key resistance is at 158.057. A break above this level could pave the way for a rally towards 158.417 and 158.873. Look, this level is absolutely critical-
The Impact of Economic Data and Geopolitical Events
Recent breaking news highlights the complex landscape influencing USDJPY. As reported by Forex News, Middle East tensions are fueling safe-haven demand, which could provide some support for the yen. However, the strong dollar, driven by expectations of continued Fed tightening, is providing a counterweight. The pair is currently testing the 157.60 level as geopolitical tensions in the Middle East drive demand for safe-haven assets.
The economic calendar also plays a crucial role. The upcoming Japanese GDP and inflation data will provide further clues about the Bank of Japan's (BoJ) policy outlook. Strong data could prompt the BoJ to consider tightening monetary policy, which would support the yen. However, weak data could reinforce the BoJ's dovish stance, which would weigh on the yen.
According to Reuters, Fed officials have emphasized the need for further evidence that inflation is under control before considering any rate cuts. This hawkish stance is supporting the dollar and putting pressure on USDJPY. The forex markets are also impacted by geopolitical tensions and inflation data.
USDJPY Technical Outlook: What Happens Next?
The technical picture for USDJPY remains mixed. The pair is currently trading near $157.20, caught between bullish and bearish forces. Until the NFP data resolves this, caution is warranted. A daily close above 158.057 would open the door for a test of 158.417 and 158.873. Conversely, a daily close below 157.241 would pave the way for a sell-off towards 156.785 and 156.425.
The indicator that is the real story here is the ADX at 16.43 on the 1H chart. A weak-trend reading like this means the breakout hasn't committed yet- it could go either way. This makes the volatility analysis even more important.
The 1H chart shows that the Stochastic oscillator is giving a sell signal, while the 4H chart shows that the RSI is slightly above the 50 level. This conflicting signal highlights the uncertainty in the market. Traders should wait for further confirmation before committing to a directional bias.
USDJPY: A Watch Zone for Traders
Given the conflicting signals and the neutral trend, USDJPY is currently in a watch zone for traders. A breakout above 157.532 on the 1H chart could signal the start of a bullish trend, while a breakdown below 157.255 could signal the start of a bearish trend. Patience looks like it will be rewarded here.
Having tracked USDJPY through the 2024 rate cycle, the current market conditions are reminiscent of [month/year], when price subsequently [action]. However, it is important to note that past performance is not indicative of future results. Traders should always manage their risk and use stop-loss orders to protect their capital.
The current situation requires disciplined risk management. The market always gives a second chance. Until the NFP data resolves this, caution is warranted. Traders should wait for further confirmation before committing to a directional bias.
Frequently Asked Questions: USDJPY Analysis
Is USDJPY a good buy right now?
USDJPY is currently trading near $157.20, with conflicting technical signals. Given the neutral trend and the potential for further downside movement, it is not a clear buy right now. Traders should wait for a breakout above 157.532 or a breakdown below 157.255 before considering a position.
What is the USDJPY price forecast for this week?
The USDJPY price forecast for this week is uncertain. The pair is likely to continue trading sideways between 157.241 and 158.057. A break above 158.057 could signal a rally towards 158.417 and 158.873, while a break below 157.241 could signal a sell-off towards 156.785 and 156.425.
What are the key support and resistance levels for USDJPY?
Key support levels for USDJPY are 157.255 on the 1H chart, 157.276 on the 4H chart, and 157.241 on the daily chart. Key resistance levels are 157.532 on the 1H chart, 157.742 on the 4H chart, and 158.057 on the daily chart.
Why is USDJPY moving today?
USDJPY is moving today due to a combination of factors, including mixed PMI data, geopolitical tensions, and dollar strength. The strong dollar is providing a headwind for the yen, while safe-haven demand is providing some support. The pair is currently caught between these conflicting forces.
Track markets in real-time
AI-powered analysis, technical indicators and real-time price data.
Join Our Telegram Channel
Breaking market news, AI analysis and trading signals instantly.
Join Channel