WTI Eyes $75.26 Amid Geopolitical Jitters: Breakout Imminent?
WTI crude oil flirts with $75.26 as geopolitical tensions mount. Will the bulls maintain control, or will bearish pressures drive a reversal?
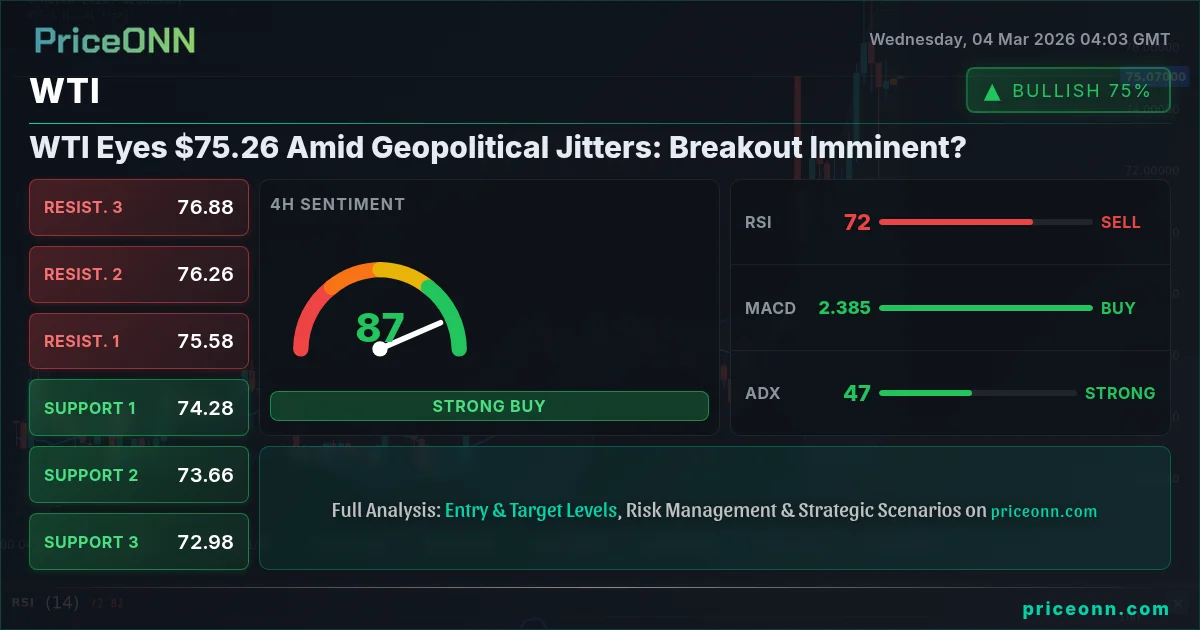
The crude oil market is at a critical juncture, with WTI currently trading at $75.26. Bulls are attempting to cement gains amidst escalating geopolitical tensions, while bears are lurking, ready to capitalize on any sign of weakness. The "crude oil trading strategy 2026" hinges on which force prevails at this key level.
- WTI is testing resistance at $75.40, the first hurdle to a sustained bullish breakout.
- Geopolitical risks, particularly escalating tensions in the Middle East, are providing a tailwind for crude oil prices.
- The upcoming U.S. ADP Nonfarm Employment Change data on Wednesday could introduce volatility, depending on the outcome.
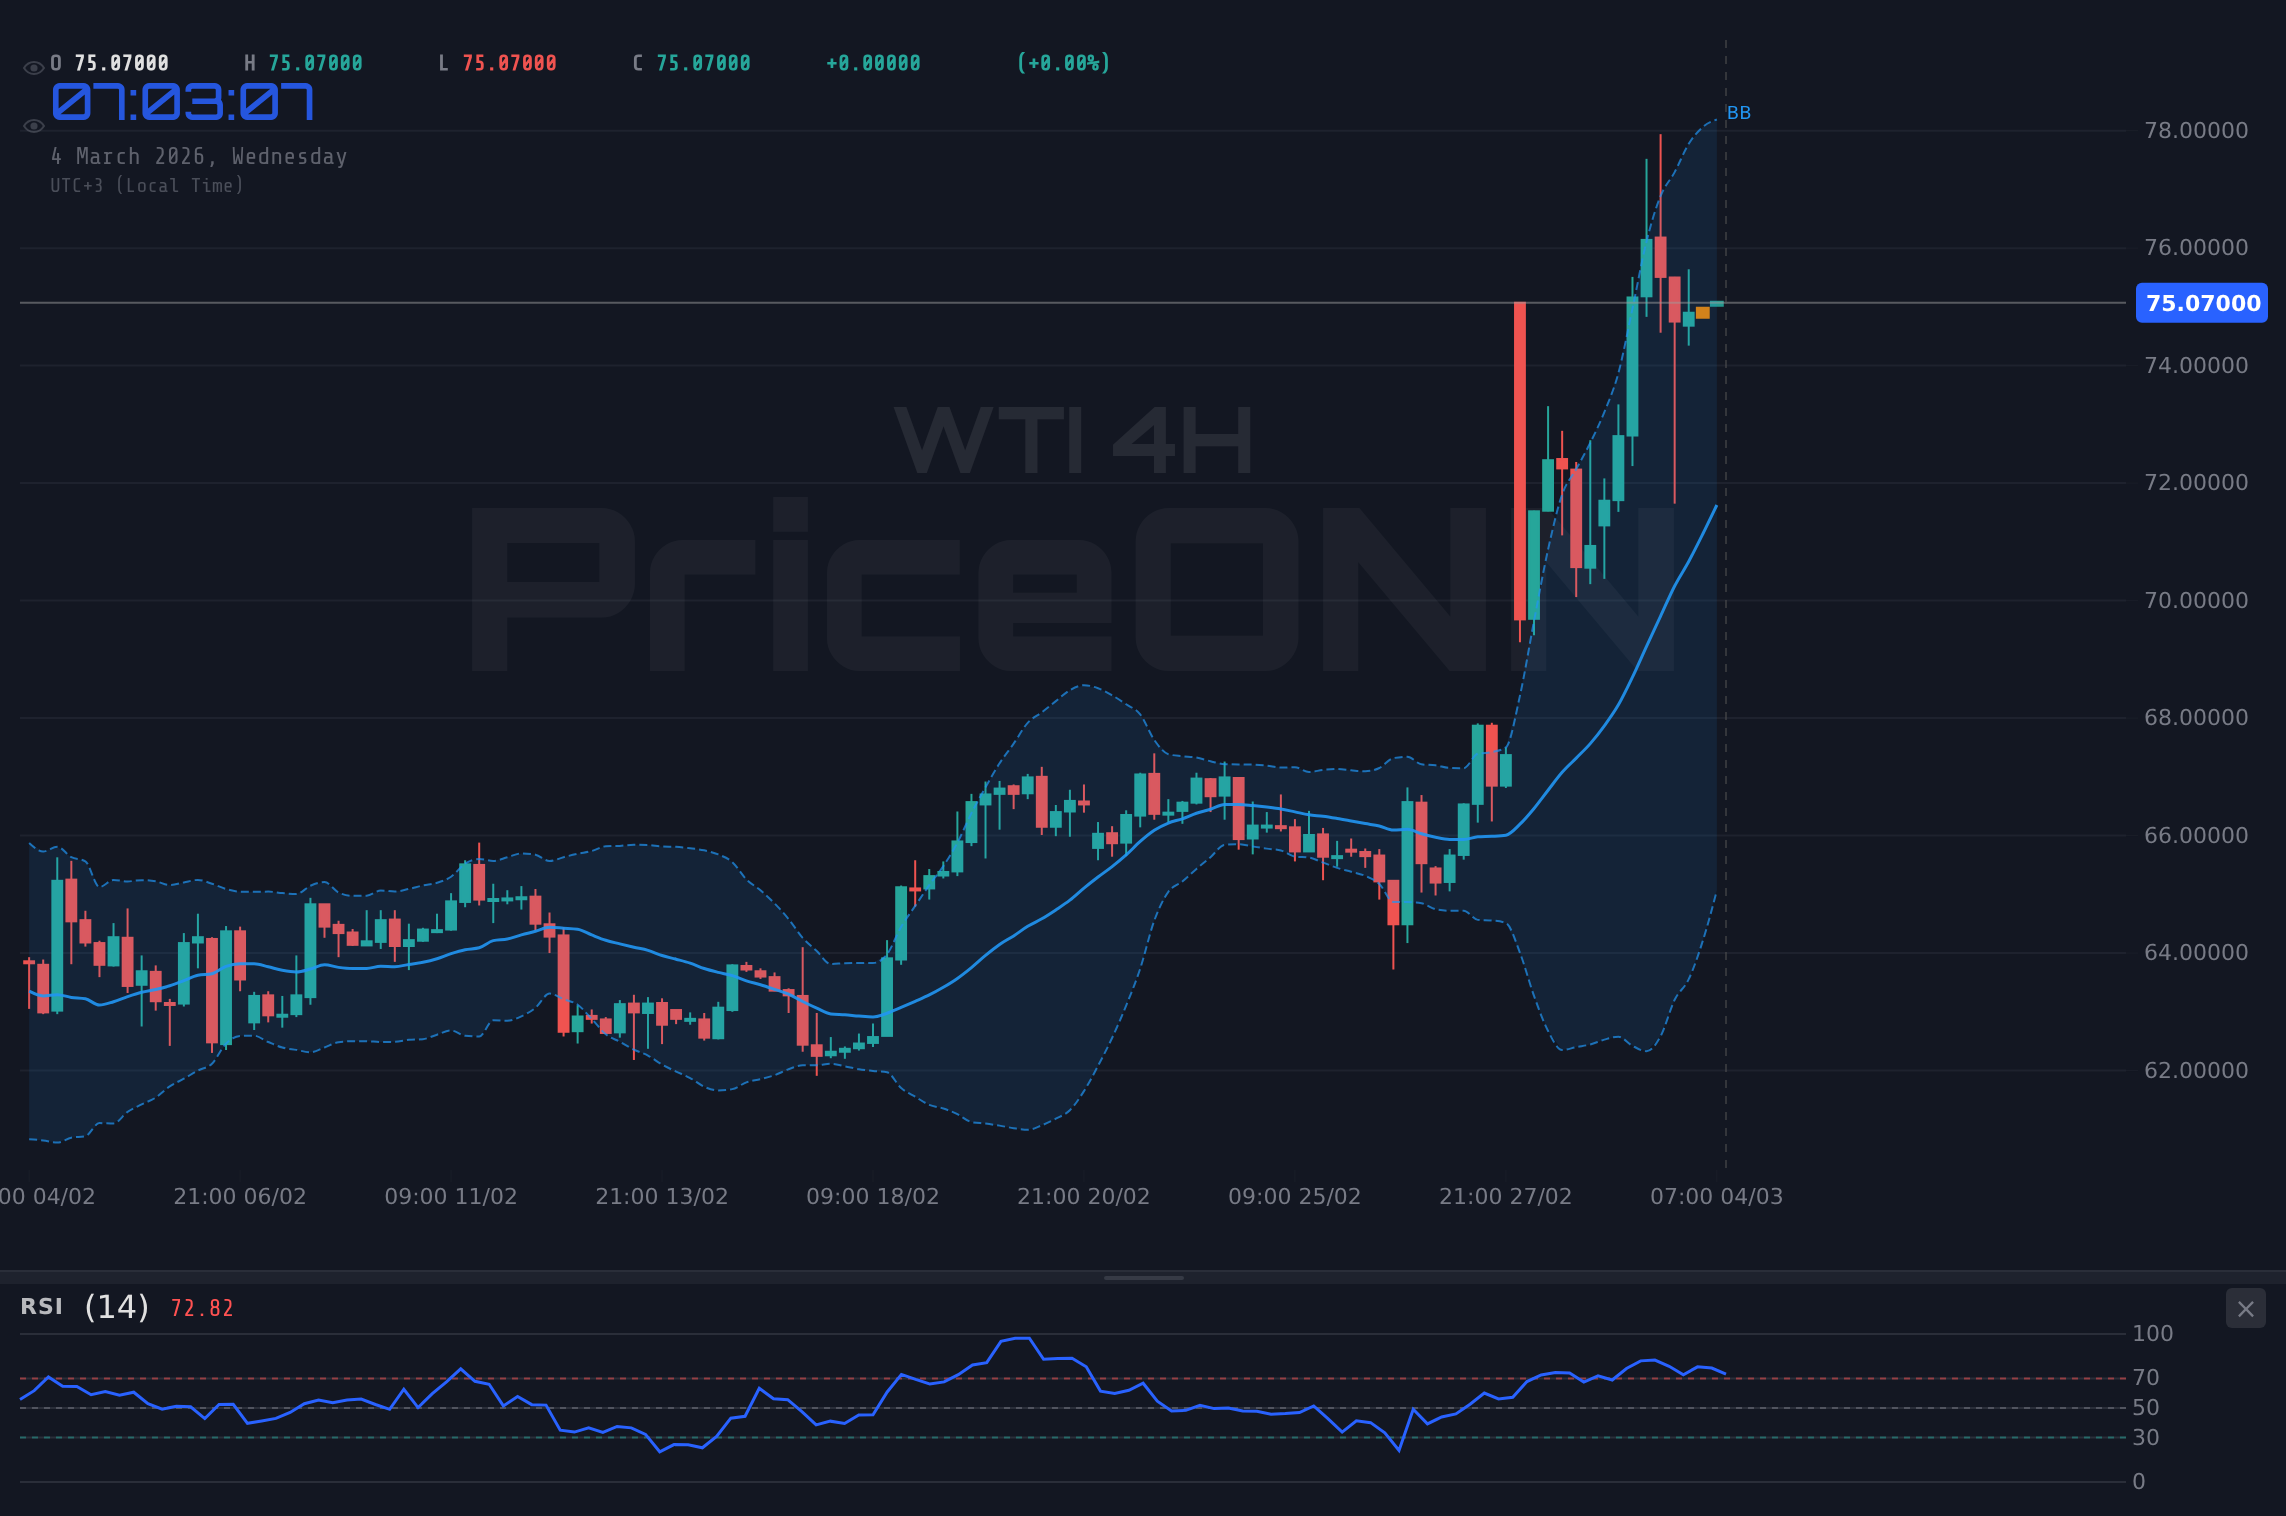
- The 4-hour chart shows a strong uptrend with RSI at 70.52, signaling potential overbought conditions and a possible pullback.
The tension in the WTI market is palpable. The recent surge above $75 has ignited bullish sentiment, fueled by supply concerns stemming from geopolitical instability. However, the market also faces headwinds from a potentially stronger dollar, as reflected in the rising DXY, currently at 98.77. This creates a tug-of-war between fundamental drivers and technical signals, leaving traders uncertain about the next move.
The Bull Case: Geopolitics and Supply Concerns
The primary driver behind the bullish thesis is the escalating geopolitical risks in the Middle East. The recent news of disruptions to Iraqi crude exports, potentially reaching 3 million barrels per day, through the Strait of Hormuz has sent shockwaves through the global energy markets. This supply constraint, coupled with ongoing tensions involving the US, Israel, and Iran, is creating a perfect storm for higher oil prices. As Reuters reported, “geopolitical risks fuel forex volatility,” and this is particularly true for crude oil.
Furthermore, Ecuador's oil sector is struggling with declining production and infrastructure issues. These supply-side challenges are adding upward pressure on prices. The rising Brent crude oil price underscores the global nature of these concerns. The bullish momentum is confirmed by the 1-day timeframe trend analysis, with a strength of 89%.
From a technical perspective, the 4-hour chart shows a strong uptrend. The RSI, although in overbought territory at 70.52, indicates sustained buying pressure. The MACD histogram remains positive, suggesting that the bullish momentum is still intact. According to the data provided, the ADX is at 46.9, signaling a strong uptrend.
The Bear Case: Dollar Strength and Demand Concerns
Despite the bullish factors, the bear case for WTI remains compelling. The strength of the U.S. dollar, as indicated by the rising DXY at 98.77, poses a significant threat to crude oil prices. A stronger dollar typically makes crude oil more expensive for international buyers, potentially dampening demand. The rising DXY is correlated with potentially lower WTI prices.
The SP500 is showing a bearish trend, currently at 6786.05. A declining stock market often signals a weakening economic outlook, which could translate into lower demand for crude oil. The upcoming U.S. economic data, including the ADP Nonfarm Employment Change and Services PMI, could further influence market sentiment. Should these figures disappoint, concerns about a potential economic slowdown could intensify, weighing on crude oil prices.
Technically, the 1-hour chart shows an RSI of 71.16, which is in the overbought region, indicating that the price may be due for a pullback. The Stochastic is also in overbought territory (K=90.49, D=81.87). These indicators suggest that the current rally may be unsustainable in the short term. The first resistance level is at $75.40, and a failure to break above this level could invite selling pressure.
Technicals as Tiebreaker: A Multi-Timeframe Analysis
To resolve the bull versus bear debate, a multi-timeframe analysis is crucial. On the 1-day timeframe, the trend is bullish with a strength of 89%, according to the data. However, the ADX is at 28.64, indicating a strong uptrend. The RSI is at 59.99, still in neutral territory, implying there is room for further upside.
On the 4-hour timeframe, the ADX is strong at 46.9, reinforcing the bullish trend. However, the Stochastic oscillator shows a potential overbought condition (K=64.89, D=73.28), warranting caution. The MACD histogram is positive, further supporting the bullish case.
On the 1-hour timeframe, the RSI is in the overbought region at 71.16, suggesting a possible pullback. The Stochastic oscillator also shows overbought conditions (K=90.49, D=81.87). However, the MACD remains positive, indicating continued bullish momentum. The immediate resistance is at $75.40, while support lies at $74.65. The support levels must hold in order for the bullish thesis to remain intact.
Overall, the technical picture is mixed, with bullish signals on the longer timeframes and bearish signals on the shorter timeframes. This suggests that WTI may experience some volatility in the near term, but the underlying trend remains upward. Patience looks like it will be rewarded here.
Trade Plan: Riding the Bullish Wave with Caution
Given the bullish bias and the relatively strong uptrend, a long trading strategy is justified. However, caution is warranted due to the potential for a pullback, as indicated by the overbought conditions on the shorter timeframes.
WTI breaks above $75.40 resistance, fueled by continued geopolitical tensions and a weaker dollar. The price targets are $76.29 (R1 on the 4H chart) and $77.83 (R2 on the 4H chart). This scenario has a 65% probability.
WTI fails to break above $75.40 and experiences a pullback due to profit-taking and a stronger dollar. The price targets are $74.65 (S1 on the 1H chart) and $74.32 (S2 on the 1H chart).
Given the upcoming U.S. ADP Nonfarm Employment Change data on Wednesday, traders should be prepared for potential volatility. A strong report could strengthen the dollar and weigh on oil prices, while a weak report could weaken the dollar and support oil prices. Manage your risk, wait for your setup- the market always gives a second chance.
Frequently Asked Questions: WTI Analysis
Is WTI a good buy right now?
With WTI at $75.26, a buy is justified if it breaks above the $75.40 resistance level. Look for a confirmation signal, such as a positive breakout on the 4-hour chart, before entering a long position.
What is the WTI price forecast for this week?
The WTI price forecast for this week is bullish, with potential targets at $76.29 and $77.83, contingent upon breaking above the immediate resistance at $75.40. The probability of reaching these targets is approximately 65%.
What are the key support and resistance levels for WTI?
Key support levels for WTI are $74.65, $74.32, and $73.90, while key resistance levels are $75.40, $75.82, and $76.15. These prices are based on 1H chart analysis.
Why is WTI moving today?
WTI is moving higher today due to escalating geopolitical tensions in the Middle East and concerns about supply disruptions. This has outweighed the negative impact of a stronger dollar.
Technical Outlook Summary
| Indicator | Value | Signal |
|---|---|---|
| RSI (14) | 59.99 | Neutral |
| MACD Histogram | Positive | Bullish |
| Stochastic | 54.52/58.52 | Bearish |
| ADX | 28.64 | Strong Trend |
| Bollinger | Upper Band | Watch |
Key Levels
Support Levels
Resistance Levels
Track markets in real-time
AI-powered analysis, technical indicators and real-time price data.
Join Our Telegram Channel
Breaking market news, AI analysis and trading signals instantly.
Join Channel