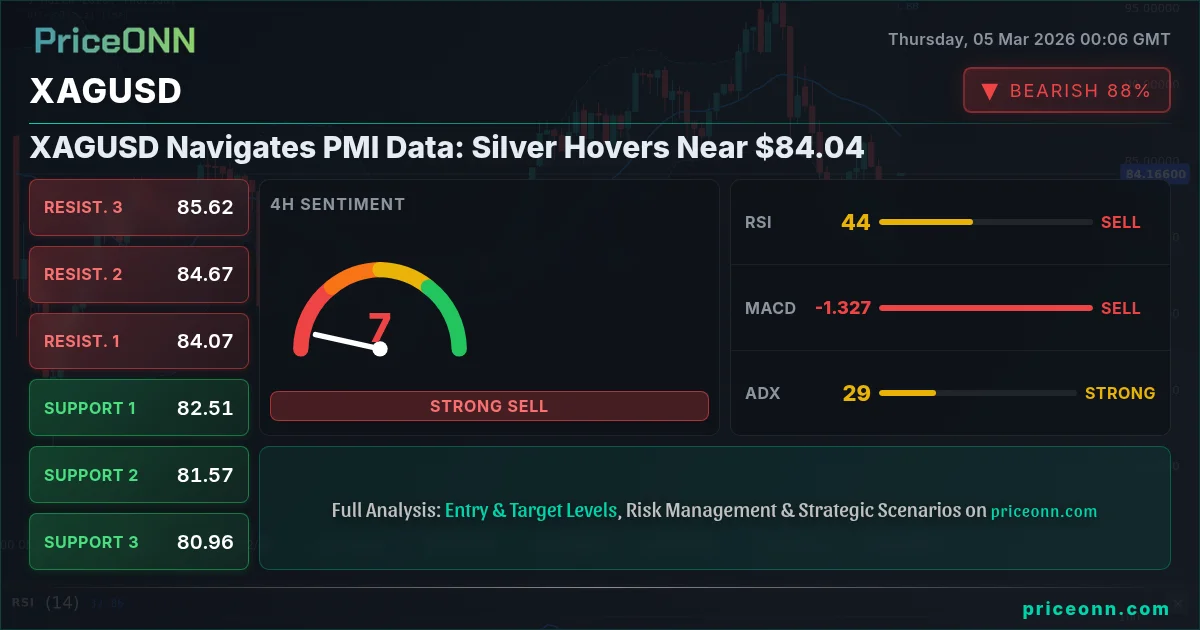
For traders tracking precious metals, the current landscape presents a complex interplay of technical and fundamental factors. Silver (XAGUSD) finds itself navigating these dynamics, currently priced near $84.04. The market's attention is keenly focused on incoming Purchasing Managers' Index (PMI) data, which could act as a key catalyst for future price movements.
- RSI at 48.14 on the 1H chart suggests neutral momentum, potentially preceding a directional shift.
- Immediate resistance for XAGUSD lies at $84.86 on the 4H chart; a break above could signal further upside.
- ADX at 31.72 on the 1H chart indicates a strong downtrend, however, Stochastic %K > %D hints at possible reversal.
- Rising Middle East tensions continue to inject safe-haven demand, supporting silver's underlying value despite economic data volatility.
A look at the hourly chart reveals a mixed picture for silver. The Relative Strength Index (RSI) sits at 48.14, hovering in neutral territory. This suggests neither strong buying nor selling pressure dominates, leaving the door open for a potential shift in momentum. On the Moving Average Convergence Divergence (MACD), negative momentum is evident as the MACD line resides below its signal line. However, the Stochastic oscillator presents a potentially bullish signal, with %K at 37.92 exceeding %D at 25.2. Traders often interpret this as a sign that the asset may be oversold and poised for a rebound. The Average Directional Index (ADX) reading of 31.72 indicates a strong downtrend. This conflicting data highlights the current uncertainty surrounding silver's short-term trajectory.
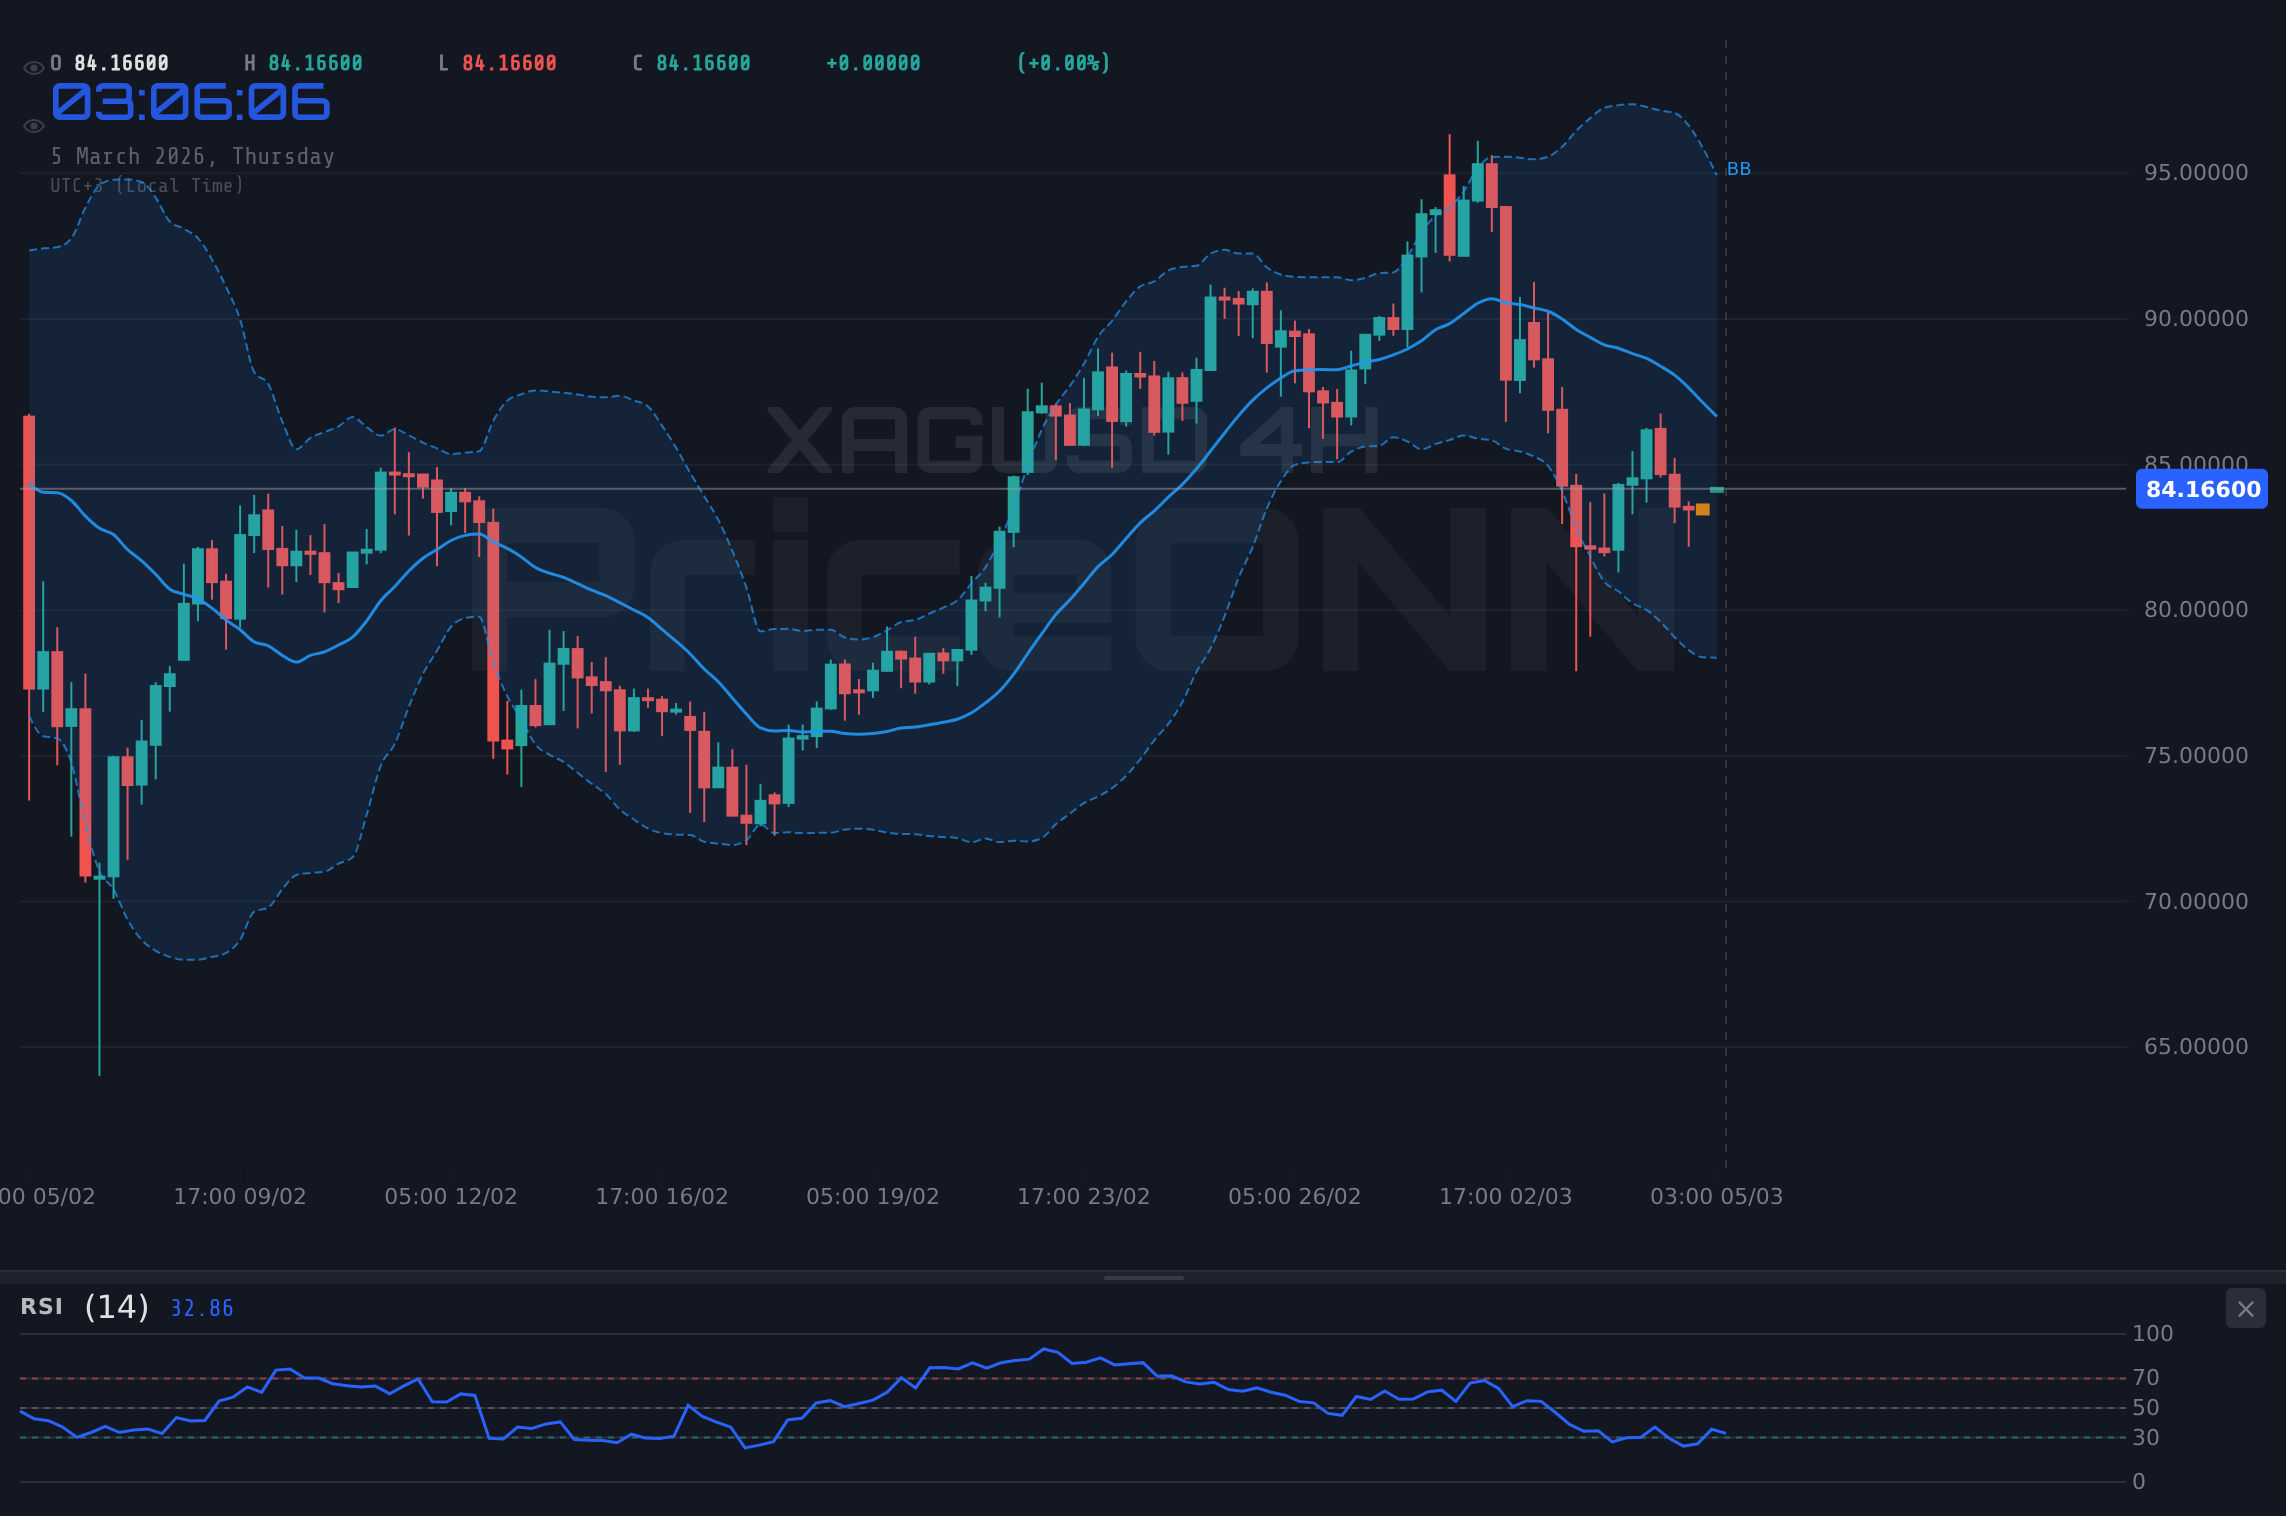
Stepping back to the 4-hour timeframe provides a broader perspective. The RSI, registering at 42.57, leans toward bearish territory, confirming the downtrend suggested by the hourly chart. Similar to the hourly chart, the MACD indicator displays negative momentum. However, the Stochastic oscillator again offers a glimmer of hope for the bulls, with %K at 60.7 exceeding %D at 48.53, suggesting a potential for upward correction. The 4H ADX reading of 29.62 further reinforces the presence of a strong downtrend.
Zooming out to the daily chart, the overall trend for XAGUSD appears neutral. The RSI at 49.32 confirms this. While the MACD histogram shows positive momentum, the Stochastic oscillator presents a bearish signal, with %K at 44.57 falling below %D at 77.34. This divergence warrants caution, suggesting the potential for a short-term pullback despite the longer-term bullish outlook. The daily ADX is at 20.48, indicating a moderate downtrend.
From a level perspective, XAGUSD faces immediate resistance at 83.64 on the hourly chart, followed by 83.82 and 84.11. On the 4-hour chart, resistance strengthens at 84.86, 86.16 and 87.09. A successful breach of these levels could pave the way for further gains. Conversely, immediate support can be found at 83.17, 82.89 and 82.71 on the hourly chart. The 4H chart has support at 82.62, 81.68 and 80.38. A break below these support zones could accelerate the decline.
The dollar index (DXY) is currently at 98.52. The dollar index generally has an inverse relationship with silver. A rising DXY often puts downward pressure on silver prices, while a falling DXY tends to support silver. Traders should keep a close eye on the DXY's movements to gauge potential headwinds or tailwinds for XAGUSD. The SP500 is currently at 6875.7 and is generally seen as a risk appetite indicator. A falling SP500 could lead to increased safe-haven demand, potentially benefiting silver.
Geopolitical risks continue to play a significant role in shaping market sentiment. As reported on March 4th, escalating tensions in the Middle East are driving investors towards safe-haven assets, including gold and silver. This geopolitical backdrop provides underlying support for XAGUSD, even as economic data introduces volatility. According to Reuters, the Federal Reserve is closely monitoring inflation data. The upcoming PMI data takes on added importance, as it could influence the Fed's policy decisions and, consequently, impact the dollar's trajectory and silver's relative attractiveness.
The recent surge in energy prices, driven by Middle East conflict and supply chain concerns, is also contributing to inflationary pressures. As reported on March 4th, oil prices are surging amid Middle East conflict. This inflationary environment further bolsters silver's appeal as a hedge against currency devaluation. The industrial demand for silver should also be considered. Silver is used in many industrial applications, including electronics, solar panels and medical devices. The percentage of industrial demand for silver versus gold is something traders are watching. The relative strength of the global economy, particularly manufacturing activity, directly impacts silver demand and price.
Looking ahead, the silver price forecast 2026 hinges on a number of factors. Traders should closely monitor economic data releases, particularly PMI figures, as well as developments in the Middle East. The interplay between these fundamental drivers and technical indicators will likely dictate XAGUSD's trajectory in the near term. The NZD/USD pair has seen a significant surge, driven by a weaker US Dollar. This dollar weakness could also help to support silver's price.
The economic calendar is relatively light today, March 5th. However, several high-impact events are scheduled for the coming week. On Monday, March 2nd, the ISM Manufacturing PMI data was released. The ISM Services PMI was released on Wednesday, March 4th. Traders will be scrutinizing these numbers for clues about the health of the US economy and potential shifts in Fed policy. Any significant deviation from expectations could trigger sharp movements in XAGUSD.
The current silver price XAG/USD March 2 2026 is a key point for traders to monitor. The silver price volatile run continues. The silver news today will be focused on the impact of PMI data. The current silver price XAG USD March 2 2026 is a key level that traders are watching. The current silver price XAG/USD live March 2 2026 is being closely monitored by traders. The current silver price XAGUSD live March 2 2026 is a key level that traders are watching.
Frequently Asked Questions: XAGUSD Analysis
Is XAGUSD a good buy right now?
Given the current price of $84.04, XAGUSD presents a mixed picture. The Stochastic oscillator suggests potential oversold conditions, but the overall trend remains neutral. A decisive break above the $84.86 resistance on the 4H chart would signal a more bullish outlook.
What is the XAGUSD price forecast for this week?
The XAGUSD price forecast for this week hinges on the reaction to PMI data. A positive surprise could push the price towards the $86.16 resistance, while disappointing data could see it test the $82.62 support. The probability of a significant breakout in either direction is currently moderate.
What are the key support and resistance levels for XAGUSD?
Key support levels for XAGUSD are $83.17, $82.89 and $82.71 on the 1H chart and $82.62, $81.68 and $80.38 on the 4H chart. Resistance levels are $83.64, $83.82 and $84.11 on the 1H chart, and $84.86, $86.16 and $87.09 on the 4H chart.
Why is XAGUSD moving today?
XAGUSD is moving today due to a combination of factors, including reactions to economic data and geopolitical tensions. The strong industrial demand for silver is also playing a role. The current price is $84.04.
Technical Outlook Summary
| Indicator | Value | Signal |
|---|---|---|
| RSI (14) | 49.32 | Neutral |
| MACD Histogram | Positive | Bullish |
| Stochastic | 44.57/77.34 | Bearish |
| ADX | 20.48 | Weak Trend |
| Bollinger | Middle Band | Watch |
Key Levels
Support Levels
Resistance Levels
Track markets in real-time
AI-powered analysis, technical indicators and real-time price data.
Join Our Telegram Channel
Breaking market news, AI analysis and trading signals instantly.
Join Channel