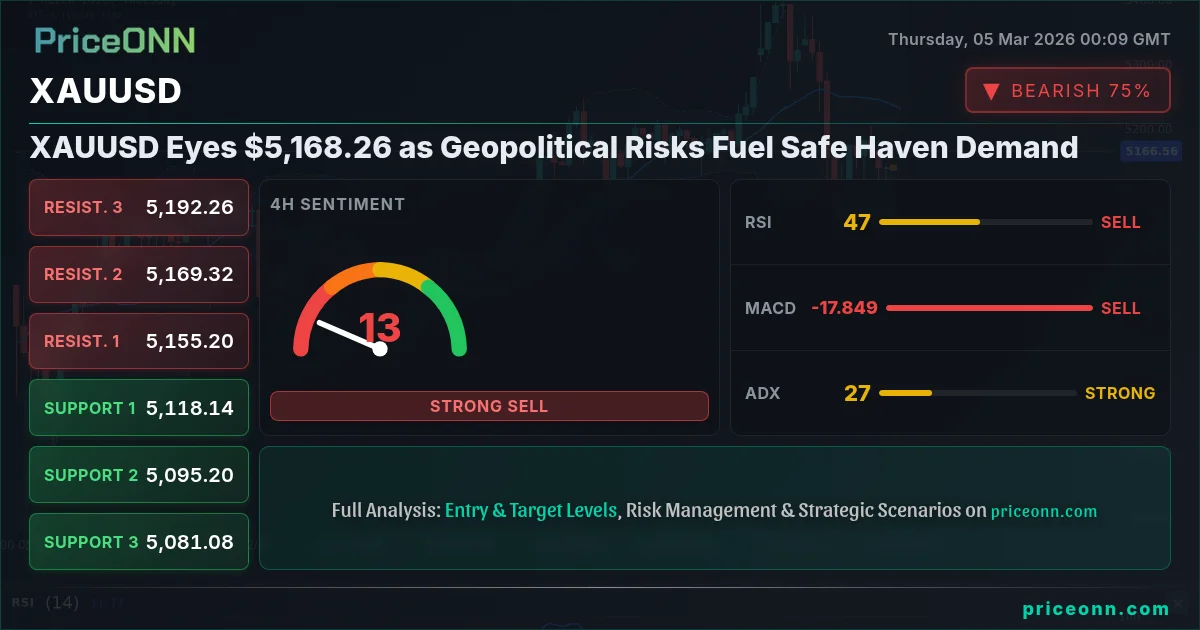
Gold (XAUUSD) is attracting significant safe-haven demand as geopolitical tensions in the Middle East escalate. With the current price hovering around $5,168.26, investors are closely monitoring key support and resistance levels to navigate the volatile market conditions.
- RSI stands at 55.31 on the daily timeframe, suggesting a potential for further upward momentum.
- Critical support lies at $5,132.41 on the 1H chart, which needs to hold to sustain the bullish outlook.
- MACD histogram shows positive momentum on the 1H chart, indicating potential for continued gains.
- Geopolitical tensions and safe-haven demand are key drivers for the current XAUUSD rally.
The recent surge in gold prices is primarily attributed to heightened geopolitical risks, particularly in the Middle East. According to a recent Reuters report, the escalating tensions have triggered a flight to safety, benefiting traditional safe-haven assets like gold. This context is extremely relevant to the current analysis.
From a technical perspective, the 1-hour chart shows a downtrend with 87% strength. However, the RSI at 51.36 is neutral and trending upward. This divergence suggests a potential shift in momentum. Key resistance on the 1H chart is at $5,146.8. A break above this level could signal further upside. On the other hand, the 4H chart shows a neutral trend, but the RSI at 46.12 leans bearish. ADX on the 4H chart is at 27.41, indicating a strong downtrend.
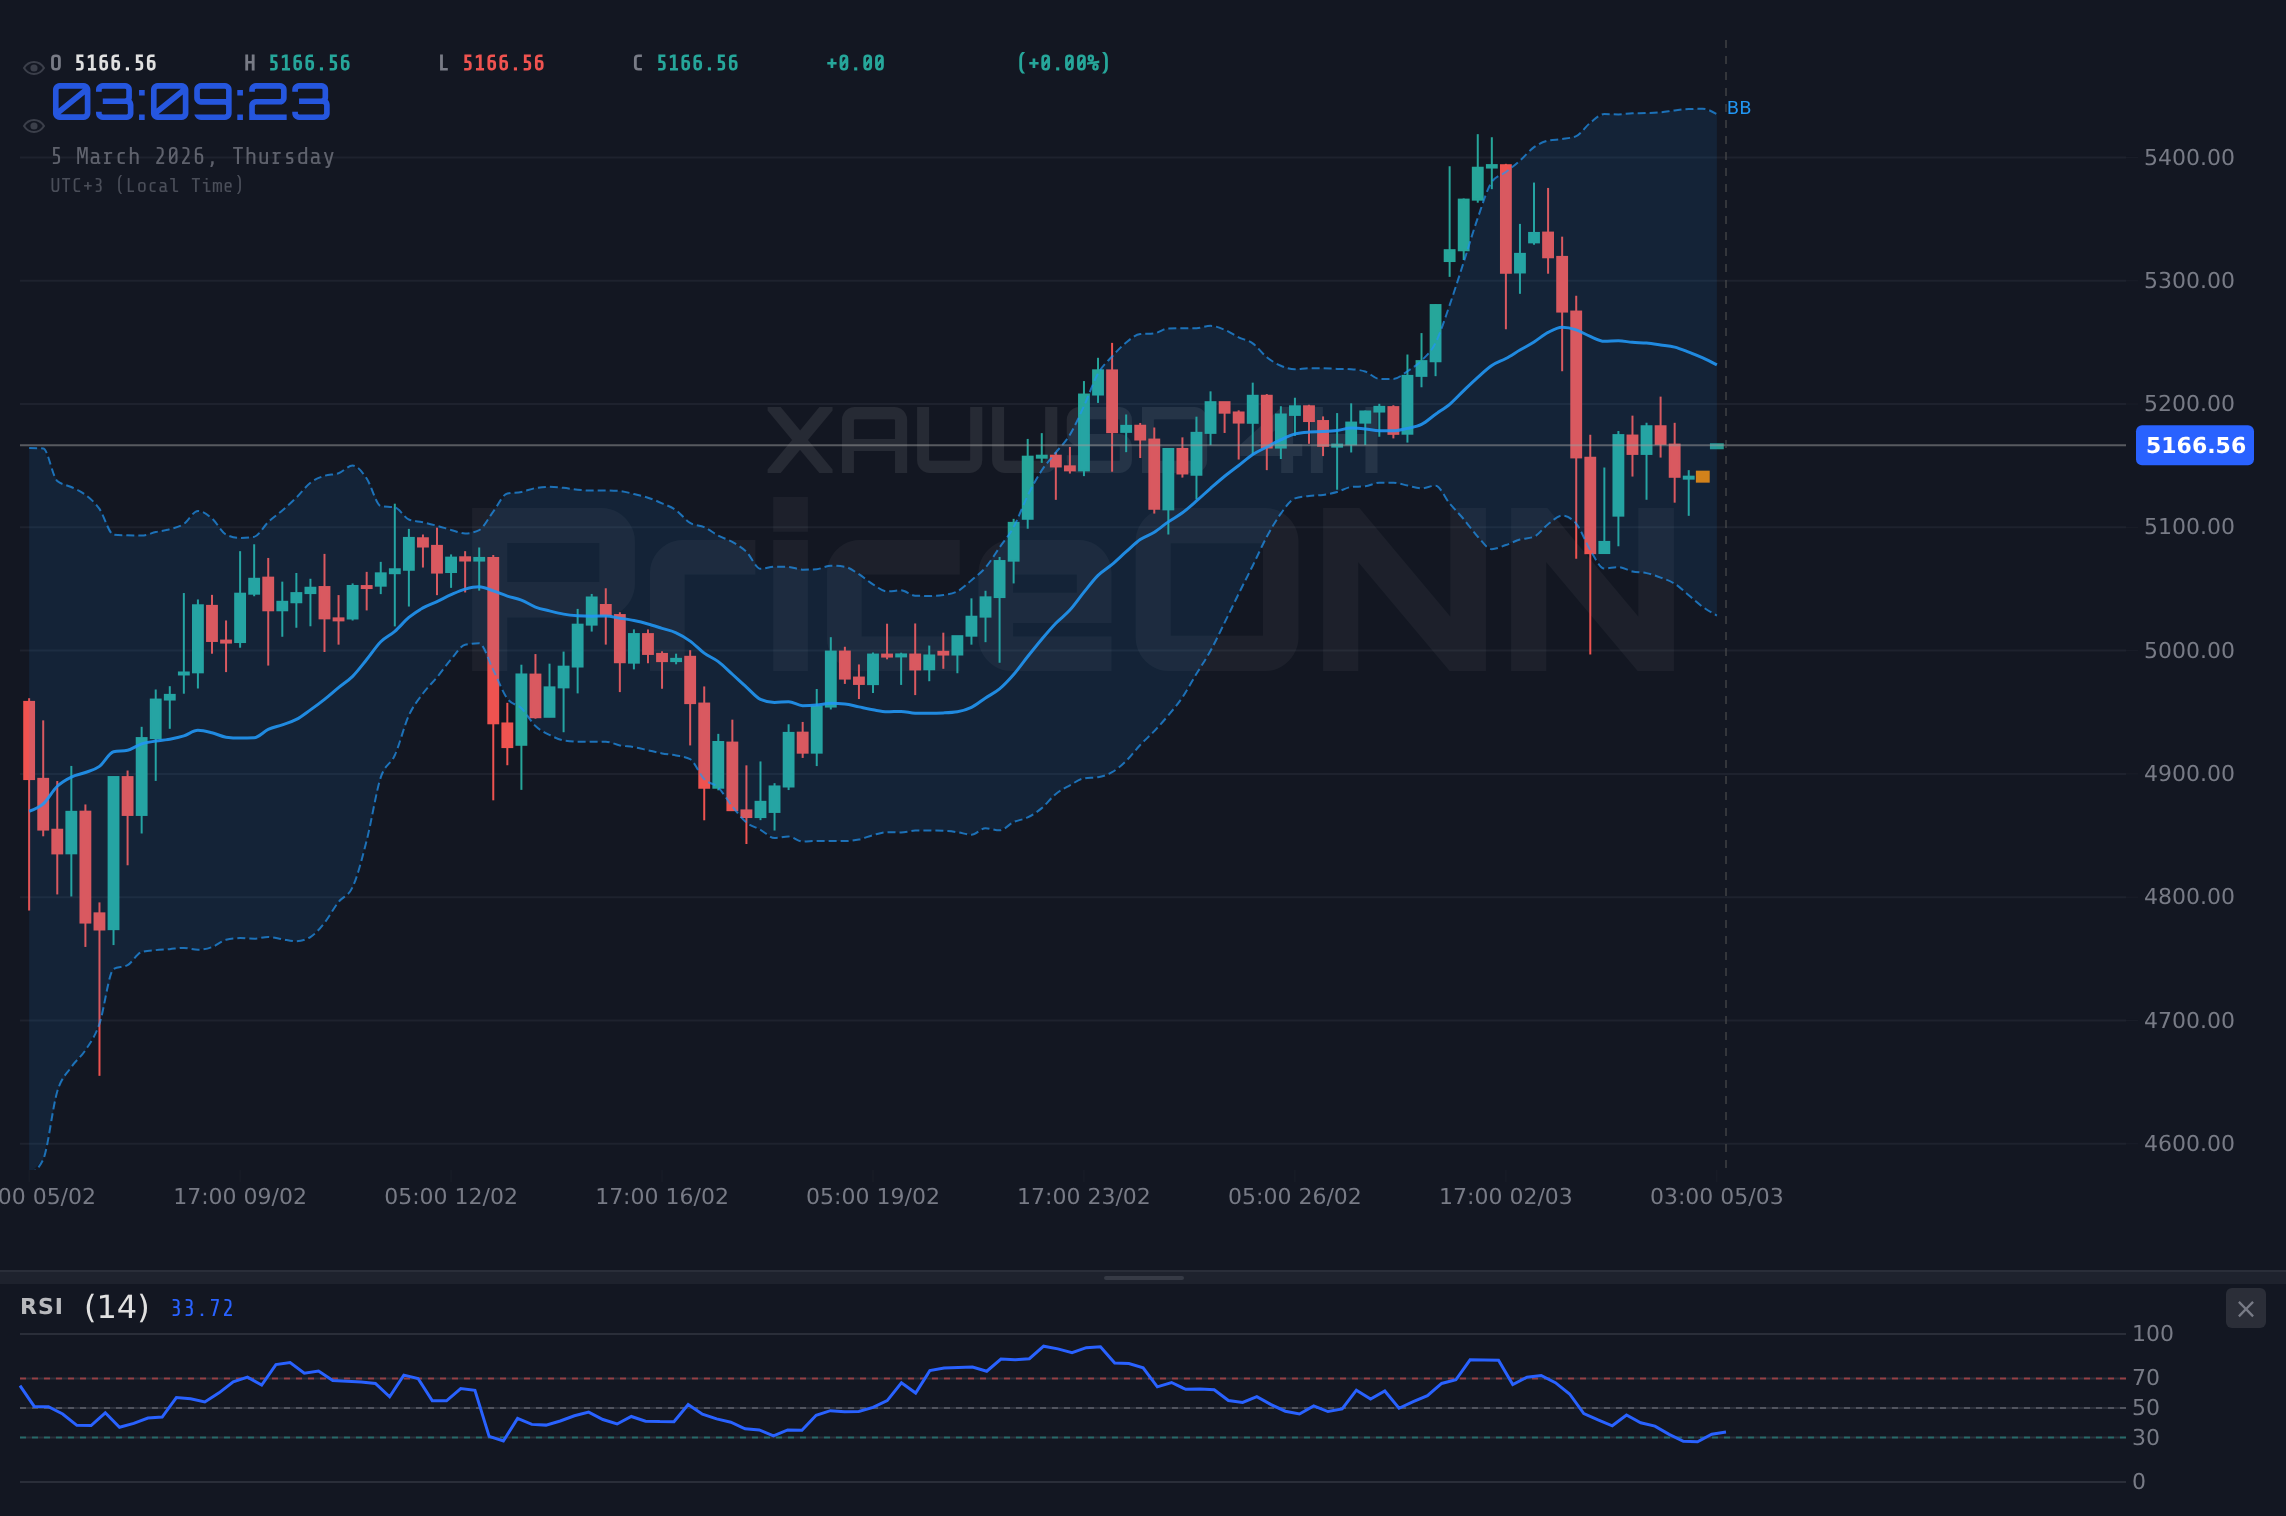
The current environment is characterized by conflicting signals across different timeframes, typical of a market in transition. The daily chart indicates an uptrend with 83% strength. Support on the daily timeframe is at $4,930.13. Resistance is at $5,312.93. The Stochastic indicator on the daily chart shows a bearish signal with K=51.1 and D=76.73, suggesting a potential pullback before further gains.
With the DXY (Dollar Index) currently at 98.52, any further strengthening of the dollar could put pressure on gold. Traders should also monitor the SP500, which is currently at 6879.75. A decline in the SP500 could further fuel safe-haven demand for gold. The energy market is also a factor to consider. Brent crude is trading at $65.73, indicating rising inflationary pressures that could support gold prices.
The upcoming economic data releases will be crucial in determining the near-term direction of XAUUSD. Investors are awaiting new data which could significantly impact market sentiment. The data releases could significantly influence the Fed's policy decisions, impacting the dollar and, consequently, gold prices.
Industrial demand also plays a role in gold's price dynamics, although to a lesser extent than silver. However, it is not as influential as safe-haven demand or monetary policy. Silver's higher industrial demand makes it more sensitive to economic growth and industrial cycles.
The $5,132.41 level is the line in the sand. If price holds above this level on the 1H chart, the bullish outlook remains intact. However, a break below this level could signal a deeper pullback towards the $5,112.39 support on the 4H chart.
The positive MACD histogram on the 1H chart supports the bullish scenario. However, the negative MACD on the 4H chart suggests caution. The ADX on the 1H chart is 33.41, signaling a strong downtrend, while on the 4H chart it is 27.41, also indicating a strong downtrend. This conflicting signal requires careful risk management.
Given the current technical and fundamental backdrop, traders should consider the following scenarios:
Price breaks above $5,146.8 on the 1H chart, confirming bullish momentum. Target $5,177.17 on the 4H chart, followed by $5,213.36 if momentum sustains. Probability: 60%.
Price breaks below $5,132.41 on the 1H chart, signaling a potential pullback. Target $5,112.39 on the 4H chart, followed by $5,083.8 if the downtrend strengthens. Probability: 40%.
The overall trend for XAUUSD remains bullish on the daily timeframe, supported by geopolitical tensions and potential safe-haven demand. However, traders should be aware of conflicting signals on shorter timeframes and manage their risk accordingly. It is important to note that the price has been volatile, and the market could change direction quickly.
The ADX reading of 16.9 on the daily chart suggests a weak trend, indicating a potential for sideways movement. However, if the geopolitical situation worsens, we could see a significant breakout to the upside. The Stochastic oscillator on the daily timeframe, with K=51.1 and D=76.73, suggests that the market may be overbought and due for a correction.
The current gram altın fiyatı in Turkey will likely reflect these global price movements. As the global spot price of gold increases, the local price in Turkish Lira will also rise, influenced by the USD/TRY exchange rate. Traders in Turkey should monitor both the global gold price and the local exchange rate for accurate pricing.
The Middle East tensions are driving oil prices higher, potentially benefiting U.S. chemical manufacturers. This dynamic could indirectly impact gold prices as higher energy costs contribute to inflationary pressures, further supporting gold as an inflation hedge. According to a recent energy market report, the escalation of geopolitical risks has led to a surge in LNG and aluminum prices, impacting global energy and industrial sectors.
While the technical picture remains mixed, attractive levels are forming for long-term investors. Patient investors always find opportunities-the key is waiting for the right moment. Manage your risk, wait for your setup-the market always gives a second chance.
Frequently Asked Questions: XAUUSD Analysis
Is XAUUSD a good buy right now?
XAUUSD is showing bullish signals but with mixed timeframe trends. A buy is viable if it holds above $5,132.41, targeting $5,177.17. Otherwise, consider a pullback to $5,112.39.
What is the XAUUSD price forecast for this week?
The XAUUSD price forecast for this week is bullish if it breaks above $5,146.8. Expect a potential target of $5,177.17 with a 60% probability. A break below $5,132.41 could lead to a bearish target of $5,112.39.
What are the key support and resistance levels for XAUUSD?
Key support levels for XAUUSD are $5,132.41 and $5,112.39. Key resistance levels are $5,146.8 and $5,177.17, all derived from the current market data.
Why is XAUUSD moving today?
XAUUSD is moving today due to escalating geopolitical tensions in the Middle East, driving safe-haven demand. The DXY's strength and movements in the SP500 are also influencing factors.
Technical Outlook Summary
| Indicator | Value | Signal |
|---|---|---|
| RSI (14) | 55.31 | Neutral |
| MACD Histogram | Positive | Bullish |
| Stochastic | K=51.1, D=76.73 | Bearish |
| ADX | 33.41 | Strong Trend |
| Bollinger | Upper Band | Watch |
Key Levels
Support Levels
Resistance Levels
Track markets in real-time
AI-powered analysis, technical indicators and real-time price data.
Join Our Telegram Channel
Breaking market news, AI analysis and trading signals instantly.
Join Channel