Gold is walking a tightrope around $5,082.31, caught between the safe-haven allure of geopolitical tensions and the looming specter of a hawkish Federal Reserve. The question now is: Which force will ultimately prevail?
- Gold price currently at $5,082.31, facing downward pressure from a rising DXY.
- Key support level at $5,073.64 needs to hold to prevent further declines.
- ADX at 41.4 on the 1H chart indicates a strong downtrend.
- Geopolitical tensions in the Middle East provide some support, but Fed policy remains the dominant driver.
The recent dip in XAUUSD, with the current price at $5,082.31, highlights the complex interplay of factors influencing the precious metal. The ongoing tensions in the Middle East, referenced in recent news reports about potential supply disruptions, should be a bullish signal for gold, traditionally seen as a safe haven. However, the strength of the US dollar, as indicated by the DXY's rise to 98.77, is exerting considerable downward pressure. This inverse correlation is a key dynamic to watch in the coming days.
Why $5,073.64 is the Line in the Sand
From a technical perspective, the immediate support level of $5,073.64 is critical. A sustained break below this level, as indicated by the 1H chart, could open the door for a further decline towards $5,066.44 and potentially even $5,060.88. The ADX on the 1H timeframe is currently at 41.4, signaling a strong downtrend. This suggests that the bears are in control in the short term. However, the Stochastic indicator on the same timeframe shows a potential bullish signal with K=29.04 and D=18.29, suggesting a possible short-term rebound. The RSI at 35.66 is in neutral territory, not yet oversold, leaving room for further downside.
Hawkish Fed Signals Dampen Bullish Sentiment
The elephant in the room is the Federal Reserve's monetary policy. Recent statements from Fed officials, as reported by Reuters, have hinted at a more hawkish stance to combat inflation. This has led to increased expectations of further interest rate hikes, which strengthens the dollar and makes gold less attractive as an investment. The market is keenly awaiting further clues from upcoming economic data, particularly the US PPI data, to be released later today, and any further indications from Fed officials.
The Geopolitical Wildcard
While the Fed's actions are a major headwind, geopolitical tensions remain a significant factor. The situation in the Middle East is particularly concerning, with escalating tensions potentially disrupting oil supplies and triggering a flight to safety. As reported by various news outlets, including those covering Japan's refiners requesting strategic oil releases, the situation is volatile and could change rapidly. This uncertainty provides some support for gold, but it is not enough to overcome the strength of the dollar.
XAG/USD Faces Pressure Despite Industrial Demand
It's important to note that silver (XAG/USD) is also experiencing downward pressure, currently trading at $82.82. This is despite the fact that silver has significant industrial demand. The diverging trends in gold and silver could indicate that the current weakness in precious metals is primarily driven by macroeconomic factors rather than concerns about industrial demand. The search interest in "industrial demand silver vs gold percentage" indicates that investors are aware of this dynamic and are trying to understand the relative importance of industrial demand for the two metals.
USD Gains Momentum, Pressuring Precious Metals
The broader forex market is also reflecting the strength of the US dollar. As noted in recent forex analyses, the USD is gaining momentum against various currencies, putting pressure on precious metals. This is further confirmed by the rise of the DXY to 98.77. The key question for gold traders is whether this dollar strength is sustainable. If the Fed continues to signal a hawkish stance, the dollar could continue to appreciate, putting further pressure on gold.
Multi-Timeframe Analysis: Conflicting Signals
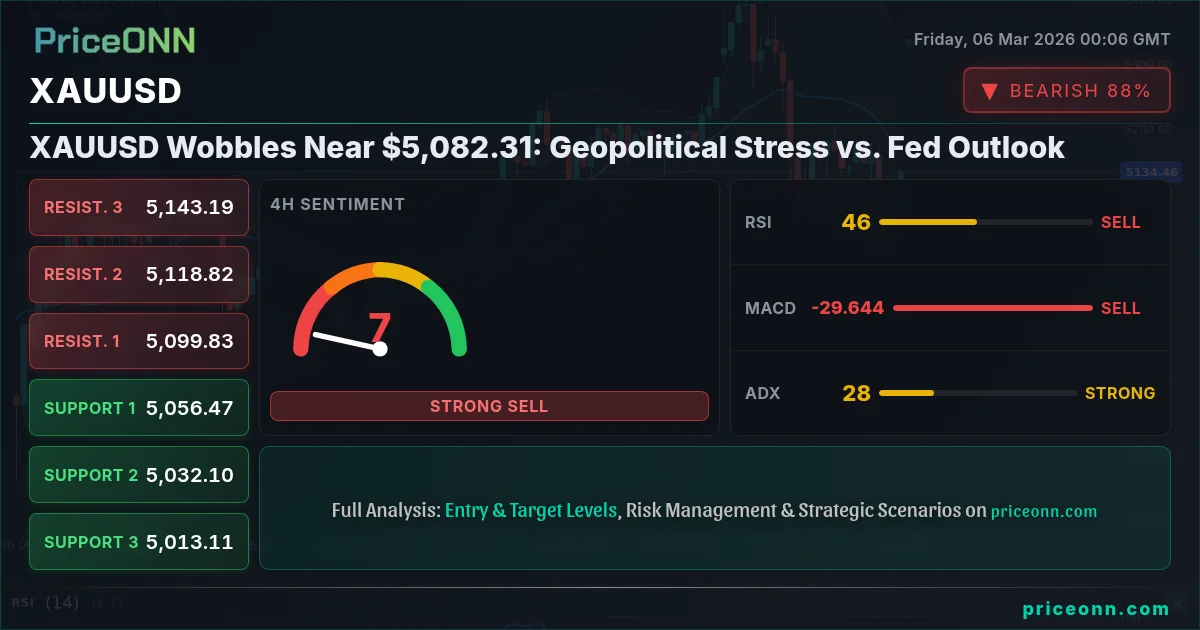
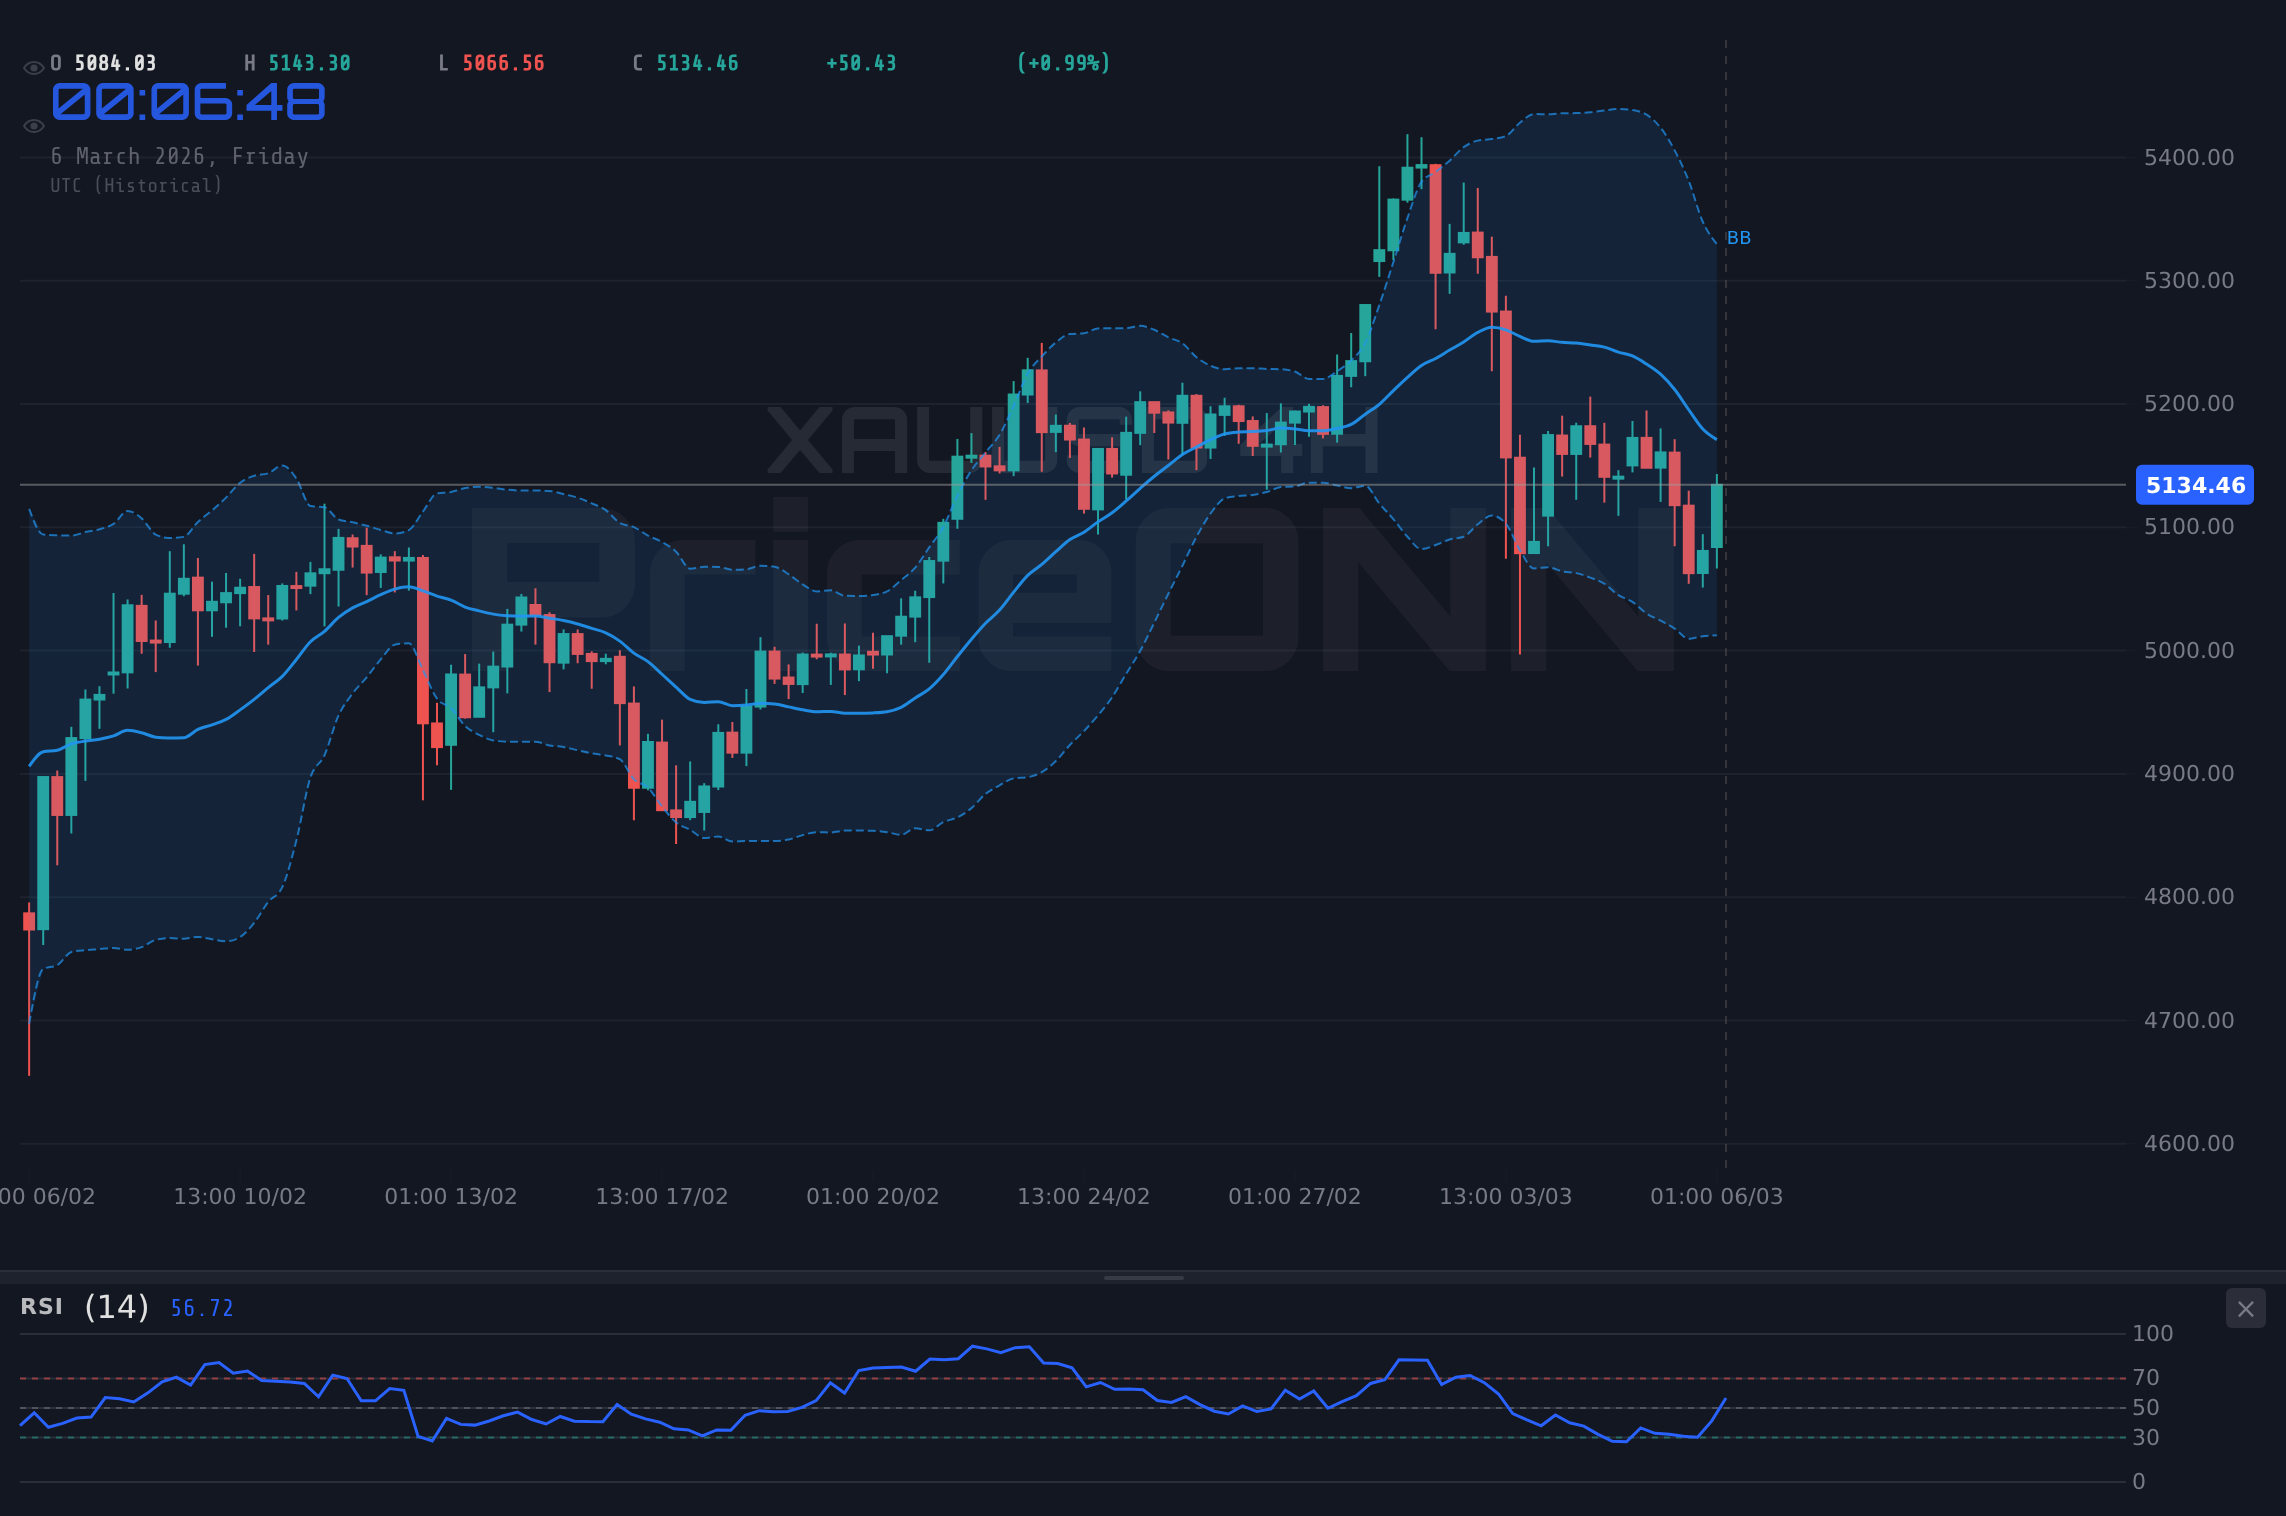
A multi-timeframe analysis reveals conflicting signals. On the 1D timeframe, gold is still in an uptrend, with the RSI at 51.95 and the price above the 50-day moving average. However, the MACD histogram is negative, and the Stochastic indicator is showing a bearish signal. This suggests that the uptrend is losing momentum and that a correction is possible. On the 4H timeframe, the trend is down, with the ADX at 28.22, indicating a strong downtrend. The Stochastic indicator is also showing a bearish signal. This suggests that the short-term outlook for gold is bearish.
Gold Trading Strategy 2026: Patience is Key
The current market conditions call for a cautious approach to gold trading. The conflicting signals from different timeframes and indicators suggest that the market is uncertain and that a clear trend has not yet emerged. A successful gold trading strategy 2026 requires patience and a willingness to wait for the right setup. Traders should focus on managing their risk and avoiding over-leveraging their positions.
Risk Management and Key Levels to Watch
Given the current volatility, risk management is paramount. Traders should use stop-loss orders to limit their potential losses and avoid trading with excessive leverage. Key levels to watch include the support level at $5,073.64 and the resistance level at $5,086.4. A break below the support level could trigger a further decline, while a break above the resistance level could signal a potential rebound. The overall trend strength will be determined by the interplay between geopolitical tensions and the Fed's monetary policy.
Frequently Asked Questions: XAUUSD Analysis
Is XAUUSD a good buy right now?
Given the current price of $5,082.31 and the strong downtrend indicated by the ADX, XAUUSD may not be a good buy right now. Traders should wait for a clear bullish signal, such as a break above the resistance level at $5,086.4, before considering a long position.
What is the XAUUSD price forecast for this week?
The XAUUSD price forecast for this week is highly uncertain. If the support level at $5,073.64 holds, the price could rebound towards $5,086.4. However, a break below this level could trigger a further decline towards $5,066.44. The probability of either scenario depends on the outcome of upcoming economic data releases and any further developments in geopolitical tensions.
What are the key support and resistance levels for XAUUSD?
The key support levels for XAUUSD are $5,073.64, $5,066.44, and $5,060.88. The key resistance levels are $5,086.4, $5,091.96, and $5,099.16. These levels are based on the 1H timeframe and could change as the market evolves.
Why is XAUUSD moving today?
XAUUSD is moving today due to a combination of factors, including a stronger US dollar, as indicated by the rise of the DXY, and expectations of further interest rate hikes by the Federal Reserve. Geopolitical tensions are providing some support, but they are not enough to offset the negative impact of these macroeconomic factors.
Track markets in real-time
AI-powered analysis, technical indicators and real-time price data.
Join Our Telegram Channel
Breaking market news, AI analysis and trading signals instantly.
Join Channel