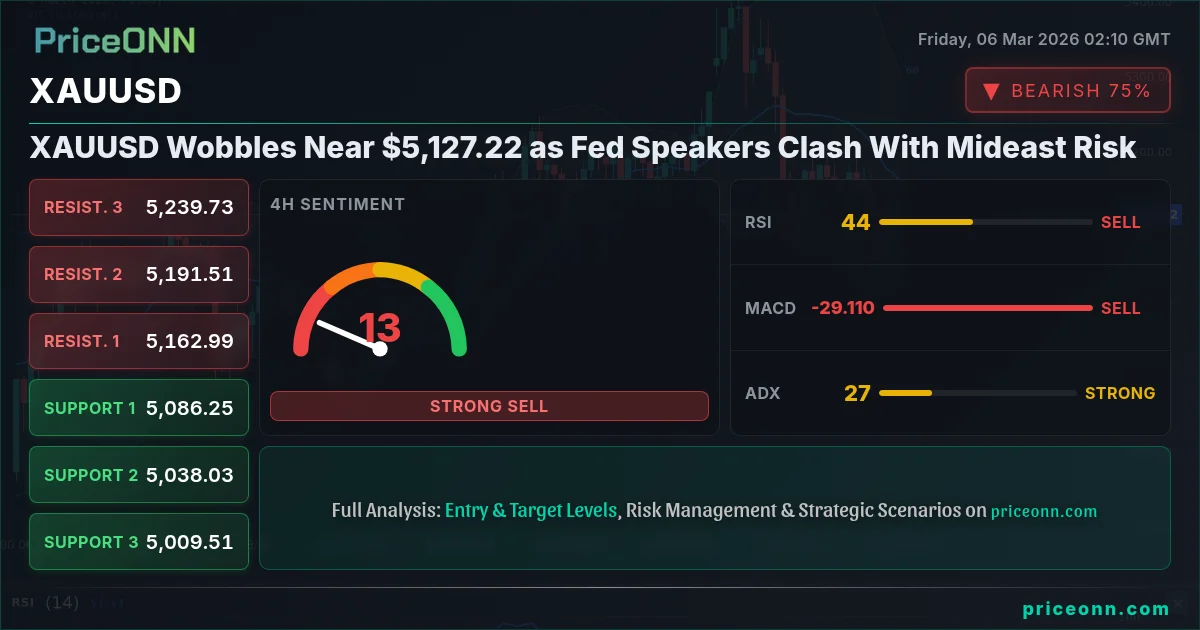
XAUUSD is currently wobbling near $5,127.22, finding itself caught in a tug-of-war between conflicting forces. On one side, hawkish comments from Federal Reserve speakers are bolstering the dollar and weighing on gold. On the other, escalating geopolitical tensions in the Middle East, particularly concerning disruptions in the Strait of Hormuz, are fueling safe-haven demand. Which force will ultimately prevail?
- XAUUSD trades near $5,127.22, battling Fed rhetoric and geopolitical risk.
- Immediate support lies at $5,075.03; a break below could trigger further downside.
- RSI at 52.34 on the 1H chart suggests neutral momentum but watch for a shift.
- DXY strength correlates negatively with XAUUSD, with the dollar index currently at 98.7.
The Bull Case: Geopolitical Safe Haven
The primary argument for a bullish outlook on gold centers on its traditional role as a safe-haven asset. The recent surge in WTI crude oil prices, now trading near $79.6, driven by escalating Middle East tensions and a recent oil tanker incident, underscores the fragility of the global energy supply. As reported by several news outlets, the Strait of Hormuz, a critical chokepoint for oil tankers, is facing increased disruption threats. This instability tends to drive investors toward safe-haven assets like gold. Furthermore, Japan's oil refiners are requesting strategic oil releases, according to recent energy sector reporting. This further underlines the market's anxiety, boosting gold's appeal.
From a technical perspective, the 1-hour chart offers some support for the bullish case. The Stochastic indicator shows K=58.63 and D=29.42, indicating a potential buy signal. The MACD also shows positive momentum, further fueling the bullish sentiment. However, the ADX at 38.42 on the 1H timeframe suggests a strong downtrend, so any bullish move needs to be carefully monitored for confirmation.
The Bear Case: Hawkish Fed and Dollar Strength
Conversely, the bear case for gold rests on the strength of the US dollar and the potential for continued hawkishness from the Federal Reserve. The DXY (Dollar Index) is currently trading at 98.7, up 0.19% on the day. A stronger dollar typically exerts downward pressure on gold prices, as gold is priced in dollars. Recent comments from Fed officials have suggested a willingness to maintain a tighter monetary policy to combat inflation, which could further bolster the dollar. The market is closely watching upcoming economic data, particularly the US employment figures scheduled for release today (Friday), as any signs of continued strength in the labor market could reinforce the Fed's hawkish stance. The EURUSD, currently at 1.16154, is also under pressure, further contributing to dollar strength.
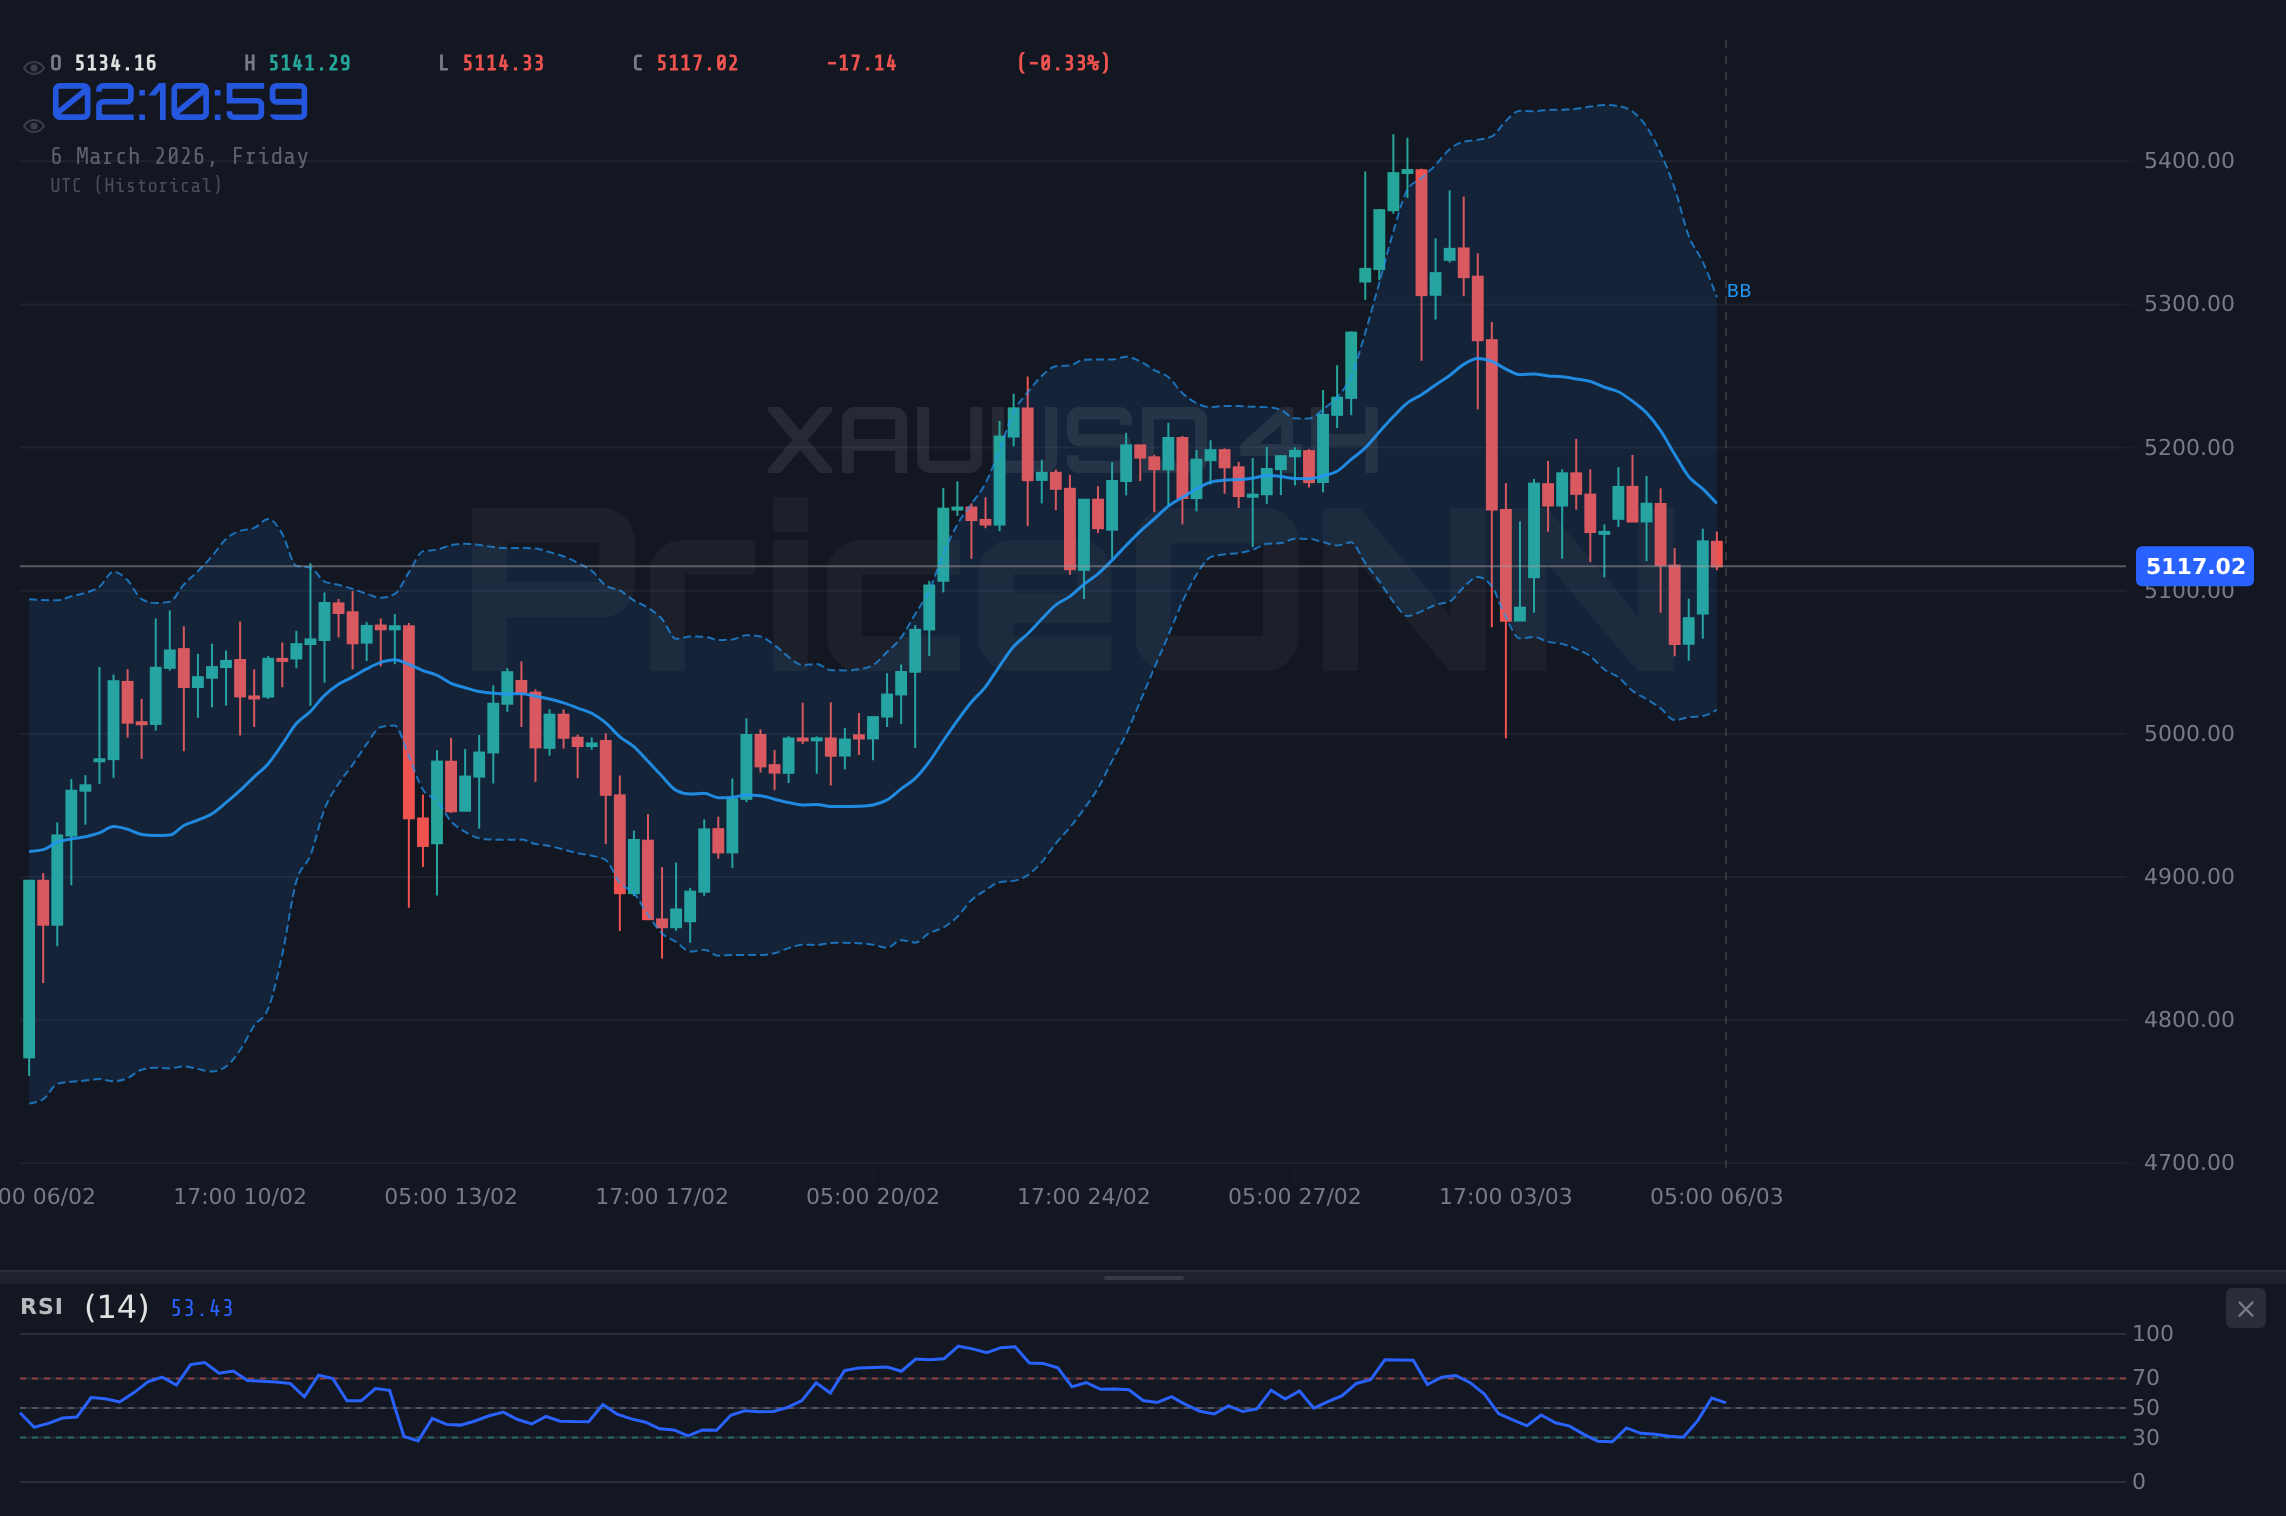
The 4-hour chart paints a more bearish picture. The RSI(14) sits at 45.17, indicating neutral-to-bearish momentum. The MACD displays negative momentum, and the Stochastic indicator shows K=25.95 and D=42.23, signaling a sell. The ADX at 27.73 on the 4H chart suggests a strong downtrend is in place, confirming the bearish outlook on this timeframe. A break below the 4H support level of $5,056.47 could trigger a more significant selloff.
Technicals as Tiebreaker: Multi-Timeframe Analysis
To reconcile these conflicting signals, a multi-timeframe analysis is crucial. On the daily chart, the trend is still up, with the price above the middle Bollinger Band. However, the Stochastic indicator (K=31.73, D=67.76) signals a potential pullback. The ADX at 15.73 indicates a weak trend, suggesting that the recent bullish momentum may be waning. The daily support levels to watch are $5,081.8, $5,022.52, and $4,960.41. A break below $5,081.8 would significantly weaken the bullish case.
Looking at correlation, the SP500 is currently trading at 6834.55, down 0.52% on the day. This suggests a slight risk-off sentiment in the market, which could provide some support for gold. However, the Dow Jones Industrial Average is down a more significant 1.48%, trading at 48032.5. This mixed picture highlights the uncertainty in the market and the potential for volatility in XAUUSD.
For scalpers, the key is to watch the immediate support and resistance levels on the 1-hour chart: $5,075.03 and $5,093.07, respectively. A breakout above resistance could lead to a quick long trade, while a break below support could offer a shorting opportunity. Swing traders should focus on the 4-hour chart, watching for a break of $5,056.47 to confirm a bearish move. Long-term investors should monitor the daily chart and the key support level of $5,081.8. A sustained break below this level could signal a more significant correction.
Historically, gold has often performed well during periods of geopolitical instability and rising inflation. However, it has also been sensitive to changes in US monetary policy and dollar strength. In the past, periods of aggressive Fed rate hikes have often led to significant declines in gold prices. Therefore, it's essential to monitor both geopolitical developments and economic data to assess the outlook for XAUUSD.
One potential catalyst for a bullish move in gold could be a dovish shift from the Federal Reserve. If upcoming economic data weakens, the Fed may signal a willingness to slow down or even pause its rate hikes, which would likely weaken the dollar and support gold prices. Conversely, stronger-than-expected economic data could reinforce the Fed's hawkish stance and exert further downward pressure on gold.
The economic calendar is relatively light today, with only a few high-impact events scheduled. The market will be closely watching the US employment data, as mentioned earlier. Any surprises in these figures could trigger significant volatility in XAUUSD. On Tuesday, March 3rd, there were several GBP and EUR events. However, these events did not have a significant impact on the market. Looking ahead, the market will also be watching for further comments from Fed officials, as these could provide additional clues about the future path of monetary policy.
Conclusion: A Choppy Road Ahead
The outlook for XAUUSD this week is uncertain, with conflicting signals from both technical and fundamental factors. Geopolitical risks provide a floor for gold, while dollar strength and hawkish Fed rhetoric exert downward pressure. Traders should closely monitor key support and resistance levels on multiple timeframes and be prepared for volatility. Until the economic data resolves this, caution is warranted.
Frequently Asked Questions: XAUUSD Analysis
Is XAUUSD a good buy right now?
Given the current volatility and conflicting signals, a cautious approach is warranted. While geopolitical tensions support a bullish outlook, dollar strength is a headwind. A break above $5,093.07 on the 1H chart could signal a buying opportunity.
What is the XAUUSD price forecast for this week?
The XAUUSD price forecast for this week is highly uncertain. A break above $5,093.07 could lead to a test of $5,111.11, while a break below $5,075.03 could trigger a move towards $5,065.57. The probability is roughly 50/50 given the conflicting forces.
What are the key support and resistance levels for XAUUSD?
Key support levels for XAUUSD are $5,075.03, $5,065.57, and $5,056.99. Key resistance levels are $5,093.07, $5,101.65, and $5,111.11. These levels are based on the 1-hour chart and should be monitored closely for potential breakouts or breakdowns.
Why is XAUUSD moving today?
XAUUSD is moving today due to a combination of factors, including hawkish comments from Fed officials, escalating geopolitical tensions in the Middle East, and fluctuating risk sentiment in the broader market. The relative strength of the US dollar is also playing a significant role.
Technical Outlook Summary
| Indicator | Value | Signal |
|---|---|---|
| RSI (14) | 52.34 | Neutral |
| MACD Histogram | Positive | Bullish |
| Stochastic | K=58.63, D=29.42 | Bullish |
| ADX | 38.42 | Strong Downtrend |
| Bollinger | Middle Band | Above |
Key Levels
Support Levels
Resistance Levels
Track markets in real-time
AI-powered analysis, technical indicators and real-time price data.
Join Our Telegram Channel
Breaking market news, AI analysis and trading signals instantly.
Join Channel