BRENT Surges 2%: Technical Analysis and Key Levels at $65.73
BRENT crude oil rises 2% to $65.73, signaling potential bullish momentum while key support and resistance levels guide traders.
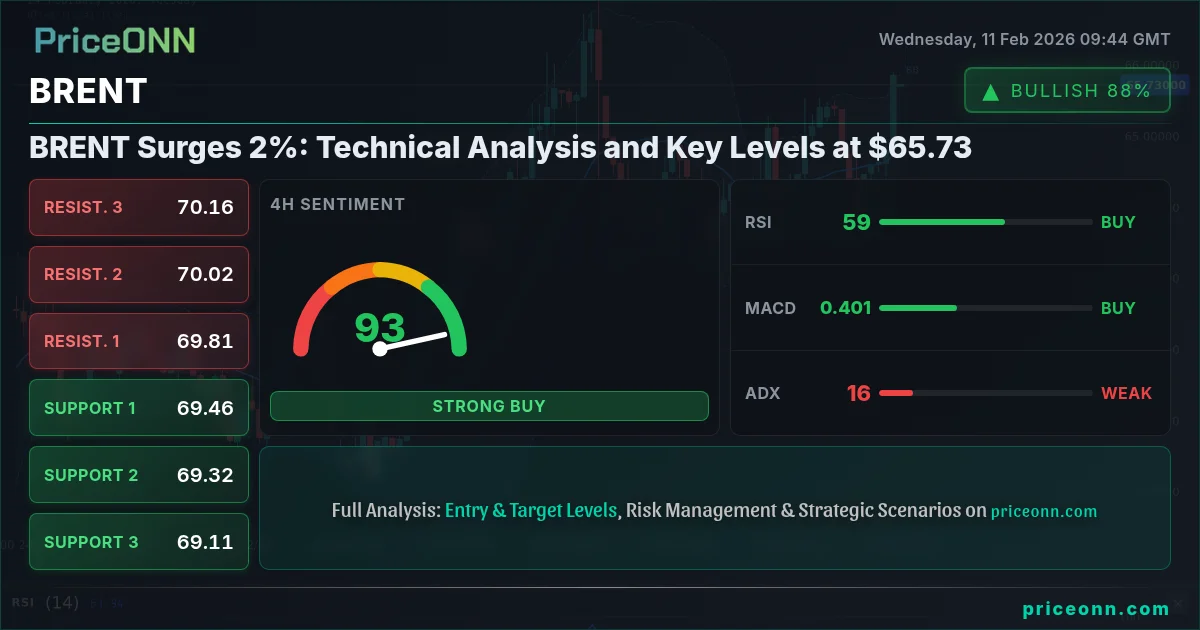
BRENT crude oil has surged by 2% to reach $65.73, capturing the attention of traders and investors alike. This upward movement suggests a growing bullish sentiment, particularly as the market reacts to ongoing geopolitical tensions and fluctuating demand forecasts.
The rise to $65.73 indicates a significant bullish trend, with traders watching key resistance and support levels closely.
Market Overview
The current price of $65.73 reflects a robust demand for Brent crude as global economic recovery continues to influence oil prices. Recent geopolitical developments have also played a critical role in shaping market sentiment. With OPEC+ production decisions looming, Brent's price movements are likely to remain volatile.
Technical Analysis
Analyzing the technical indicators reveals that Brent is currently exhibiting a bullish trend. The following key indicators are noteworthy:
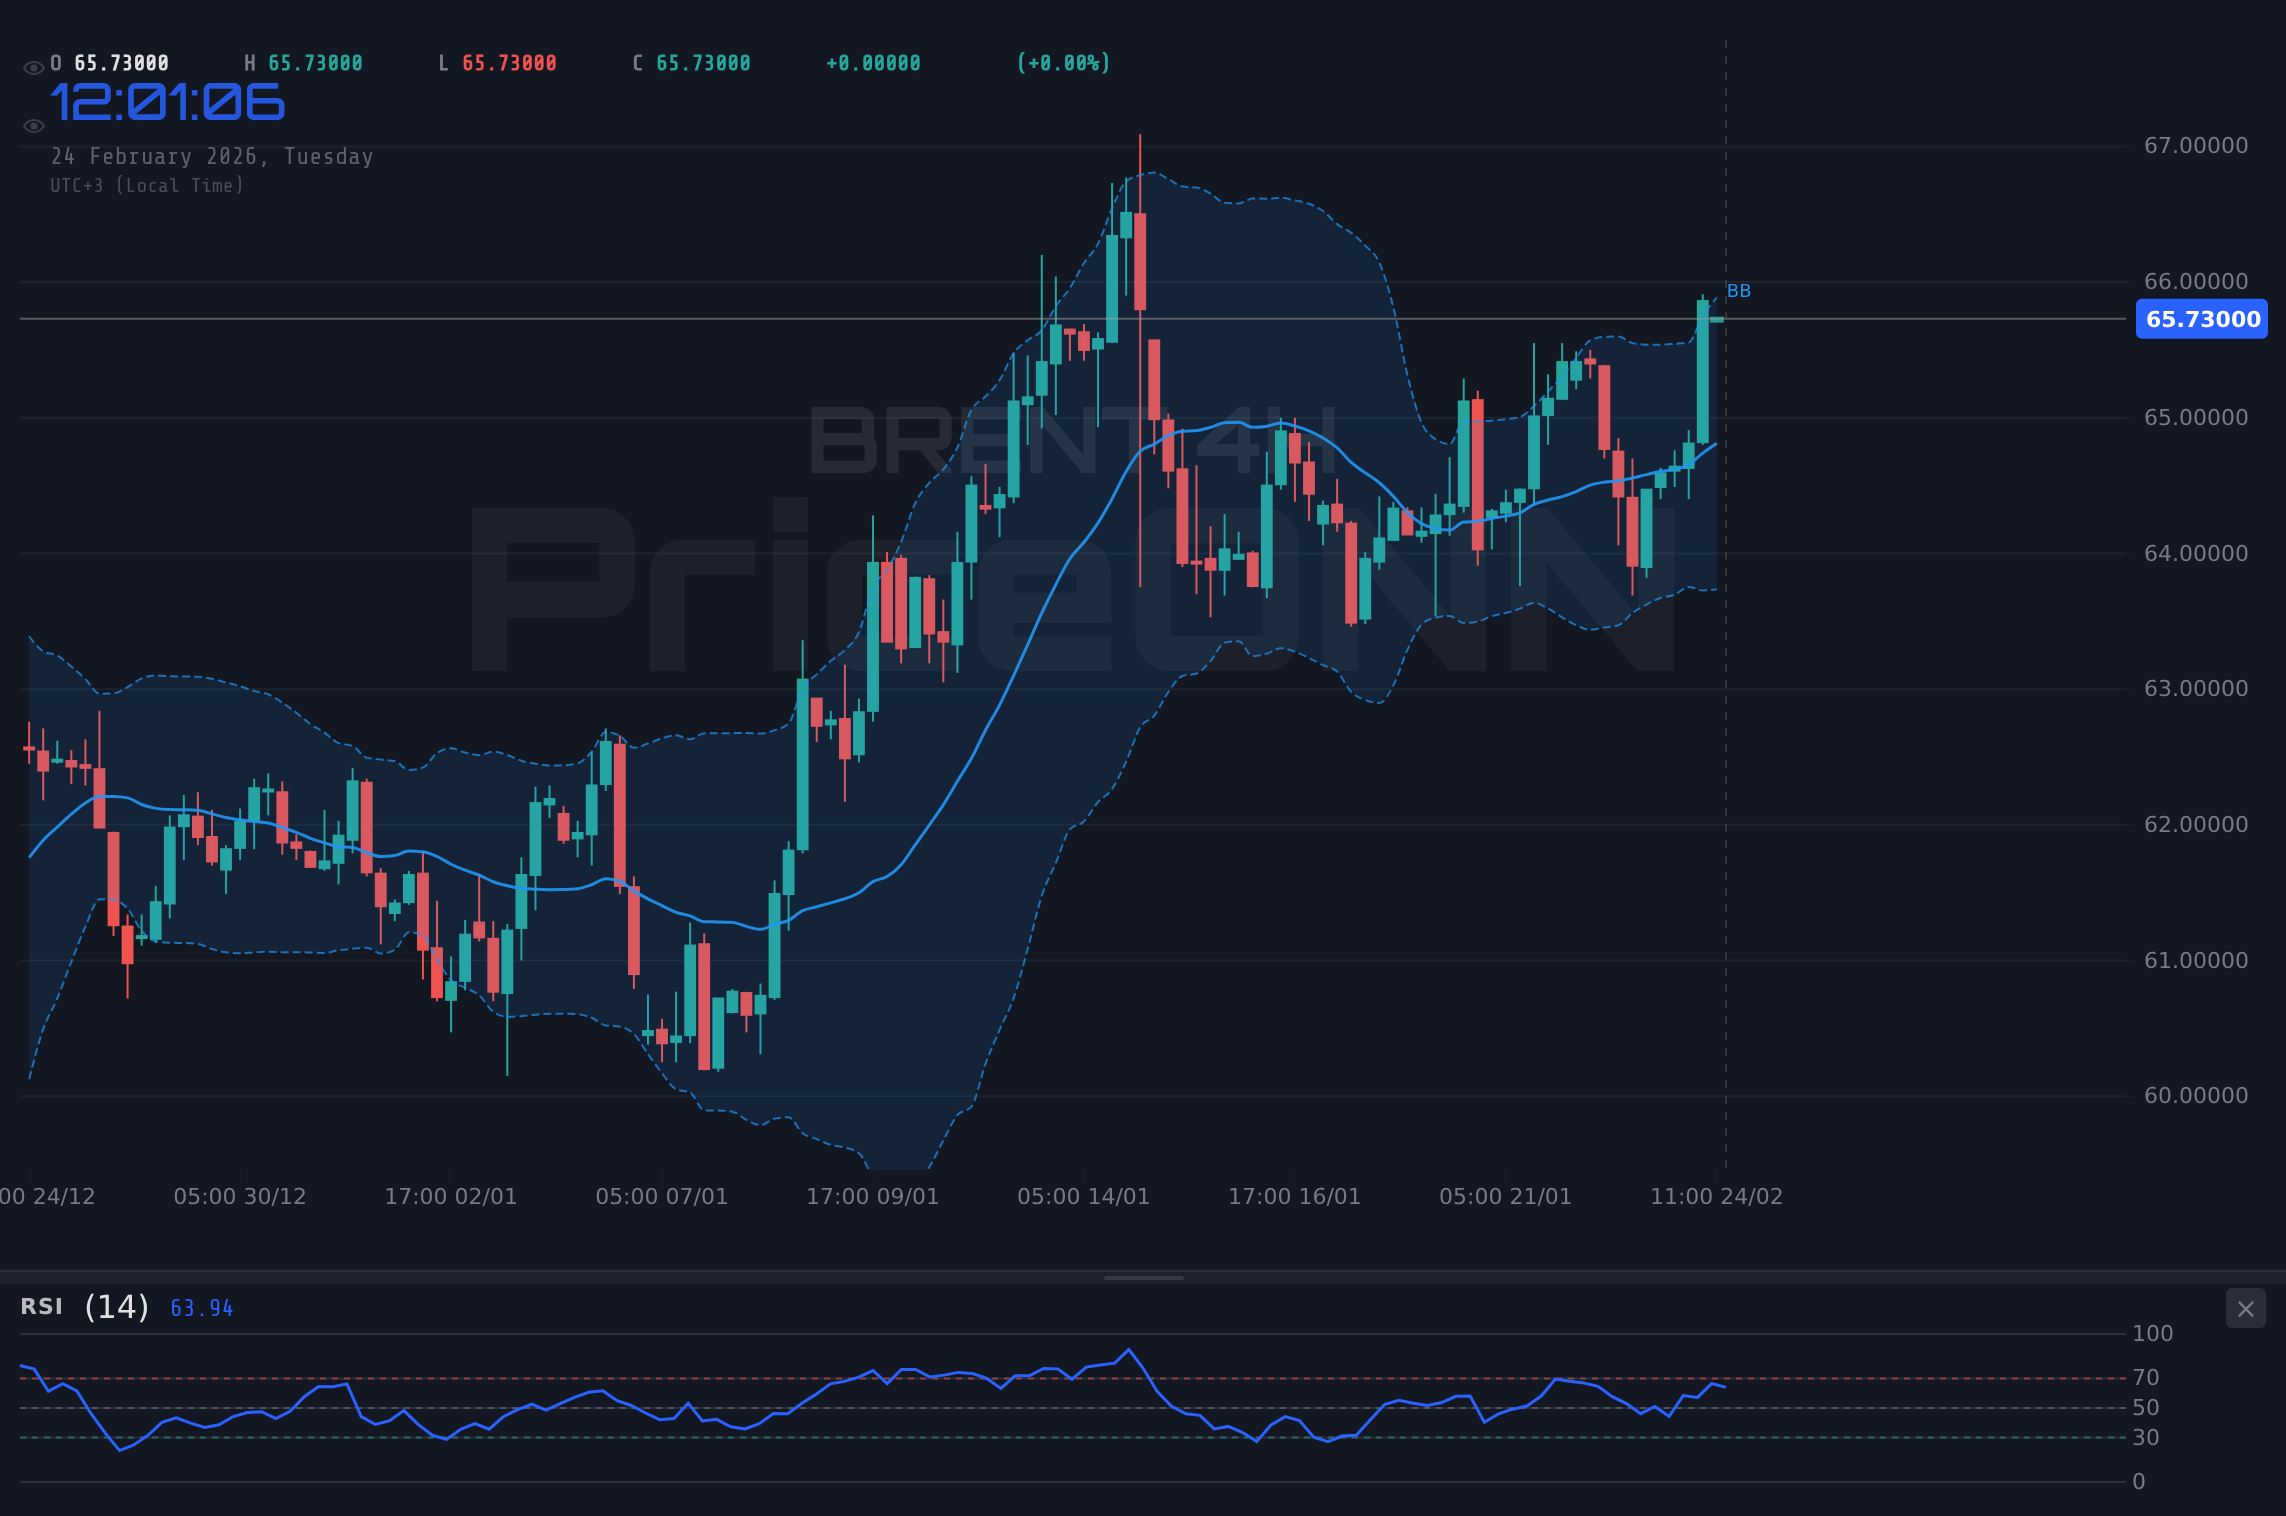
- RSI (14): Currently at 71.16, indicating an overbought condition and potential for a pullback.
- MACD: Positive momentum persists, suggesting the likelihood of continued upward movement.
- ADX: At 19.03, indicating a weak trend; however, a breakout above current resistance could strengthen the bullish sentiment.
Consider leveraging a trailing stop to secure profits while allowing for further upward movement in Brent prices.
Support and Resistance Levels
Be cautious of a potential pullback if the price fails to break above $66.04.
Upcoming Economic Events
Trade Scenarios
Trade Plan
Scenario A: Bullish Continuation
- Direction: Long
- Entry Trigger: Close above $66.04
- Target 1: $67.23 (~1.5% profit)
- Target 2: $68.36 (~4.0% profit)
- Stop/Invalidation: Close below $65.20
Scenario B: Pullback Opportunity
- Condition: Hold above $64.40
- Entry Trigger: Bounce back above $65.73
- Target: $66.04
- Invalidation: Close below $64.40
News Risk: Volatility may increase ahead of the CPI release on February 12. Consider reducing position size.
| Indicator | Value | Signal | Interpretation |
|---|---|---|---|
| RSI (14) | 71.16 | Overbought | Potential for pullback |
| MACD | Positive | Bullish | Momentum is strong |
| ADX | 19.03 | Weak | Trend may be weak |
Track markets in real-time
AI-powered analysis, technical indicators and real-time price data.
Join Our Telegram Channel
Breaking market news, AI analysis and trading signals instantly.
Join Channel