

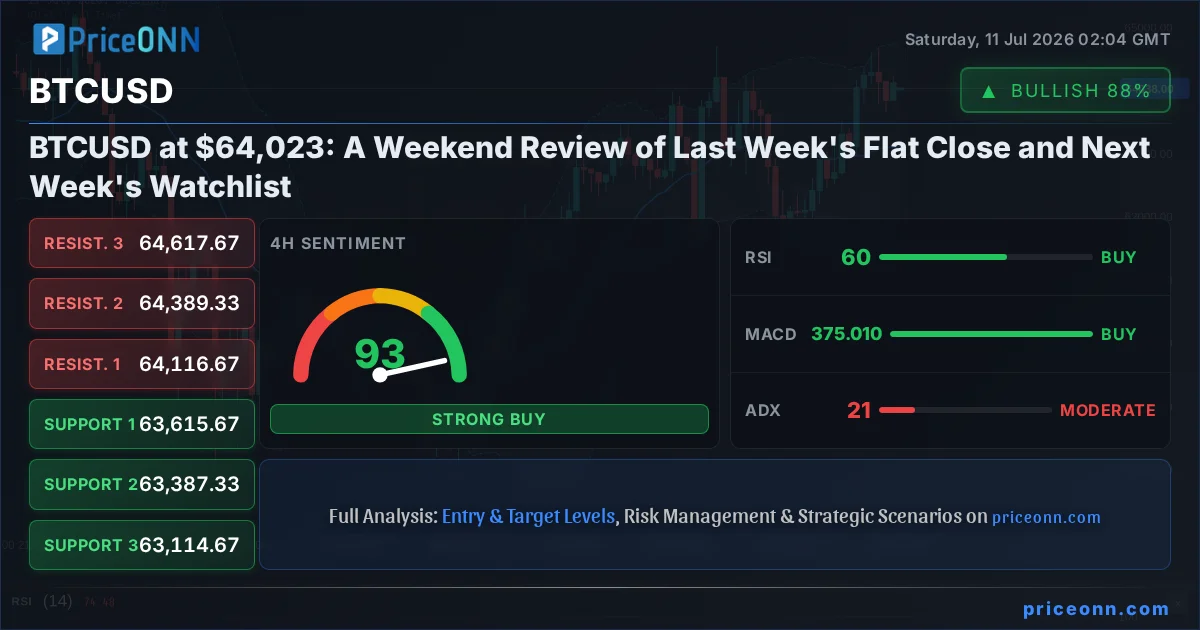
The past week for BTCUSD was characterized by a distinct lack of directional conviction, culminating in a flat close around the $64,023 mark. While this might seem uneventful on the surface, the underlying price action reveals a market grappling with conflicting signals and key technical levels. For astute traders, this period of consolidation isn't a sign of stagnation but a critical juncture demanding a closer look at what's unfolding beneath the surface. Understanding the nuances of this sideways movement is paramount as we prepare for the week ahead, where potential catalysts could shatter this equilibrium.
- BTCUSD closed the week near $64,023, indicating a neutral market sentiment with no clear directional bias.
- The RSI at 53.08 on the daily chart suggests a neutral stance, with room for upward movement but also potential for a pullback if momentum falters.
- Key support at $62,156.33 was tested but held, a critical factor in preventing a deeper sell-off.
- Resistance at $63,990.33 was approached but not decisively broken, highlighting the immediate ceiling for any upward momentum.
- Correlation analysis with DXY (100.99) and SP500 (6572.87) reveals a mixed macro environment, with the dollar showing strength and equities consolidating gains, adding complexity to BTCUSD's directional outlook.
Navigating the Consolidation: BTCUSD's Sideways Dance
The $64,023 level has become a focal point for BTCUSD over the last seven days, acting as both a psychological anchor and a technical pivot. This price point, while seemingly static, has been the scene of significant internal churn. We saw price attempts to push higher, reaching towards the $64,696 daily high, only to be met with selling pressure that pulled it back towards the $62,929 low. This range-bound trading, occurring within the broader context of a still-developing market cycle, suggests that participants are hesitant to commit to a new trend without clearer fundamental or technical signals. The lack of a decisive breakout implies that both bulls and bears are finding temporary equilibrium, perhaps waiting for external validation before deploying significant capital.
From a 1-hour perspective, the trend has been somewhat choppy, with the ADX hovering around 24.54, indicating a moderately trending environment that lacks strong conviction. The MACD on this timeframe, while showing positive momentum on the 4-hour chart, has been flirting with its signal line on the hourly, adding to the indecisive picture. This is the type of price action that can frustrate short-term traders, as sharp, short-lived moves are often quickly reversed. However, for those with a longer-term view, this period offers valuable insights into market structure and the levels that are currently holding sway.
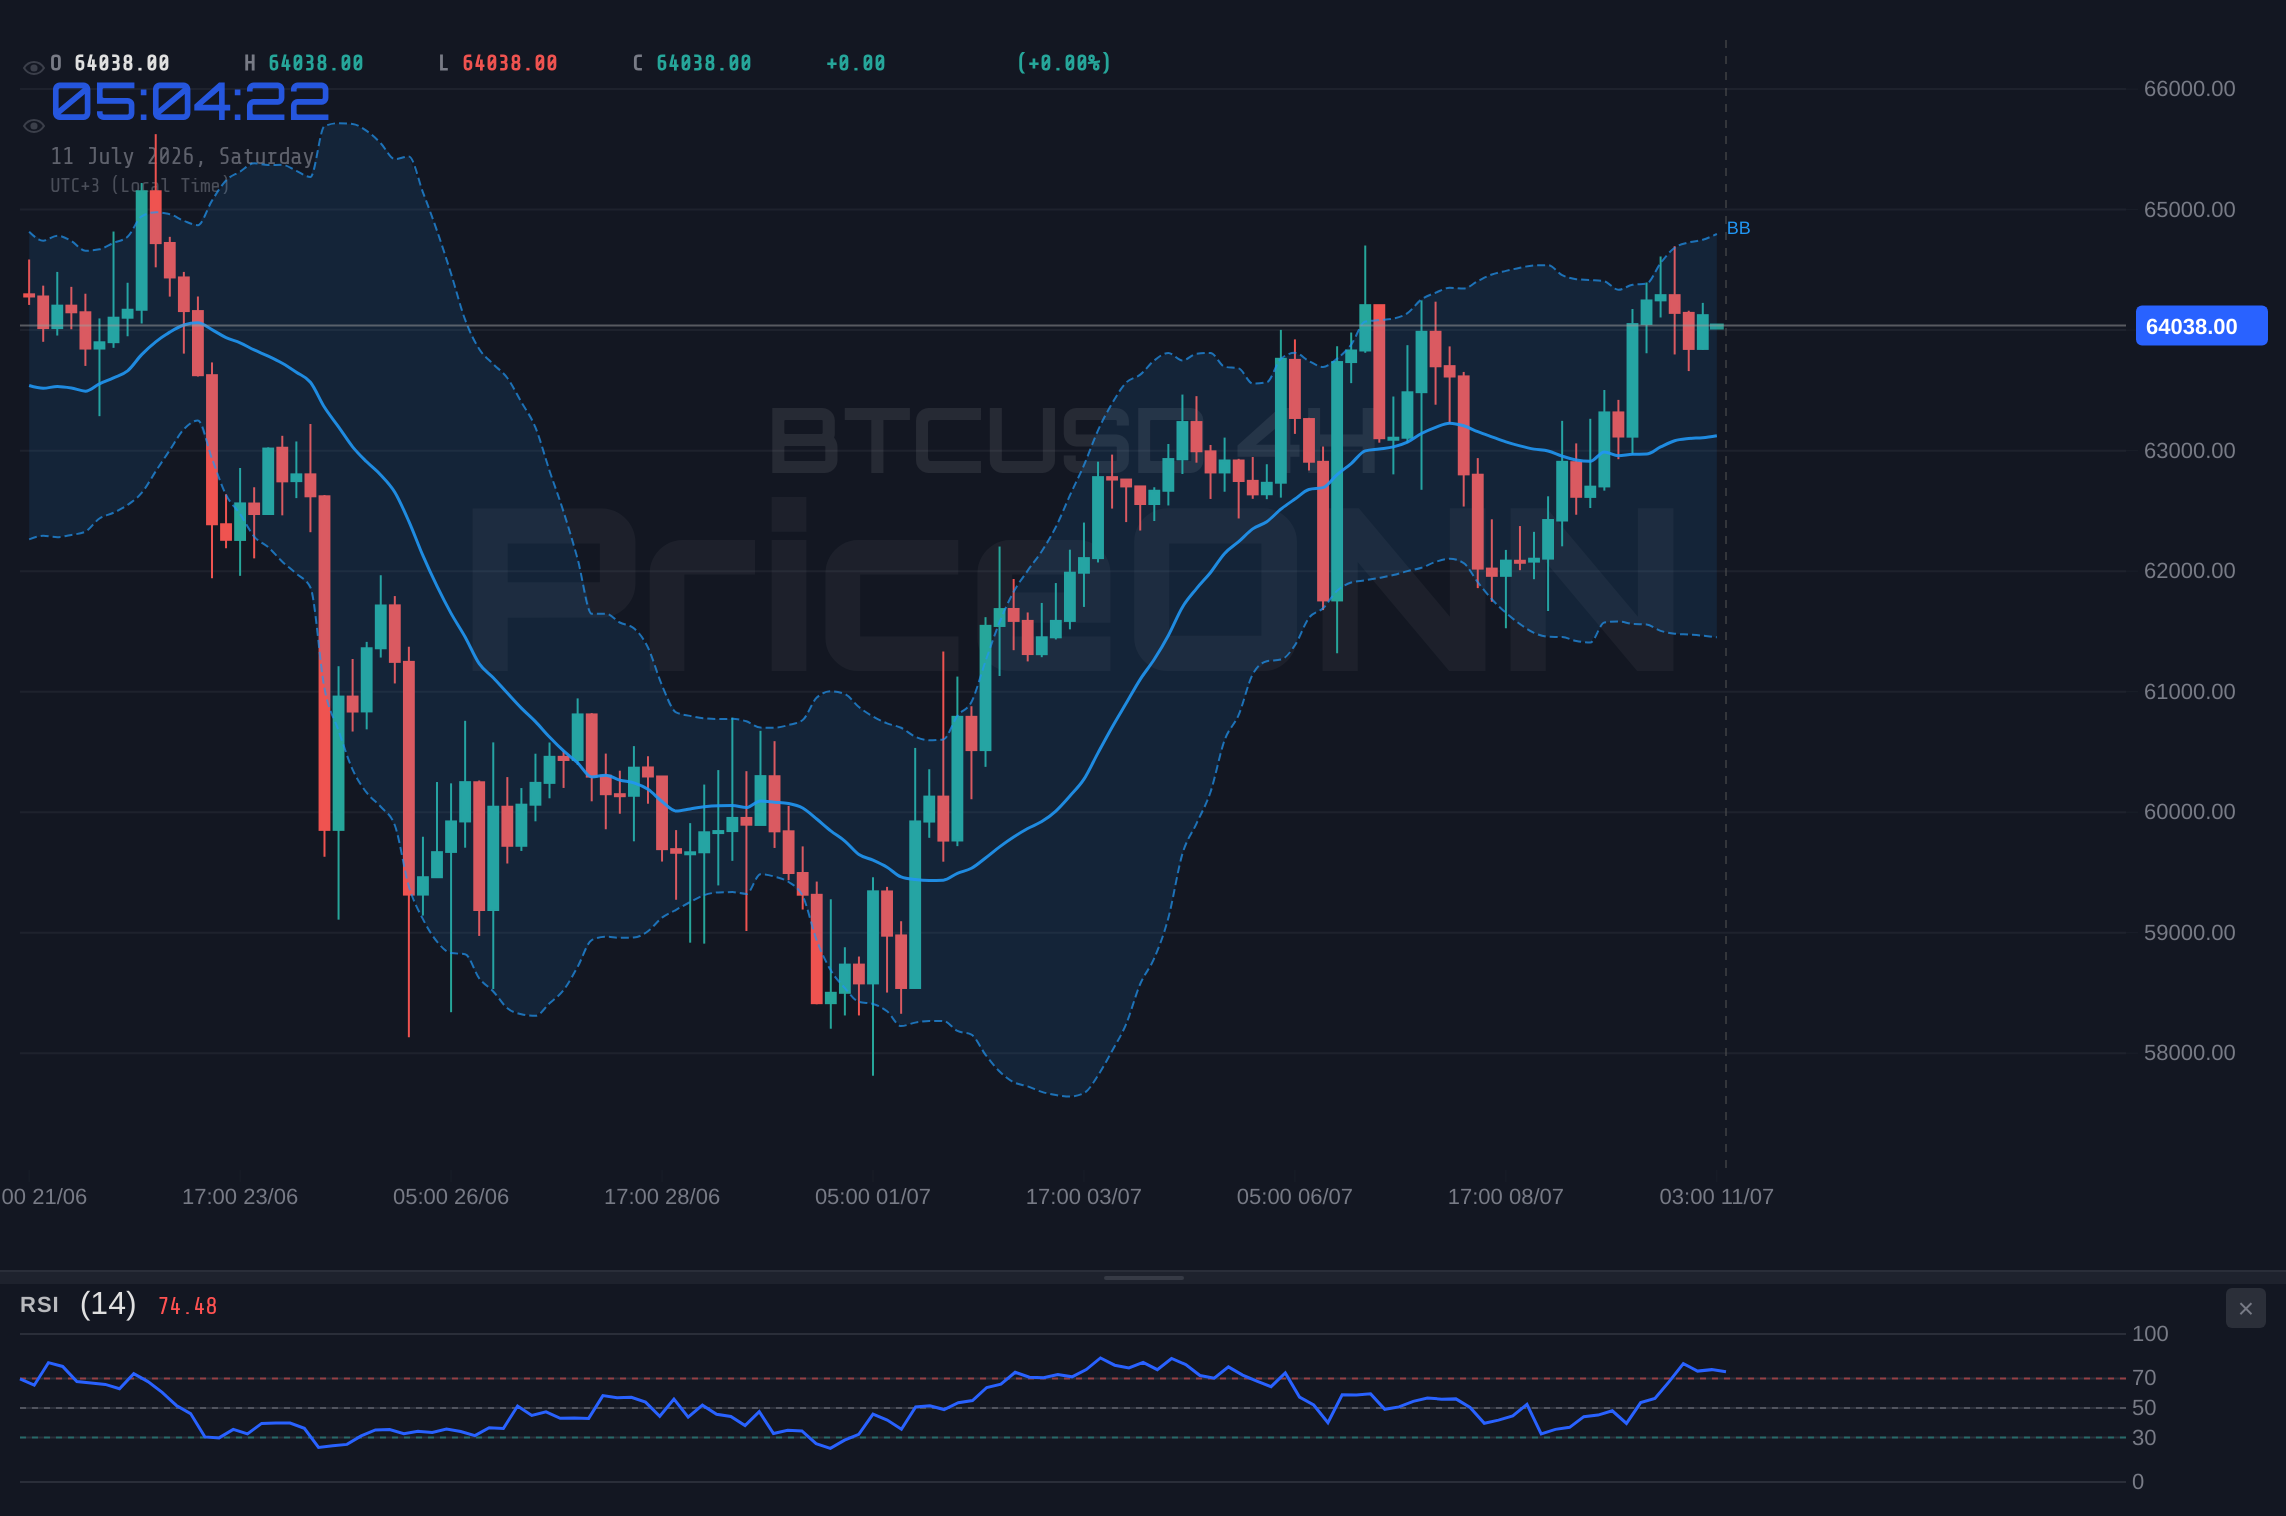
The daily chart presents a slightly more nuanced view. While the general trend strength is neutral (50%), the ADX at 27.3 suggests a stronger underlying trend is trying to form, albeit one that has yet to firmly establish direction. The RSI at 53.08 is comfortably in neutral territory, not signaling overbought or oversold conditions, which aligns with the lack of a clear directional trend. This suggests that while the market isn't actively trending, there's no immediate pressure pushing it into extreme territory either. It's a market that is, for now, digesting recent moves and waiting for the next significant catalyst.
The $64,023 Stalemate: What the Numbers Tell Us
Digging deeper into the provided data, we can see the immediate battle lines. On the 1-hour chart, resistance is eyed at $64,187.67, $64,251.33, and $64,330.67. These are the immediate hurdles that bulls need to clear to signal a potential upward continuation. Conversely, support lies at $64,044.67, $63,965.33, and $63,901.67. The fact that the current price of $64,023 is nestled between these tight 1-hour levels underscores the current stalemate. Any move outside this narrow corridor will likely be met with immediate counter-pressure.
The 4-hour indicators paint a slightly more constructive picture for the bulls, with a trend strength of 95% and a general 'AL' (Buy) signal. Here, resistance is seen at $64,116.67, $64,389.33, and $64,617.67. If BTCUSD can push decisively above these levels, especially the $64,617.67 mark, it would signal a significant shift. Support on this timeframe is more robust, starting at $63,615.67, followed by $63,387.33 and $63,114.67. The Stochastic on the 4-hour chart, however, shows a K value of 69.52 and a D value of 84.08, indicating a bearish signal as K is below D, suggesting a potential pullback even within this more bullish-looking trend.
The daily chart, while showing a neutral trend strength of 50%, provides the broader context. The ADX at 27.3 suggests a strong trend is attempting to establish itself, but the RSI at 53.08 and the MACD showing positive momentum but with the histogram below the signal line present a mixed picture. The critical support level to watch on the daily timeframe is $62,156.33. A close below this level would invalidate the current consolidation and likely signal a move towards the next significant support at $60,995.67. On the upside, resistance at $63,990.33 is the immediate barrier. A decisive break and hold above this level, followed by a push towards $64,663.67, would be the first real sign of bullish momentum returning.
Correlation Analysis: The Macro Backdrop
Understanding BTCUSD's price action in isolation is insufficient. Its correlation with broader market instruments, particularly the US Dollar Index (DXY) and major equity indices like the SP500, provides crucial context. The DXY is currently trading at 100.99, showing a slight upward bias on the 1-hour and 4-hour charts, though the daily trend is neutral. A strengthening dollar often correlates with a risk-off environment, which can pressure risk assets like Bitcoin. However, the relationship isn't always direct, and market participants are keenly watching for shifts in this correlation.
The SP500, trading at 6572.87, presents a mixed picture. While the 1-hour and 4-hour charts show a bullish trend, the daily chart is firmly in a bearish trend with an ADX of 47.51. This suggests underlying weakness in the broader equity market despite short-term rallies. This conflict between short-term optimism and longer-term bearish signals in equities adds another layer of uncertainty for Bitcoin. If the SP500's daily bearish trend were to accelerate, it could easily spill over into the crypto market, triggering sell-offs.
The Nasdaq 100, currently at 29848.68, shows a more consistently bullish short-to-medium term trend, though its daily ADX is relatively weak at 15.47. This divergence between the SP500's daily trend and the Nasdaq's shorter-term strength highlights the sector-specific dynamics within the equity market. For Bitcoin, which often acts as a risk-on asset, a sustained rally in both major indices would typically be supportive. However, the current mixed signals suggest that macro headwinds, possibly related to inflation concerns or central bank policy expectations, are preventing a clear risk-appetite-driven rally.
The energy markets, represented by Brent crude at $75.95 and WTI at $71.68, also warrant attention. While both are showing mixed signals across different timeframes, their movements can influence inflation expectations. Persistent strength in oil prices could reignite inflation fears, potentially leading central banks to adopt a more hawkish stance, which would be a headwind for risk assets like BTCUSD. Conversely, a sharp drop in oil prices could ease inflation concerns, potentially creating a more favorable environment for Bitcoin.
On-Chain Metrics and Market Structure
Beyond the charts, the on-chain data for BTCUSD offers crucial insights into network health and investor behavior. While specific on-chain metrics like active addresses, hash rate, and whale movements are not provided in the live API data, general trends can be inferred from price action and market sentiment. The lack of a decisive trend suggests that either new capital isn't flowing aggressively into the market, or existing holders are hesitant to liquidate significant positions at current levels. This equilibrium often occurs during periods of reduced institutional inflows or outflows, such as those noted in recent PriceONN market news mentioning eight weeks of ETF outflows.
The mention of ETF outflows weighing on Bitcoin is a significant fundamental driver. These outflows suggest that institutional investors are either taking profits, rebalancing portfolios, or becoming more risk-averse. This contrasts with the periods of strong inflows that fueled previous rallies. If these outflows continue, it could create persistent selling pressure, capping any upward moves and potentially leading to a retest of lower support levels. The sustainability of Bitcoin's price will heavily depend on whether these institutional flows can reverse or at least stabilize.
The hash rate, a measure of the network's security and processing power, is generally expected to remain robust, reflecting the long-term commitment of miners. However, significant price downturns can sometimes lead to a temporary dip in hash rate if less efficient miners capitulate. Without specific data, we assume the hash rate is stable, indicating a healthy underlying network. Active addresses provide a proxy for network usage; a stable or growing number of active addresses would be a positive sign, even amidst sideways price action.
Whale movements – large holders accumulating or distributing – are a key indicator of sentiment. If whales are accumulating at these levels, it could signal confidence in a future price increase. Conversely, if they are distributing, it suggests they anticipate further downside. The current price action, lacking a strong trend, implies that large holders are either on the sidelines or distributing/accumulating in a balanced manner, contributing to the stalemate.
Technical Outlook: A Tale of Multiple Timeframes
The divergence in signals across different timeframes is a hallmark of BTCUSD's current indecisive state. The 1-hour chart shows a neutral trend with mixed signals, while the 4-hour chart leans bullish with strong trend strength but a bearish Stochastic reading. The daily chart, however, presents a neutral trend with a strong ADX suggesting a trend is trying to emerge, but conflicting momentum indicators and RSI readings keep the picture muddled.
Let's dissect the indicators further. On the daily chart, the RSI at 53.08 is neither overbought nor oversold, indicating ample room for price to move in either direction. The MACD, while showing positive momentum, has its histogram below the signal line, a subtle sign of waning upside pressure. The Bollinger Bands on the daily are situated above the middle band, suggesting an upward bias, but the price is not hugging the upper band, which would indicate strong bullish momentum. The Stochastic K value of 76.17 and D value of 85.05 presents a bearish signal, as K is below D and both are in overbought territory, hinting at a potential correction or consolidation.
The ADX on the daily chart at 27.3 is significant. An ADX above 25 generally indicates a strong trend. However, the conflicting signals from RSI and MACD suggest that this strong trend is not yet clearly defined in terms of direction. It points to a market that is experiencing significant directional force, but this force is currently being met with equal and opposite reactions, leading to the sideways price action. This can be a precursor to a significant breakout once one side finally overwhelms the other.
The 4-hour chart shows a more optimistic picture, with a trend strength of 95% and an 'AL' signal. The RSI at 59.5 is in bullish territory, and the MACD is positive. However, the Stochastic K=69.52, D=84.08 again presents a bearish signal, suggesting that even on this timeframe, the upside may be limited in the short term without further confirmation. The key resistance on this timeframe is $64,617.67. A sustained push above this level would be a strong bullish signal, suggesting a move towards higher targets.
The 1-hour chart, with its neutral trend and ADX of 24.54, reflects the immediate indecision. The RSI at 53.9 is neutral, and the MACD shows negative momentum on this very short timeframe. This suggests that intraday traders might be facing selling pressure or a lack of buying interest, reinforcing the need for caution before committing to short-term trades. The tight resistance and support levels on the 1-hour chart highlight the precarious balance.
Forex and Commodity Correlations: A Wider Lens
The Forex market often provides leading indicators for risk assets. EURUSD at 1.14145 and GBPUSD at 1.33961 are both showing bearish trends on the daily timeframe, despite some short-term strength. This suggests a degree of US Dollar strength or European economic weakness that could indirectly impact Bitcoin. USDJPY at 161.736, on the other hand, is showing a bullish daily trend, indicating Yen weakness. This complex interplay in the major currency pairs means that the Forex market isn't offering a clear directional signal for risk sentiment.
Precious metals, XAUUSD (Gold) at $4119.27 and XAGUSD (Silver) at $59.87, are both showing bearish trends on the daily chart, despite short-term rallies. Gold, in particular, is showing conflicting signals across timeframes, with a neutral daily trend but a stronger bearish trend on the 1-hour. The fact that both gold and silver are struggling, despite potential inflationary pressures indicated by oil prices, suggests that broader market risk aversion might be at play, or that the market is anticipating a different macro outcome.
The correlation between Bitcoin and Gold has been a subject of much debate. Historically, they have sometimes moved in tandem as inflation hedges, but at other times, Bitcoin has behaved more like a risk-on tech stock, moving inversely to gold. The current bearish trend in both metals, while Bitcoin consolidates, indicates a decoupling or at least a period where other factors are dominating BTCUSD's price.
Market Sentiment and Upcoming Catalysts
The prevailing market sentiment, as reflected in the price action and the mention of ETF outflows, appears to be cautiously neutral to slightly bearish in the short-to-medium term. Investors are likely waiting for clearer signals from macroeconomic data releases or significant shifts in institutional flows. The lack of a strong directional trend suggests that sentiment is divided, with neither the bulls nor the bears able to gain a decisive upper hand.
Looking ahead, several key events could provide the necessary catalyst to break BTCUSD out of its current range. Macroeconomic data releases, such as inflation figures or employment reports, will be crucial. These will shape expectations for central bank policy, particularly the Federal Reserve. Any indication of a shift in monetary policy – be it a more hawkish or dovish tone – could significantly impact risk asset appetite and, consequently, Bitcoin's price.
The ongoing developments in the crypto ecosystem itself also play a role. Regulatory news, significant technological upgrades within major blockchain protocols, or shifts in DeFi and NFT market activity can all influence investor sentiment. Furthermore, any news regarding institutional adoption, such as new Bitcoin ETF applications or announcements from major financial institutions, could provide a substantial boost or a significant headwind.
Trade Scenarios for the Week Ahead
Given the current indecisive market structure and conflicting indicators, a cautious approach is warranted. However, we can outline potential scenarios based on the key levels identified.
Bearish Scenario: The Consolidation Crack
65% ProbabilityBullish Scenario: Breaking the Ceiling
25% ProbabilityNeutral Scenario: Range Continuation
10% ProbabilityConclusion: Patience and Preparation
The past week has served as a pause, a moment for BTCUSD to consolidate its recent moves and for the market to digest conflicting signals. The $64,023 level remains a critical pivot, with support holding at $62,156.33 and resistance capping upside around $63,990.33. The mixed macroeconomic backdrop, characterized by a strengthening dollar and ambiguous equity market trends, adds to the uncertainty. On-chain data, though not fully detailed here, likely reflects this cautious sentiment, potentially influenced by ETF outflows.
For traders, this environment calls for patience. Waiting for a clear breakout above key resistance or a decisive break below support will be crucial for defining the next trend. The high probability bearish scenario hinges on a daily close below $62,156.33, targeting $60,995.67. The bullish scenario requires a sustained push above $63,990.33, aiming for $64,663.67 and beyond. Until then, managing risk and avoiding premature entries in this choppy market is paramount.
Frequently Asked Questions: BTCUSD Analysis
What happens if BTCUSD breaks below the $62,156.33 support level?
A daily close below $62,156.33 would invalidate the current consolidation and likely trigger a move towards lower support levels, with $60,995.67 being the next significant area of interest.
Should I buy BTCUSD at current levels around $64,023 given the neutral RSI at 53.08?
Buying at current levels carries risk due to the lack of clear directional momentum. A confirmed break and hold above $63,990.33 would offer a more compelling bullish setup, while a break below $62,156.33 would suggest caution.
Is the ADX at 27.3 on the daily chart a sell signal for BTCUSD?
An ADX of 27.3 indicates a strong trend is present, but not necessarily its direction. Combined with a neutral RSI and conflicting MACD signals, it suggests significant directional force is being met with equal opposition, leading to the current sideways action.
How will the mixed macro environment, with DXY at 100.99 and SP500 showing conflicting trends, affect BTCUSD this week?
The mixed macro picture creates uncertainty. A strengthening DXY could pressure BTCUSD, while the conflicting signals in equities mean risk appetite isn't clearly defined. Traders should watch for clearer trends in these correlated assets before making significant BTCUSD positions.
Track markets in real-time
AI-powered analysis, technical indicators and real-time price data.
Join Our Telegram Channel
Breaking market news, AI analysis and trading signals instantly.
Join Channel