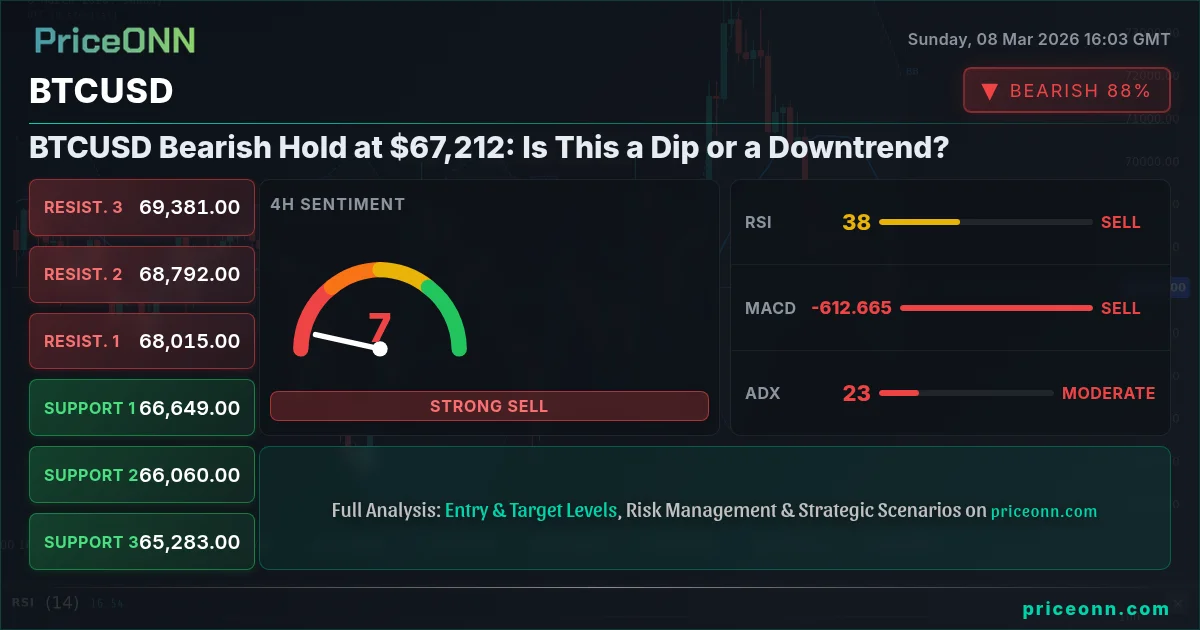
The battle between bulls and bears is intensifying around BTCUSD at $67,212, a critical juncture that could determine the short-term direction of Bitcoin. After a period of consolidation, the cryptocurrency is facing renewed selling pressure, raising questions about its ability to sustain its recent gains. Is this simply a healthy correction, or are we witnessing the beginning of a more significant bearish phase? The outcome hinges on the interplay of technical indicators, market sentiment, and macroeconomic forces.
- RSI at 43.45 suggests further downside potential, with no immediate oversold bounce in sight.
- Critical support lies at $66,740.33, a break below which could trigger a sharper selloff.
- MACD histogram shows waning bullish momentum, hinting at a potential trend reversal.
- DXY strength is weighing on BTCUSD, highlighting the inverse correlation between the two assets.
The Bull Case for BTCUSD
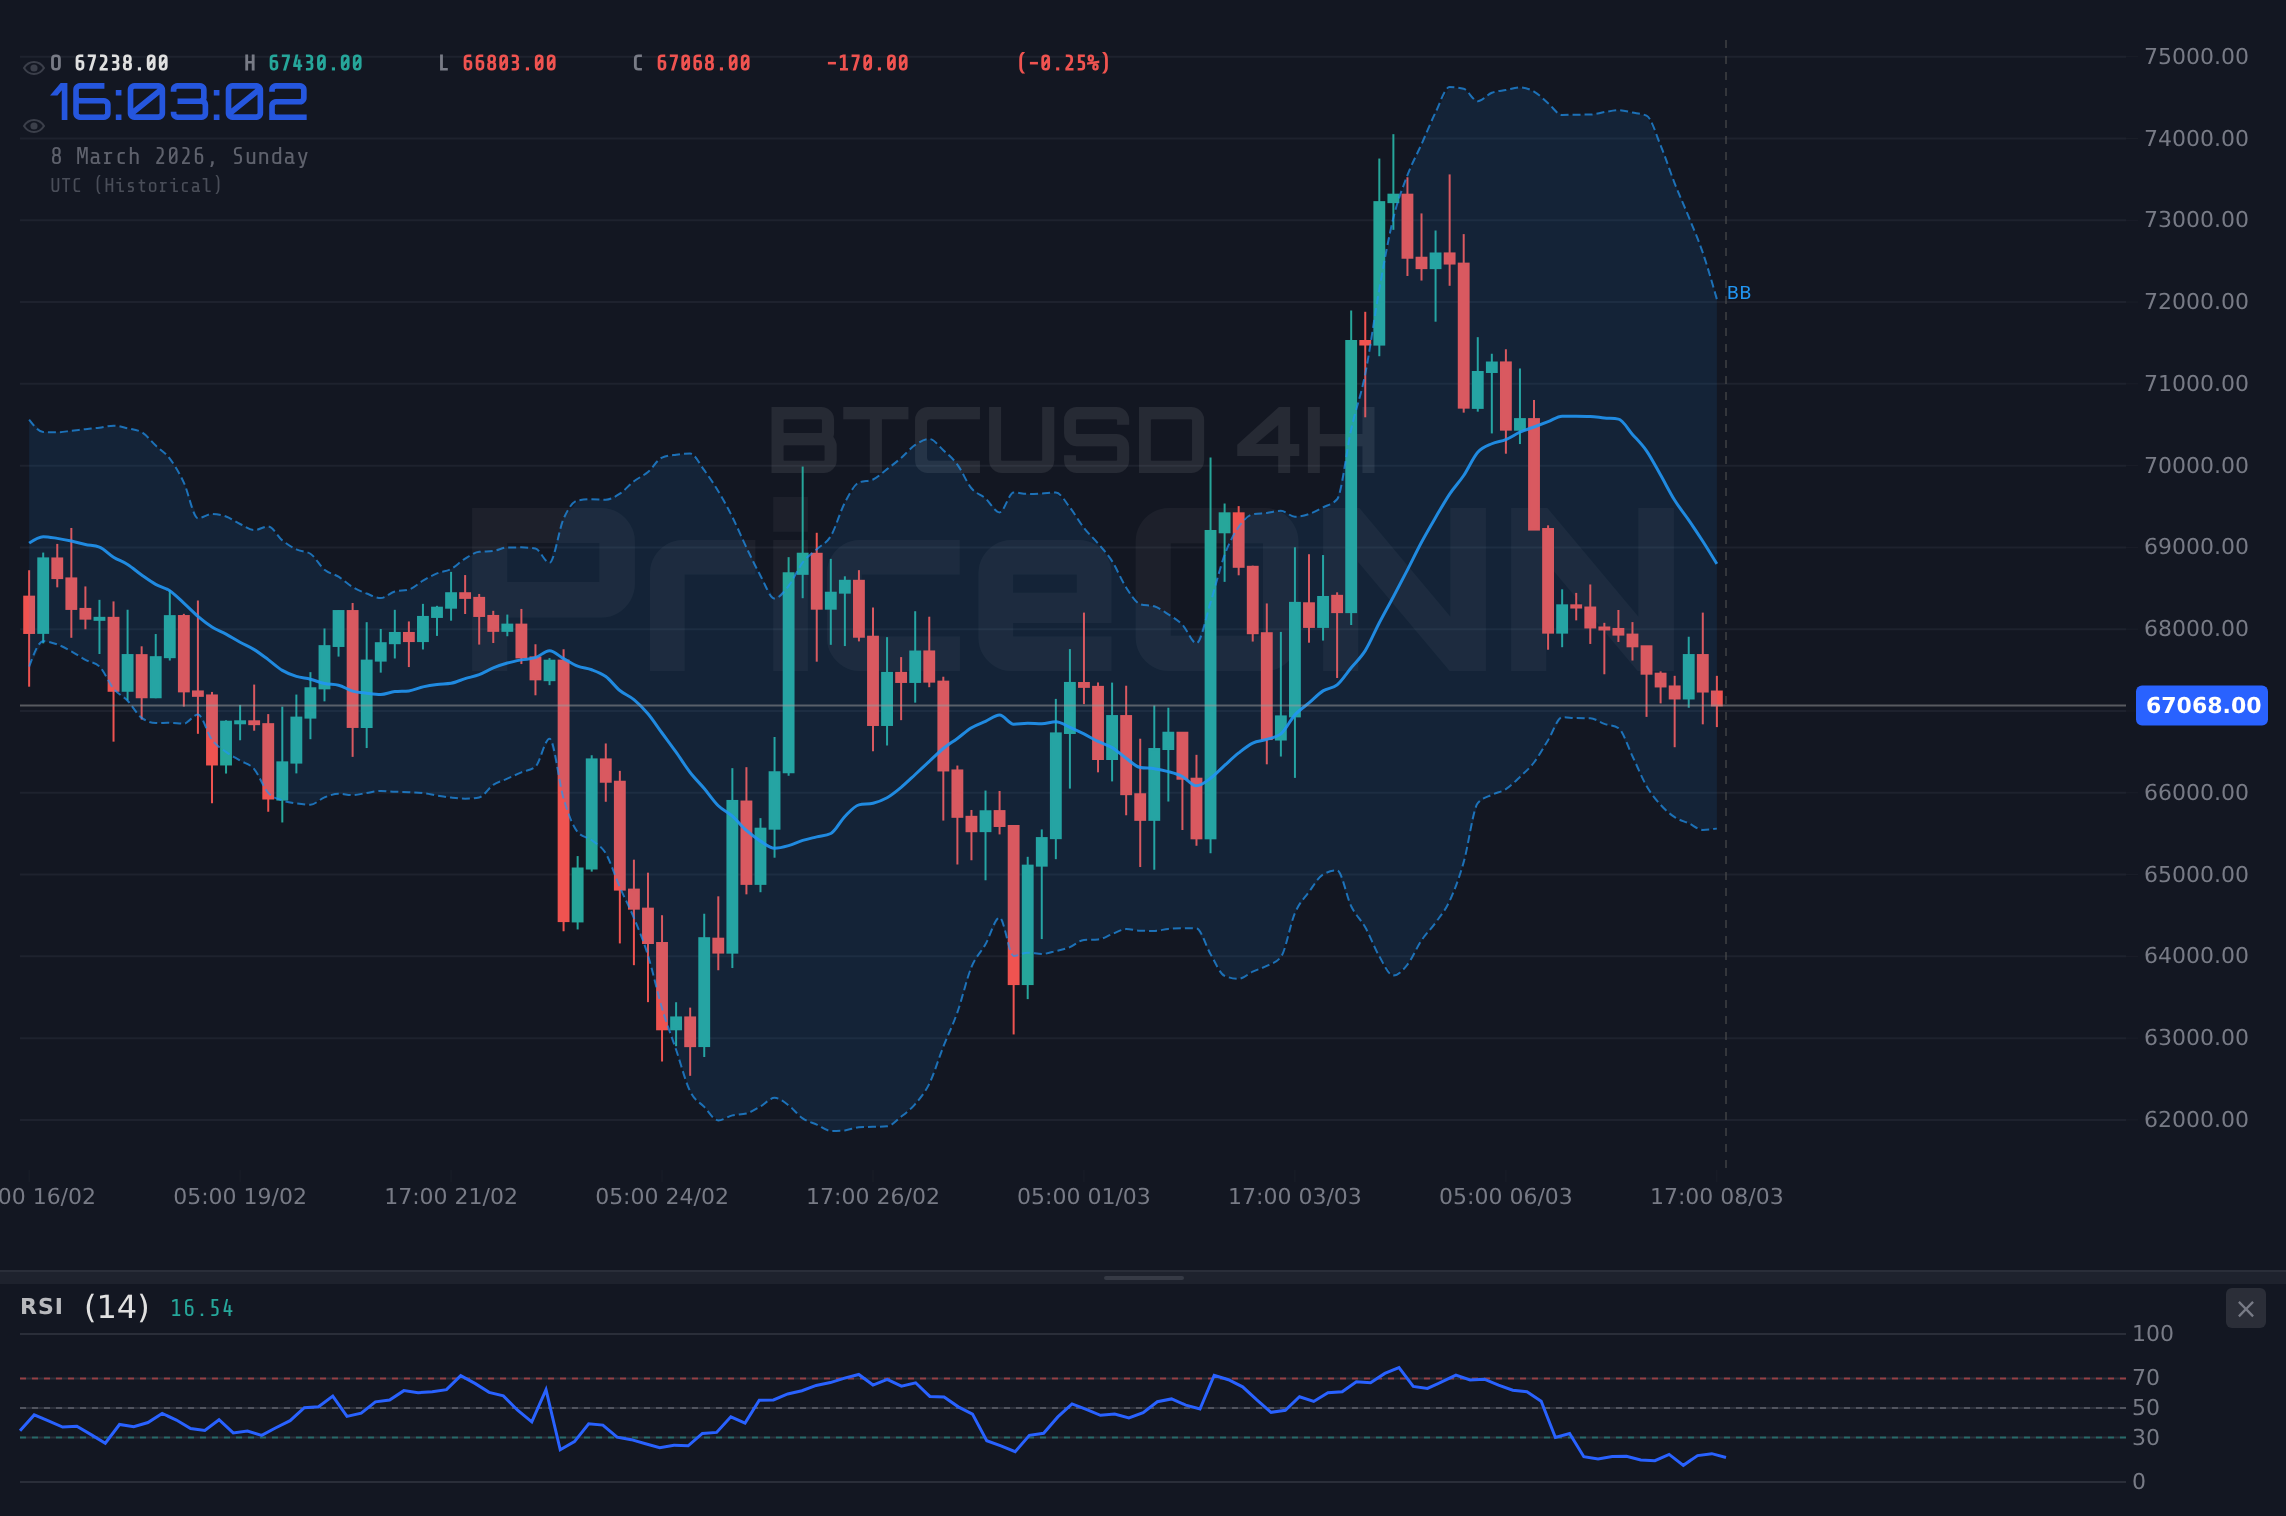
Despite the recent bearish pressure, the bull case for BTCUSD remains intact, supported by several compelling factors. First and foremost, the long-term uptrend remains unbroken. Bitcoin has demonstrated remarkable resilience throughout its history, consistently recovering from pullbacks and achieving new all-time highs. This inherent bullish bias stems from its scarcity, decentralized nature, and growing adoption by institutional investors. The 1-day chart shows the price is currently testing the middle Bollinger Band, and a successful hold here could signal a continuation of the upward trend. Scalpers will watch for a bounce off of this level for short-term long opportunities, while swing traders will look for a break above the nearest resistance at $67,495.67 on the 1H timeframe.
Furthermore, the current dip could be viewed as a healthy correction, allowing the market to digest recent gains and establish a more sustainable foundation for future growth. A period of consolidation is often necessary after a significant rally, as it shakes out weaker hands and allows stronger players to accumulate positions. The overall signal for the 1H timeframe is still a buy, which could mean that we are seeing a temporary dip before the price continues its upward movement. The Stochastic K=34.5, D=58.05 shows a potential for a short-term move upward, and savvy traders will watch for this signal to be confirmed.
News from PriceONN's market news feed may also provide a bullish case for BTCUSD. As mentioned in the March 5th post, "Bitcoin Resilience Amidst Market Volatility: A Forex Perspective," Bitcoin has shown an ability to hold its own even in the face of turbulent market conditions, and it is possible that it could do so again. The recent surge in WTI oil prices, currently at $90.66, could also contribute to inflation fears, driving investors toward Bitcoin as a hedge against currency devaluation. Long-term investors will see this as an opportunity to add to their positions, capitalizing on the dip to increase their exposure to Bitcoin's long-term growth potential.
The Bear Case for BTCUSD
However, the bear case for BTCUSD cannot be ignored. The recent price action suggests that the bulls are losing momentum, and several technical indicators point to further downside risk. The 1H chart shows a strong overall sell signal, and the RSI at 43.45 indicates that Bitcoin has room to fall before reaching oversold territory. The ADX is at 40.14, indicating a strong downtrend on the 1H timeframe. This suggests that the bears are currently in control and could push the price lower in the coming days. The key level to watch is the support at $66,740.33; a decisive break below this level could trigger a cascade of selling, potentially leading to a more significant correction.
Moreover, the strength of the DXY (Dollar Index), currently at 98.57, is putting pressure on BTCUSD. Bitcoin and the dollar often exhibit an inverse correlation, as a stronger dollar tends to reduce demand for alternative assets like Bitcoin. The potential for further DXY upside, driven by hawkish Federal Reserve policy, could continue to weigh on BTCUSD in the near term. As mentioned by Reuters, "Fed officials are worried that inflation is proving to be inatct." This could mean that the Fed will continue its hawkish policies, pushing the DXY higher and BTCUSD lower.
Adding to the bearish sentiment, the recent weakness in the S&P 500, currently at 6743.17, is also a cause for concern. Bitcoin has become increasingly correlated with equities in recent years, and a sustained downturn in the stock market could drag Bitcoin lower as well. The confluence of these factors- technical weakness, DXY strength, and equity market jitters- paints a challenging picture for BTCUSD in the short term. Savvy short term traders will watch for a break below the $67,124.67 level on the 1H timeframe to open short positions, while swing traders will look for a break below the $66,740.33 level on the 1D timeframe.
Technical Analysis: Bulls vs. Bears at a Crossroads
The technical picture for BTCUSD is currently mixed, reflecting the ongoing battle between bulls and bears. On the one hand, the 1H chart shows that the price is trading below its 200-period moving average, a bearish signal. The MACD histogram is also showing negative momentum, further supporting the bear case. The Stochastic K=34.5, D=58.05 on the 1H chart shows a downward signal, indicating that the bears are in control in the short term. The trend is neutral on the 1H timeframe, with a strength of 50%, and the overall signal is a sell. This means that there is little conviction in the price, and traders should be cautious.
On the other hand, the overall signal on the 1D timeframe is still a buy, indicating that the bulls are in control in the long term. The RSI on the 1D chart is at 45.02, and while below 50, it is not in oversold territory. This leaves room for further downside, but also suggests that the price is not yet at a point where a significant bounce is likely. The key will be to watch how BTCUSD reacts to the support level at $66,740.33. A successful defense of this level could pave the way for a renewed bullish push, while a break below it would likely confirm the bearish thesis.
Looking at BTCUSD's correlation with other markets is also important. The DXY, currently at 98.57, is showing a strong overall buy signal on the 1D timeframe. This inverse correlation could mean that BTCUSD will continue to face downward pressure. The overall signal on the SP500 is a sell, and this could also contribute to the downward pressure on BTCUSD. The price of WTI crude oil is currently at $90.66, and showing an overall buy signal. This could contribute to inflation fears, which could be a bullish signal for BTCUSD as traders seek out a hedge against inflation. The important thing to watch is the Fed's response to any inflation data, and their possible effect on the DXY.
BTCUSD Trade Plan
Given the current technical picture, a cautious approach is warranted. While the long-term bullish outlook remains intact, the short-term risks are elevated. A potential trade setup could involve waiting for a confirmed break below the $66,740.33 support level before initiating a short position.
A confirmed break below $66,740.33 would likely trigger a selloff towards the next support level at $66,024.67, followed by a potential test of $65,121.33. This scenario hinges on continued DXY strength and equity market weakness.
If BTCUSD manages to hold above $66,740.33, a bounce towards the $67,495.67 resistance level becomes possible. A successful break above this level could open the door for a retest of recent highs at $68,359.33.
Entry Trigger: A confirmed break and close below $66,740.33 on the 1H chart.
Target 1: $66,024.67
Target 2: $65,121.33
Stop/Invalidation Level: $67,495.67 (a move above this level would invalidate the bearish thesis)
Bitcoin vs Gold Investment 2026: A Modern Portfolio Debate
The discussion around bitcoin vs gold investment 2026 continues to evolve as both assets navigate the complexities of the modern financial landscape. Bitcoin, with its inherent volatility, presents a high-risk, high-reward profile, appealing to investors seeking exponential growth. Gold, on the other hand, offers stability and acts as a traditional safe haven during economic uncertainties. The question of which asset class is superior depends largely on an investor's risk tolerance, investment goals, and time horizon. While Bitcoin's long-term potential remains significant, Gold's established role as a store of value cannot be overlooked. For those seeking to diversify their portfolios, allocating a portion to both Bitcoin and gold may be a prudent strategy.
Frequently Asked Questions: BTCUSD Analysis
Is BTCUSD a good buy right now?
At $67,212, BTCUSD is at a critical juncture. The short-term technical outlook is bearish, but a hold above $66,740.33 could signal a bounce. A cautious approach is warranted.
What is the BTCUSD price forecast for this week?
The price forecast for BTCUSD this week is mixed. A break below $66,740.33 could lead to a test of $66,024.67. A hold above $66,740.33 could see a retest of $67,495.67.
What are the key support and resistance levels for BTCUSD?
Key support levels for BTCUSD are $66,740.33 and $66,024.67. Key resistance levels are $67,495.67 and $68,359.33. These levels must be watched closely for potential breakouts or breakdowns.
Why is BTCUSD moving today?
BTCUSD is moving today due to a combination of technical factors and DXY strength. The bearish technical setup on the 1H chart is weighing on the price. A stronger DXY is also putting pressure on BTCUSD.
Technical Outlook Summary
| Indicator | Value | Signal |
|---|---|---|
| RSI (14) | 43.45 | Bearish |
| MACD Histogram | Negative | Bearish |
| Stochastic | 34.5/58.05 | Bearish |
| ADX | 40.14 | Strong Trend |
| Bollinger | Middle Band | Watch |
Key Levels
Support Levels
Resistance Levels
Track markets in real-time
AI-powered analysis, technical indicators and real-time price data.
Join Our Telegram Channel
Breaking market news, AI analysis and trading signals instantly.
Join Channel