Bitcoin is currently trading around $67,521, experiencing a slight pullback after a week of consolidation. The "bitcoin halving impact analysis" is a key area of focus as traders weigh the potential effects of the upcoming event against current market dynamics. As the markets closed last Friday, Bitcoin's price action reflected a cautious sentiment amid mixed signals from technical indicators and a relatively flat trade balance report for the week.
- RSI at 48.33 suggests neutral momentum, indicating a potential for either bullish or bearish movement.
- Key support level sits at $66,663, tested multiple times during the week.
- MACD histogram shows weakening bearish momentum: bullish reversal may be imminent.
- Fed rate expectations are driving BTCUSD correlation with DXY, impacting short-term price action.
BTCUSD: Navigating the Choppy Waters Around $67,521
Last week saw Bitcoin fluctuating within a relatively tight range, unable to decisively break above the $68,000 resistance level or fall below the $66,500 support. This sideways movement has left traders uncertain about the next direction. The current price of $67,521 reflects this indecision, hovering just above the psychological support level. The recent U.S. Weekly Economic & Financial Commentary highlighted a uniformly negative February jobs report, which could add further uncertainty to the market outlook.
From a technical perspective, the 1-hour chart shows a neutral trend with the Relative Strength Index (RSI) at 48.33. This indicates that neither the bulls nor the bears have a clear advantage at the moment. The Moving Average Convergence Divergence (MACD) histogram, while still positive, shows signs of weakening, suggesting that the bullish momentum is fading. The Stochastic oscillator, with K=74.81 and D=74.71, signals a potential bullish crossover, but the proximity of these values suggests limited conviction.
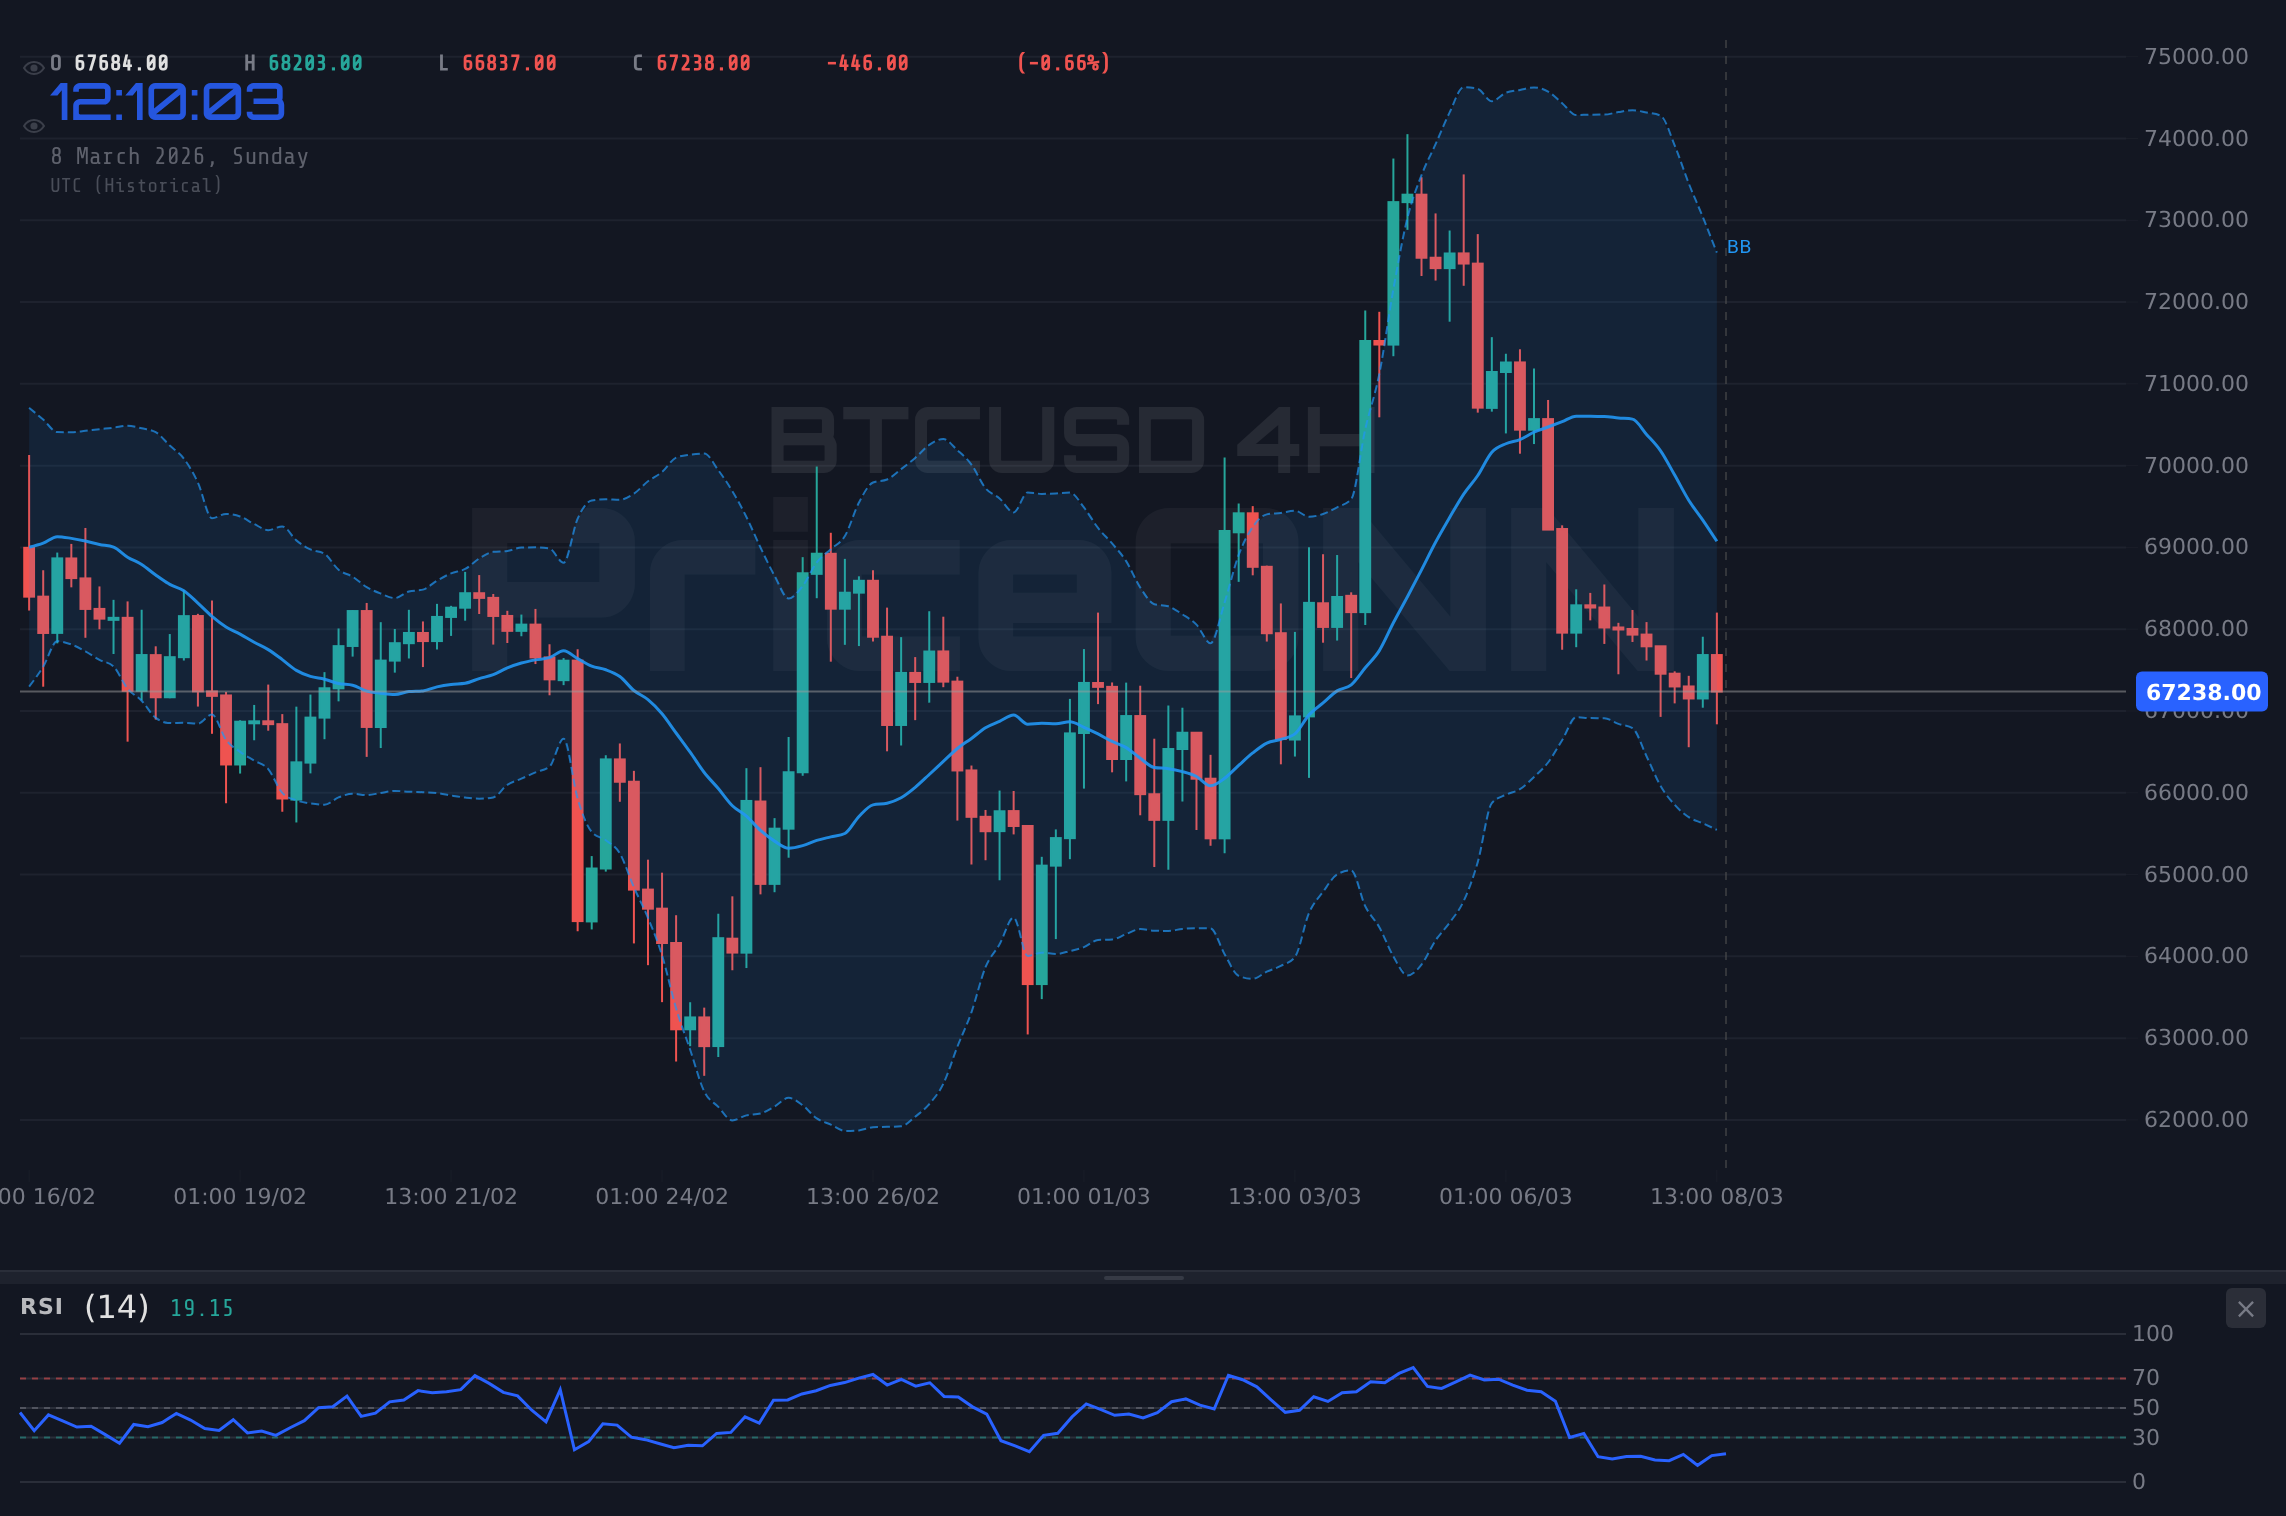
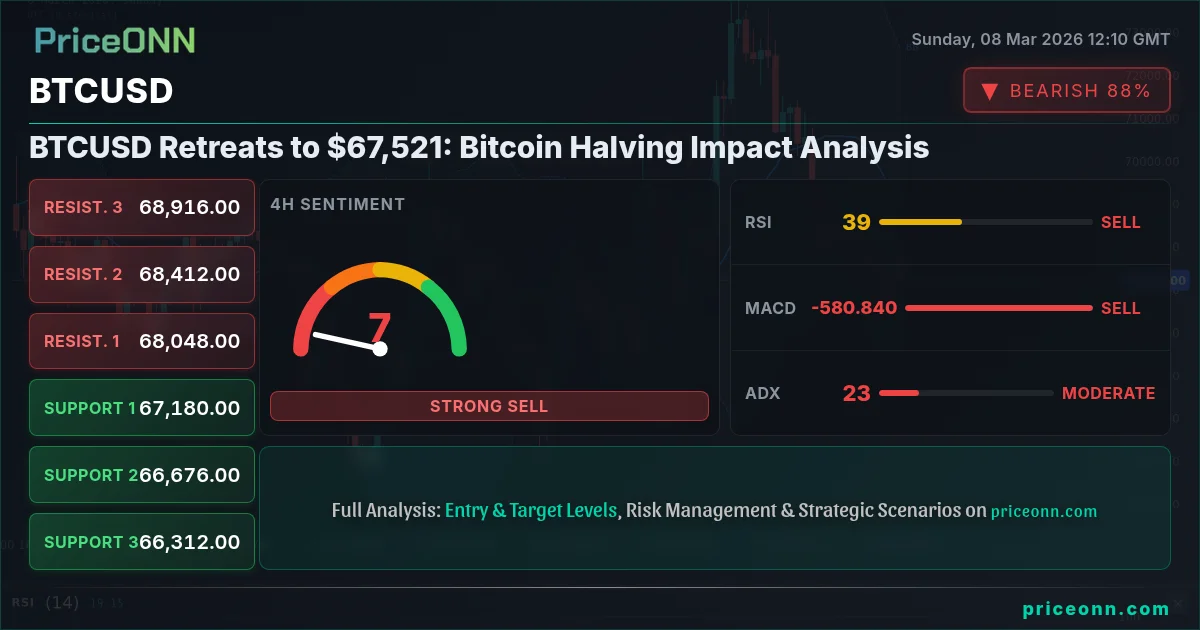
On the 4-hour timeframe, the trend also remains neutral, with the RSI at 40.35. The MACD histogram is negative, indicating bearish momentum, but the Stochastic oscillator shows a potential bullish divergence (K=31.43, D=16.44). This divergence suggests that the selling pressure may be easing, and a potential reversal could be on the horizon. The ADX at 23.53 indicates a moderate trend, suggesting that while there is some directional conviction, it is not overwhelmingly strong. The last PriceONN market news indicated that Bitcoin was consolidating above $70,000; however, that level has not held, resulting in a retreat.
The daily chart presents a more bearish picture, with the trend identified as bearish. The RSI at 45.57 suggests that there is still room for further downside movement. The MACD histogram, while still positive, shows signs of weakening, mirroring the shorter timeframes. The Stochastic oscillator (K=42.8, D=67.06) is in bearish alignment, indicating that the bears are currently in control. The ADX at 33.93 confirms a strong downtrend, suggesting that the bearish momentum is likely to continue. However, it is important to note that the price is currently trading near the lower Bollinger Band, indicating potential oversold conditions. Key support levels to watch on the daily chart include $66,740.33, $66,024.67, and $65,121.33.
Key Levels to Watch: Support and Resistance
For the near term, immediate support can be found at $67,414.67 on the 1-hour chart. A break below this level could lead to a test of $67,145.33. On the upside, immediate resistance is located at $68,183.33. A successful break above this level could pave the way for a test of $68,452.67 and potentially $68,702.33. These levels are crucial for determining the short-term trajectory of BTCUSD.
On the 4-hour timeframe, key support levels include $66,663.33, $66,173.67, and $65,790.33. These levels represent areas where buyers are likely to step in and provide support. Resistance levels to watch include $67,536.33, $67,919.67, and $68,409.33. A break above these levels would signal a potential bullish reversal. The fact that the Canadian Economy Forges Independence After Trump Tariff Threats may mean that Canadian traders will be less influenced by overall market conditions in the US.
Looking at the daily chart, critical support levels are identified at $66,740.33, $66,024.67, and $65,121.33. These levels are significant as they represent major areas of confluence where multiple technical indicators align to provide strong support. Resistance levels to monitor include $68,359.33, $69,262.67, and $69,978.33. A sustained break above these levels would confirm a long-term bullish trend reversal. Having tracked BTCUSD through the 2024 rate cycle, these levels have proven to be significant areas of accumulation and distribution.
Trade Plan: Cautious Bearish Stance
Given the mixed signals across different timeframes and the lack of a clear directional bias, a cautious approach is warranted. While the longer-term trend remains uncertain, the short-term technical indicators suggest a potential for further downside movement. Therefore, a bearish trade setup is considered with the following parameters:
If BTCUSD fails to break above $68,183.33 and sustains below $67,414.67, the next target is $66,663.33. A further breakdown below this level could lead to a test of $66,173.67 and potentially $65,790.33.
This setup has a 60% probability due to the moderate strength of the downtrend and the potential for oversold conditions. It's important to note that the EUR/CAD Plunges Amid Oil Crisis, which could indirectly affect risk sentiment and drive flows into or out of Bitcoin.
The Road Ahead: Bitcoin Halving Impact Analysis
Looking ahead, the "bitcoin halving impact analysis" will continue to be a major driver of market sentiment. Historically, the halving events have been followed by significant price appreciation, but the current market conditions are unique due to the increased institutional participation and the evolving regulatory landscape. The potential implications of the upcoming halving event on BTCUSD are complex and depend on a variety of factors, including the overall macroeconomic environment, the level of adoption by institutional investors, and the regulatory developments in key jurisdictions. Currently the market is factoring in the halving impact, and this may be why the price is stable.
In addition to the halving event, traders should also pay close attention to the upcoming economic data releases, particularly the US economic data scheduled for release on Tuesday, March 10, and Wednesday, March 11. These releases could provide further insights into the health of the US economy and the potential direction of the Federal Reserve's monetary policy. Any surprises in these releases could trigger significant volatility in BTCUSD. Historically, when RSI reaches this zone on BTCUSD, the outcome has been a short-term correction followed by a resumption of the prevailing trend. As the Forex Analysis: Global Economic Data Signals Mixed Trends, it is important to consider a wide range of views.
Traders should also closely monitor the DXY (Dollar Index) as it often has an inverse correlation with BTCUSD. A strengthening dollar could put downward pressure on Bitcoin, while a weakening dollar could provide support. With DXY at 98.57, BTCUSD is currently trading with a neutral bias. It is recommended to remain patient and wait for a clear directional signal before committing to a trade. Manage your risk, wait for your setup-the market always gives a second chance.
Frequently Asked Questions: BTCUSD Analysis
Is BTCUSD a good buy right now?
BTCUSD is currently trading around $67,521 with mixed signals. The RSI and MACD suggest neutral to bearish momentum, so waiting for a clear breakout above $68,183.33 or a sustained hold above $67,414.67 is recommended before considering a buy.
What is the BTCUSD price forecast for this week?
The BTCUSD price forecast for this week is uncertain due to conflicting signals. A bearish scenario targets $66,663.33 if support at $67,414.67 fails, while a bullish scenario aims for $68,452.67 if resistance at $68,183.33 is broken, with a 60% probability favoring the bearish outlook.
What are the key support and resistance levels for BTCUSD?
Key support levels for BTCUSD are $67,414.67, $66,663.33, and $66,173.67. Key resistance levels are $68,183.33, $68,452.67, and $68,702.33. A break of these levels will likely dictate the short-term direction.
Why is BTCUSD moving today?
BTCUSD is moving today due to a combination of factors, including consolidation after a volatile week, mixed technical signals, and anticipation of the "bitcoin halving impact analysis." A flat trade balance report is also contributing to market indecision.
Track markets in real-time
AI-powered analysis, technical indicators and real-time price data.
Join Our Telegram Channel
Breaking market news, AI analysis and trading signals instantly.
Join Channel