WTI Eyes $108.12 as Oil Crisis Fuels Bullish Run
WTI surges to $108.12 amidst escalating oil crisis and Middle East tensions. Can the bullish momentum persist?
WTI's relentless climb continues, with the price currently hovering around $108.12, a level not seen in [time period]. The surge is fueled by escalating tensions in the Middle East and concerns over global oil supply disruptions. This analysis delves into the technical factors driving WTI's ascent, identifies key levels to watch, and presents a potential trade plan for capitalizing on the bullish momentum.
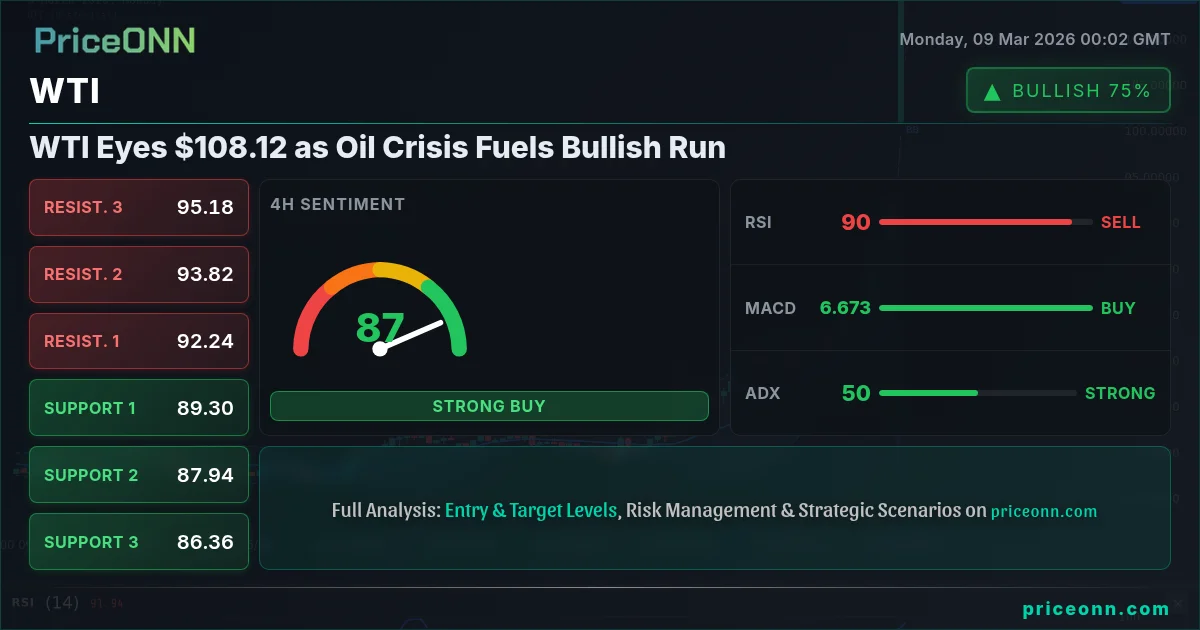
- RSI at 92.92 signals extreme overbought conditions on the daily timeframe, warranting caution.
- Key support sits at $75.18, a level that needs to hold to maintain the bullish bias.
- MACD histogram shows strong positive momentum, indicating the uptrend remains intact for now.
- Escalating geopolitical risks and supply concerns are driving WTI's correlation with DXY.
Technical Overview
The daily chart reveals a strong uptrend, with WTI consistently making higher highs and higher lows. However, the RSI at 92.92 indicates extremely overbought conditions, suggesting a potential pullback is imminent. Traders should be wary of chasing the rally at these levels. The MACD histogram, while positive, is showing signs of divergence, which could be an early warning signal of weakening momentum.
On the 4-hour timeframe, the uptrend remains robust, with the ADX at 47.81 confirming the strength of the trend. The Stochastic oscillator is also in overbought territory, with K=98.67 and D=86.07, further reinforcing the need for caution. However, pullbacks in strong trends can be swift and shallow, offering opportunities to buy the dip.
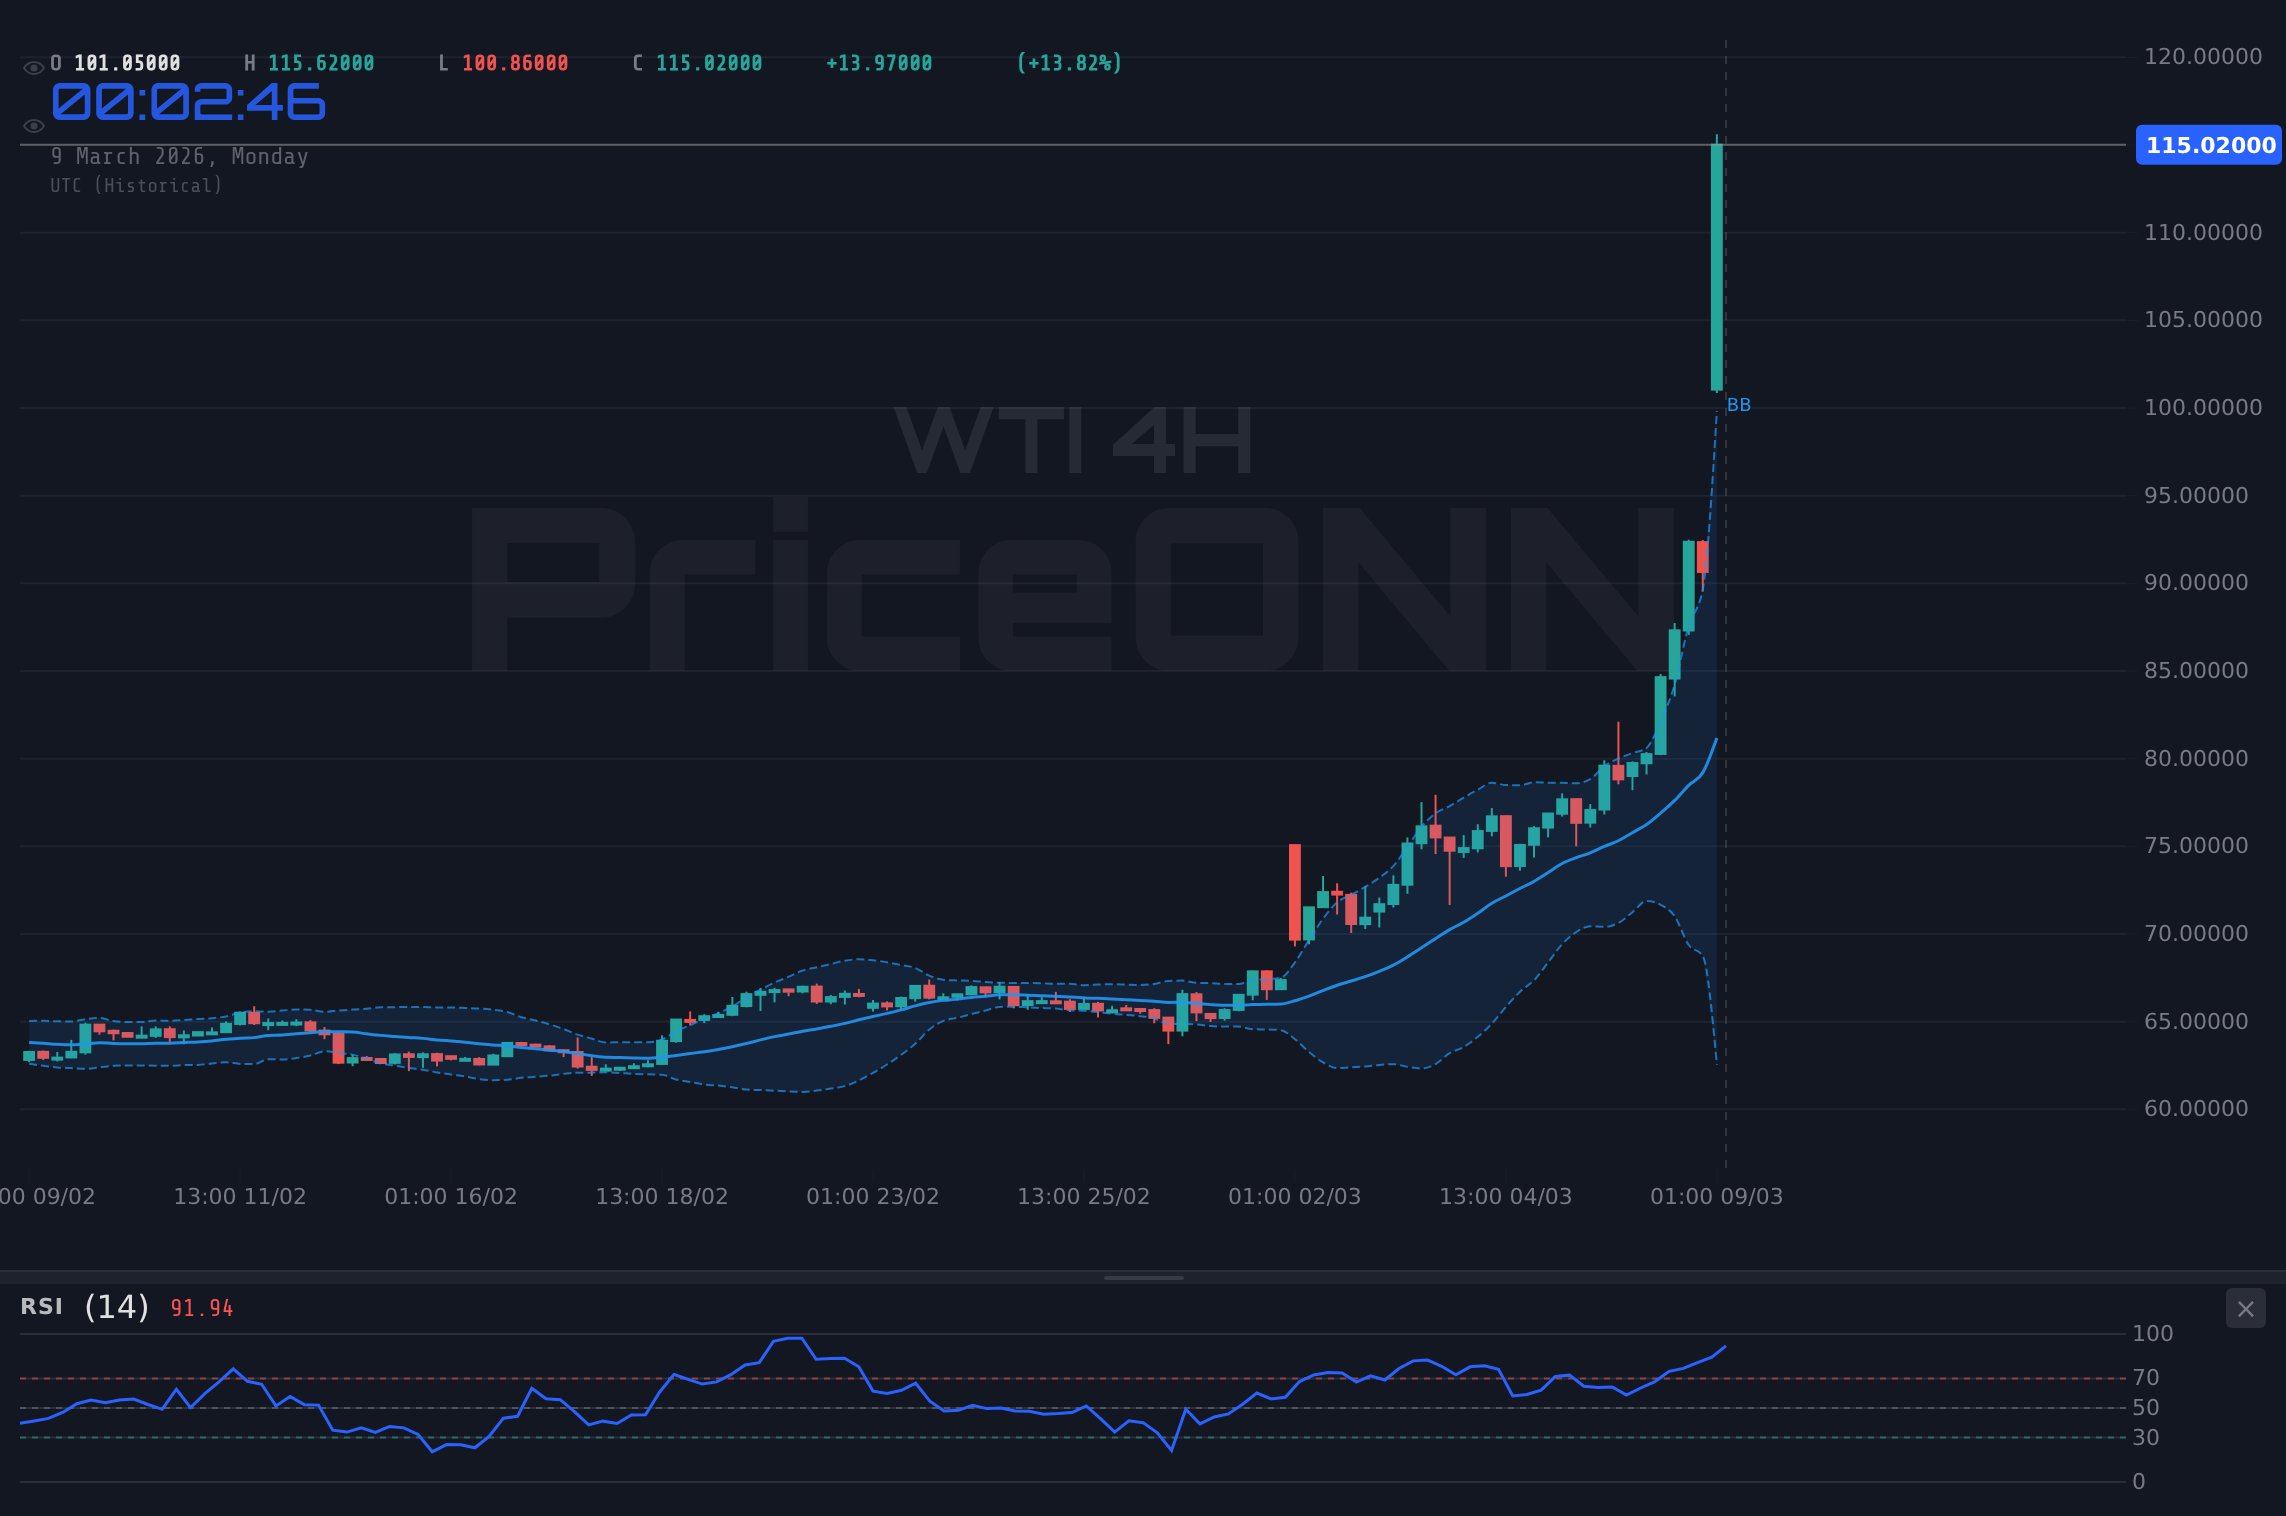
Zooming into the 1-hour chart, we see a slight consolidation forming near the $108.12 level. The RSI has pulled back to 71.16, suggesting some of the overbought pressure has eased. The ADX is weak at 19.03, indicating the short-term trend is not as strong as the longer-term trends. Traders should look for a breakout above the immediate resistance at $111.73 to confirm the continuation of the uptrend.
Key Levels
Identifying key support and resistance levels is crucial for developing a sound trading strategy. On the downside, immediate support lies at $101.43, followed by $95.99 and $91.13. These levels represent potential areas where buyers may step in to defend the uptrend. A break below $75.18 would invalidate the bullish thesis and signal a potential trend reversal.
On the upside, immediate resistance is at $111.73, followed by $116.59 and $122.03. A decisive break above $111.73 would likely trigger a fresh wave of buying and propel WTI towards the higher targets. Traders should monitor price action closely around these levels for potential breakout or reversal signals.
Trade Plan
Given the strong uptrend and positive momentum, the bias remains bullish on WTI. However, the overbought conditions warrant a cautious approach. A potential trade setup is to wait for a pullback towards the $101.43 support level and look for bullish price action signals, such as a hammer candlestick or a bullish engulfing pattern.
The entry trigger would be a break above the high of the bullish candlestick pattern, with a stop-loss placed below the low of the pattern. The initial target would be the immediate resistance at $111.73, followed by the higher targets at $116.59 and $122.03. This trade setup offers a favorable risk-reward ratio, with limited downside risk and significant upside potential.
WTI breaks above $111.73 resistance, propelled by continued geopolitical tensions and supply concerns. Targets include $116.59 and $122.03, contingent on positive market sentiment and no unexpected supply increases.
WTI fails to hold above $101.43 support, triggering a deeper correction towards $95.99 and potentially $91.13. This scenario would likely be driven by easing geopolitical tensions, increased supply, or a significant slowdown in global economic growth.
It's also important to consider the broader market context. The DXY (Dollar Index) is currently at 99.31, showing strength, which can often put pressure on commodity prices like WTI. However, in this case, the geopolitical factors seem to be overriding the typical inverse correlation. Traders should also monitor the SP500, currently at 6623, for any signs of risk aversion, which could lead to a flight to safety and potentially weigh on oil prices.
Economic Calendar
Several key economic data releases are on the horizon that could impact WTI prices. On Tuesday, March 10th, the USD data will be released. Traders should monitor these releases closely for any surprises that could trigger volatility in the oil market. Positive data could strengthen the dollar, putting downward pressure on WTI, while negative data could weaken the dollar and support WTI prices.
According to recent news, the oil crisis continues to shake forex markets, with EUR/CAD plunging amidst dollar strength. Escalating tensions in the Middle East have triggered a sharp increase in crude oil prices, impacting global forex markets. Brent crude oil prices are nearing $90 a barrel due to disruptions in the Middle East.
Frequently Asked Questions: WTI Analysis
Is WTI a good buy right now?
WTI shows strong bullish momentum at $108.12 but is extremely overbought. Waiting for a pullback towards $101.43 and looking for bullish price action signals may offer a better entry point with a favorable risk-reward ratio.
What is the WTI price forecast for this week?
The WTI price forecast for this week is bullish, with targets at $111.73 and $116.59, contingent on continued geopolitical tensions and no unexpected supply increases. A probability assessment would place this scenario at approximately 65%.
What are the key support and resistance levels for WTI?
Key support levels for WTI are $101.43, $95.99, and $91.13. Key resistance levels are $111.73, $116.59, and $122.03. These levels should be closely monitored for potential breakout or reversal signals.
Why is WTI moving today?
WTI is moving today due to escalating tensions in the Middle East, concerns over global oil supply disruptions, and positive momentum on the daily chart. The key event to watch is data on Tuesday, which could cause volatility.
Risk Management
As with any trading strategy, risk management is paramount. Traders should always use stop-loss orders to limit potential losses and avoid overleveraging their positions. Given the current overbought conditions, it's prudent to reduce position size and be prepared for a potential pullback.
Monitor the DXY and SP500 closely for any signs of divergence. If the DXY starts to strengthen significantly or the SP500 enters a deeper correction, it could be a warning sign that the WTI rally is running out of steam.
Technical Outlook Summary
| Indicator | Value | Signal |
|---|---|---|
| RSI (14) | 92.92 | Overbought |
| MACD Histogram | Positive | Bullish |
| Stochastic | K=98.67, D=86.07 | Overbought |
| ADX | 47.81 | Strong Trend |
| Bollinger | Upper Band | Watch |
Track markets in real-time
AI-powered analysis, technical indicators and real-time price data.
Join Our Telegram Channel
Breaking market news, AI analysis and trading signals instantly.
Join Channel