This past week on the BTCUSD chart has been characterized by a distinct lack of directional conviction, with the price largely consolidating around the crucial $62,515 mark. While the major indices like the S&P 500 and Nasdaq showed some upward momentum, driven perhaps by cooling economic data and shifting Federal Reserve rate hike expectations, Bitcoin has remained stubbornly range-bound. This period of relative calm, however, is often a precursor to significant price action. The question on every trader’s mind is whether this consolidation is building energy for a powerful breakout or if we're destined for another week of choppy, directionless trading. Understanding the interplay between Bitcoin's unique market dynamics, broader macroeconomic influences, and the technical levels that have held firm is key to navigating the coming days. We've seen significant shifts in correlation with traditional markets recently, and this weekend's analysis aims to dissect these relationships and prepare you for the potential moves ahead.
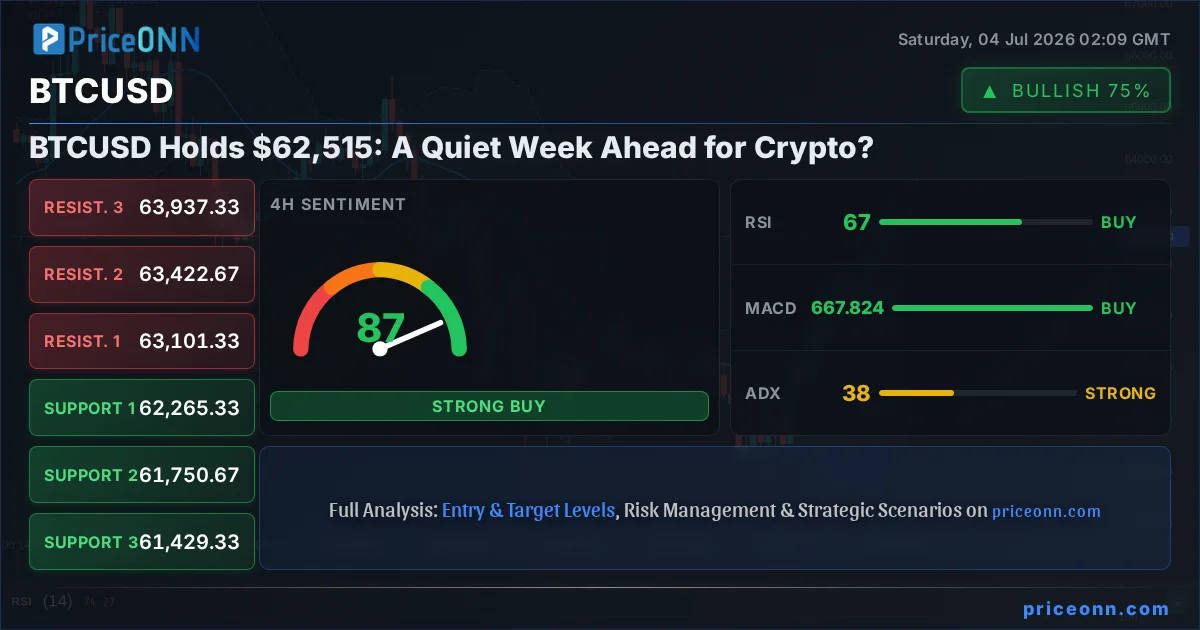
- BTCUSD is currently trading at $62,515.00, showing consolidation after a volatile period.
- Key support is holding around $61,251, while resistance is being tested near $62,908.
- The RSI(14) at 61.54 on the 1H chart indicates upward momentum without being overbought, suggesting room for further gains if key levels are breached.
- The ADX at 40 on the 1H timeframe signifies a strong uptrend, but the Stochastic K/D crossover suggests caution.
- Correlation analysis shows BTCUSD movements are increasingly influenced by DXY and equity market sentiment, moving away from pure crypto-specific drivers.
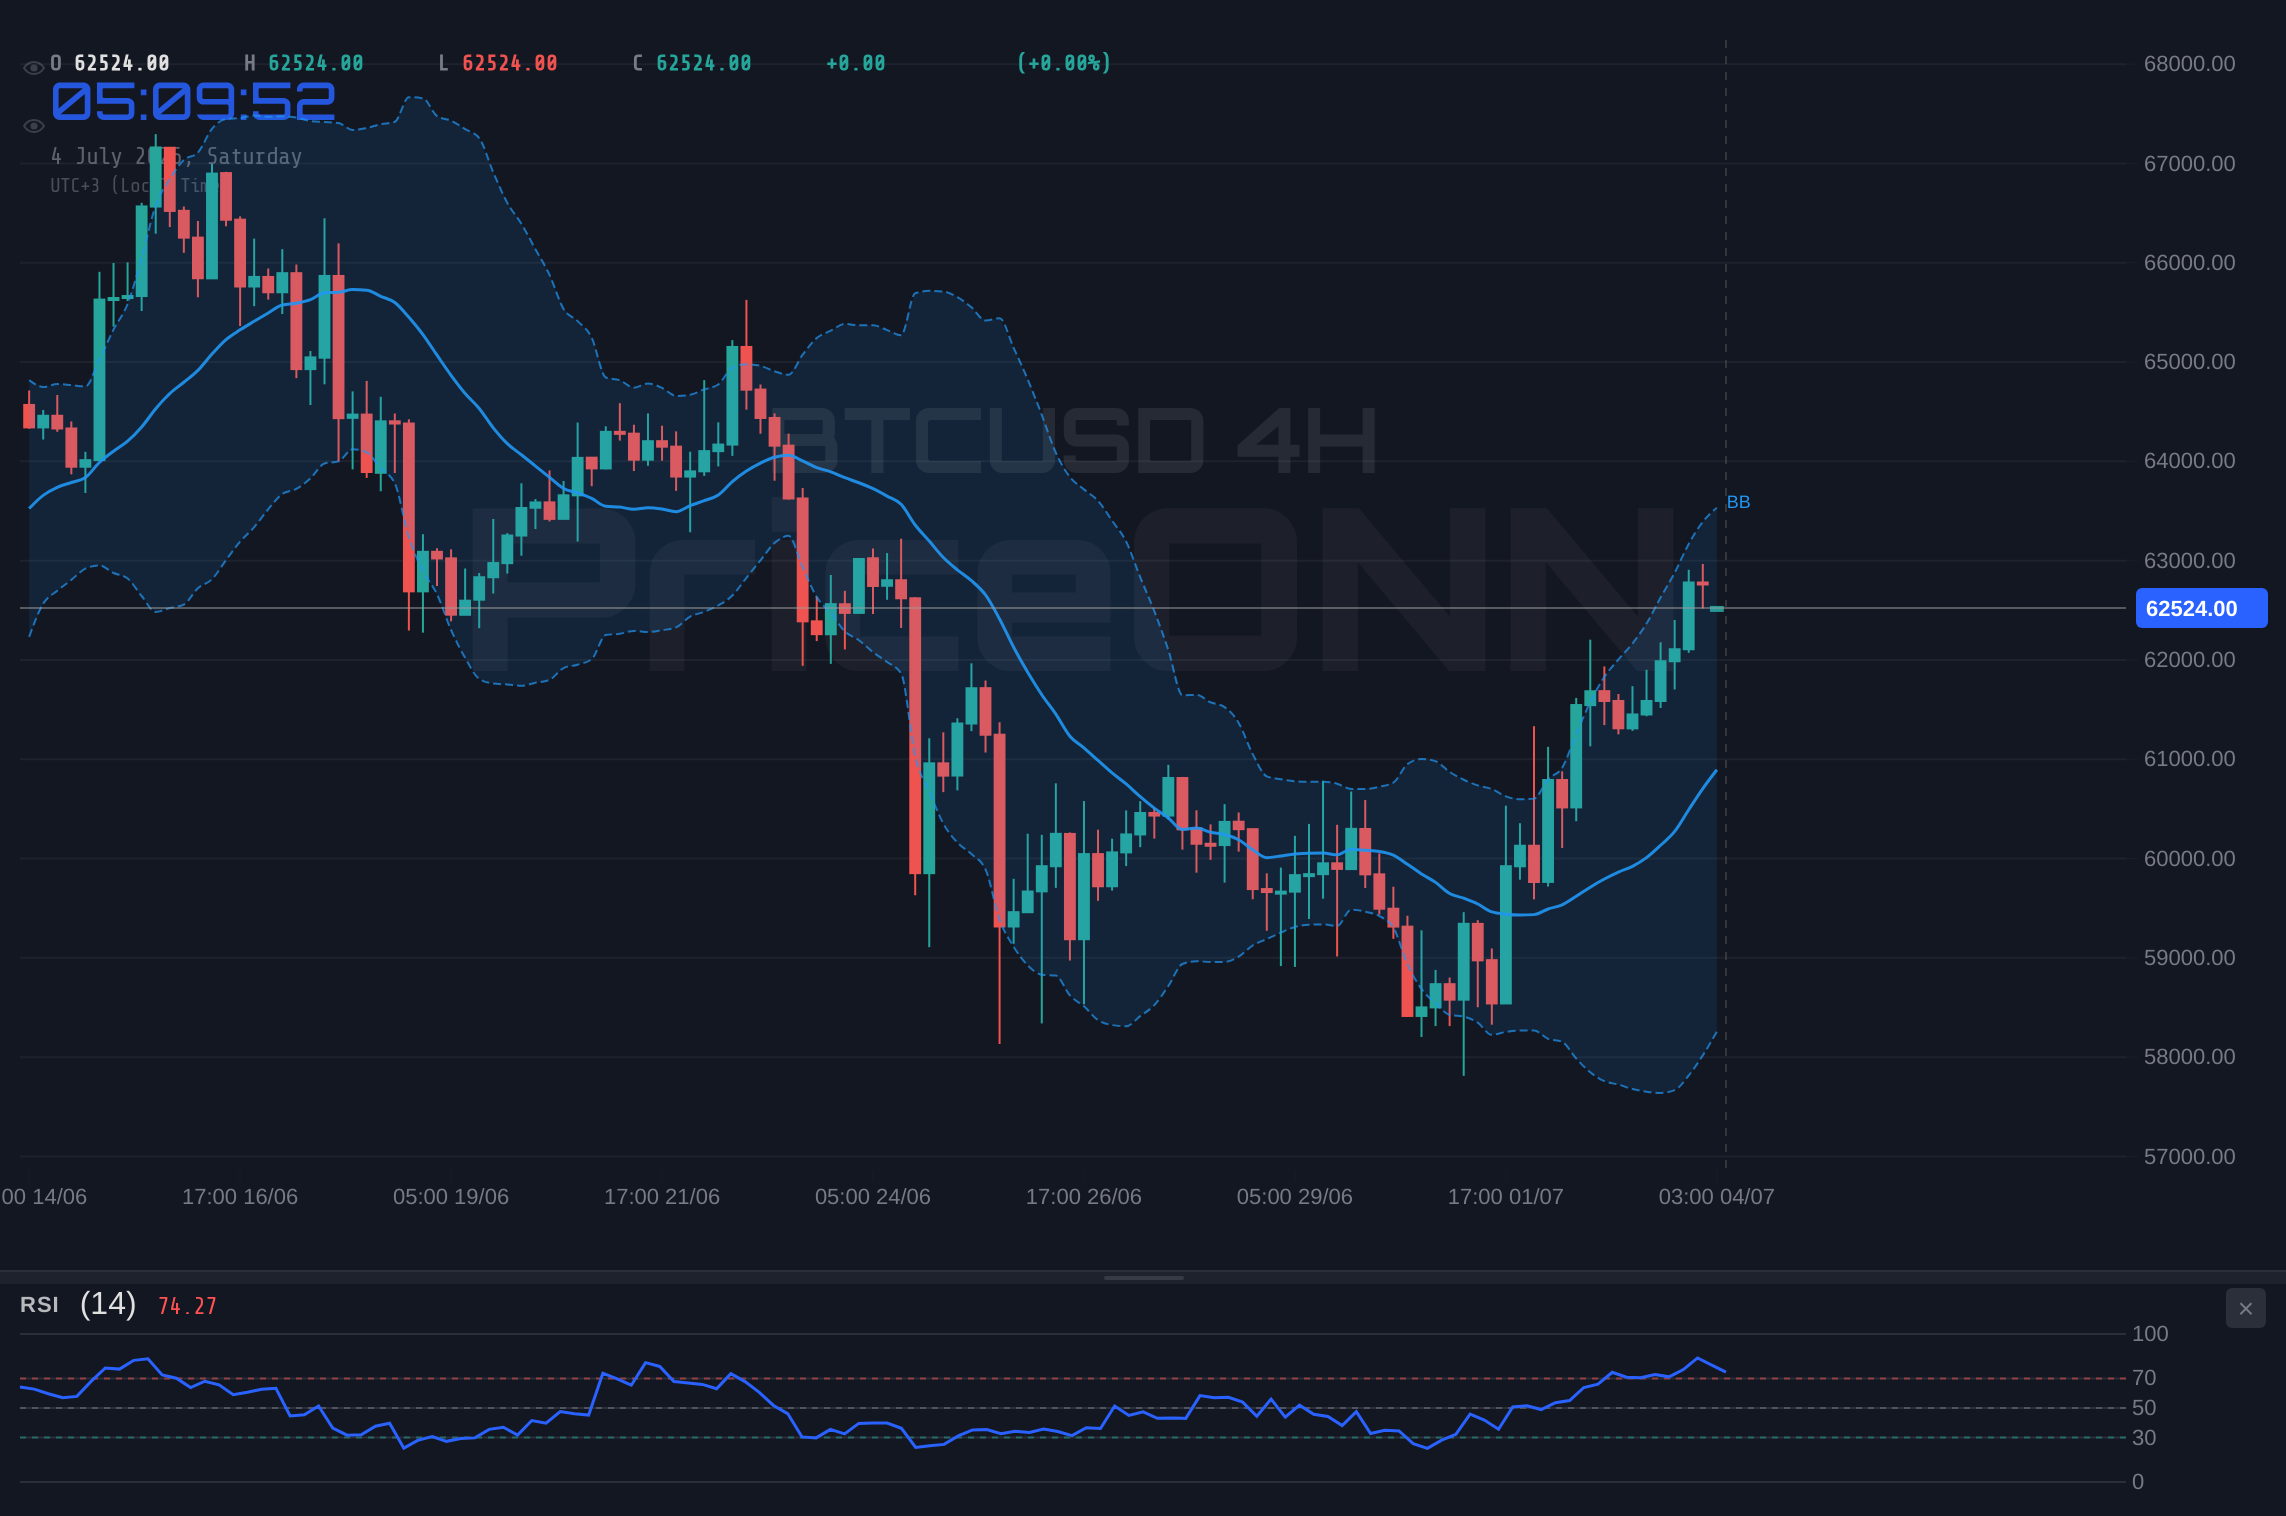
The trading week concluded with Bitcoin hovering around $62,515, a price point that has become a battleground between bulls and bears. After a period of sharp gains, the cryptocurrency market has entered a phase of consolidation. This sideways movement is not unusual; it often occurs after significant price swings as market participants assess the next move. The fact that BTCUSD has managed to hold above the $61,251 support level on the 1-hour chart is a positive sign for the bulls. However, the inability to decisively break through the $62,908 resistance suggests that upward momentum is currently stalled. This creates a classic range-bound scenario, where price action within these boundaries will be crucial for determining the next directional bias. Traders are keenly watching for any catalysts that could break this stalemate, whether they originate from within the crypto ecosystem or from the broader financial markets.
Looking at the multi-timeframe analysis, the picture becomes clearer, albeit complex. On the 1-hour chart, the ADX at 40 indicates a strong trend is in play, which is generally positive. However, this is counterbalanced by the Stochastic oscillator, where the K line is below the D line, suggesting a potential pullback or a period of weaker momentum. The RSI(14) is sitting at 61.54, which is in neutral territory but leaning towards bullish, indicating there's still room for prices to climb before hitting overbought conditions. This mixed signal on the shorter timeframe highlights the indecision currently plaguing the market. On the 4-hour chart, the trend strength remains high at 100%, with an RSI of 66.37, still within the comfortably bullish zone. The Stochastic here is in overbought territory (K=85.83, D=82.16), which typically signals a potential reversal or at least a pause in the rally. The daily chart, however, paints a more cautious picture. The trend strength is still high at 92%, but the RSI has dipped to 47.58, signaling a bearish inclination. This divergence across timeframes is precisely why we're seeing this tight consolidation. The market is digesting conflicting signals and waiting for clarity.
Navigating the Consolidation: What Different Traders Should Watch
For scalpers operating on very short timeframes, the $62,515 pivot point is paramount. They will be looking for quick trades within the established range, aiming to capture small profits from bounces off the $61,251 support or rejections from the $62,908 resistance. The key here is high-volume, low-spread environments, which are scarce during this current flat week. They need to be extremely nimble, paying close attention to the Stochastic and RSI on the 15-minute or 5-minute charts for immediate entry and exit signals. A sharp spike in volume accompanying a move towards either support or resistance could signal an imminent breakout, but scalpers must be ready to exit just as quickly if the move fails. The risk is high in such choppy conditions, and tight stop-losses are non-negotiable. Any sustained move below $61,251 or above $62,908 would likely trigger a wave of short-term trading activity, but for now, it's about managing risk within the defined range.
Swing traders, who typically hold positions for days to weeks, are in a more patient position. They are likely waiting for a clearer signal from the daily or 4-hour charts. The current range presents a challenge: entering at support and exiting at resistance offers a decent risk-reward ratio, but the potential for a breakout or breakdown looms. A confirmed break above $62,908, especially on significant volume and with bullish confirmation from indicators like MACD crossing bullishly on the 4-hour chart, would be a strong signal to enter long positions. Conversely, a decisive close below $61,251, confirmed by bearish divergence on the RSI and a MACD crossover to the downside, would signal an opportunity to enter short positions targeting lower support levels like $58,511. The ADX on the 4-hour chart at 38.46 indicates a strong trend is present, so whichever direction the breakout occurs, it could be swift and significant. Swing traders must resist the urge to trade the range excessively and instead wait for the market to provide a higher-probability setup.
Long-term investors, often referred to as 'hodlers,' are likely less concerned with the day-to-day price action around $62,515. Their focus is on the bigger picture: the underlying fundamentals, the long-term adoption trends, and the macro environment. They are probably viewing this consolidation as a healthy period of accumulation or a brief pause before the next leg up in a larger bull cycle. The daily chart's RSI at 47.58, while showing a bearish inclination on this timeframe, is still far from indicating a major trend reversal. Historically, periods of consolidation like this have often preceded significant upward moves, especially in the context of increasing institutional interest and the potential for more spot Bitcoin ETF inflows. For these investors, the key is to monitor on-chain metrics such as active addresses, whale movements, and exchange flows. A significant increase in active addresses or large inflows into cold storage wallets would be more bullish signals than any short-term price fluctuation. They are likely accumulating on dips towards the lower support levels, viewing the current price as a potentially attractive entry point for a multi-year investment thesis.
The Macroeconomic Crosscurrents: DXY, Bonds, and Equities
The performance of Bitcoin cannot be viewed in isolation. Its correlation with broader financial markets, particularly the US Dollar Index (DXY) and major equity indices like the S&P 500 and Nasdaq, has become increasingly pronounced. This past week, we observed a mixed performance in these correlated assets. The DXY, currently trading around 100.85, showed some weakness, dipping slightly. Historically, a weaker dollar often correlates with a stronger Bitcoin price, as it can signal reduced risk aversion and increased demand for riskier assets. However, this relationship has not been perfectly consistent. The S&P 500 and Nasdaq, despite some upward movement on Friday, have shown signs of volatility, reflecting uncertainty about the Federal Reserve's next move. Cooling US jobs data has indeed lowered the odds of aggressive rate hikes, which is generally positive for risk assets. If the Fed signals a pause or a pivot, it could unleash significant capital into markets like Bitcoin. Conversely, if inflation proves stubborn and forces the Fed to maintain a hawkish stance, we could see renewed pressure on BTCUSD, potentially testing those lower support levels.
The bond market also plays a crucial role. Treasury yields, which have been a significant driver of risk asset sentiment, remain a key focus. While specific yield data wasn't provided in the live feed, general market sentiment suggests that any indication of higher-for-longer interest rates would be a headwind for growth assets like Bitcoin. Conversely, a decline in yields, perhaps signaling an anticipated end to the rate-hiking cycle, could provide a tailwind. We need to watch for any official statements from Federal Reserve officials or upcoming economic data releases that might influence yield expectations. For instance, any signs of sticky inflation, despite the softer jobs data, could push yields back up, creating a challenging environment for BTCUSD. The interplay between the dollar's strength, equity market performance, and bond yields creates a complex macroeconomic backdrop that significantly influences Bitcoin's price action. This week's consolidation might be a direct reflection of this uncertainty in the macro landscape.
Oil prices, while not directly correlated with Bitcoin in the same way as DXY or equities, serve as a barometer for inflation expectations and geopolitical risk. Brent crude is trading around $71.97 and WTI around $69.10. If oil prices were to surge significantly due to escalating geopolitical tensions in the Middle East or supply disruptions, it could reignite inflation concerns. This, in turn, might force central banks to maintain tighter monetary policies, which would be a negative for Bitcoin. Currently, oil prices appear to be in a relatively stable, albeit volatile, range. However, any significant geopolitical event could quickly shift this dynamic. For Bitcoin traders, monitoring oil prices is part of a broader risk-assessment strategy, understanding how energy market movements can ripple through global inflation expectations and, consequently, monetary policy decisions. The current price action in oil doesn't present an immediate threat, but it's a factor to keep on the radar.
On-Chain Insights: The Hidden Story Behind the Price Action
While the price action around $62,515 has been relatively muted, the on-chain data often tells a different story. This is where we can find subtle clues about the underlying health of the Bitcoin network and the sentiment of its participants. Active addresses provide a measure of network usage. If active addresses are increasing while the price is consolidating, it suggests growing adoption and potentially underlying strength. Conversely, a decline in active addresses during this period could signal waning interest. Whale movements – large holders accumulating or distributing – are also critical. Significant inflows to exchanges from whale wallets could indicate selling pressure, while large outflows to cold storage suggest accumulation and a long-term bullish conviction. These movements, often invisible on the price chart, can be leading indicators of future price trends.
Exchange flows are another vital on-chain metric. Net outflows from exchanges to cold wallets generally indicate that investors are moving their Bitcoin to secure, long-term storage, which is a bullish sign. Conversely, net inflows onto exchanges can signal an intention to sell, either for profit-taking or to exit positions. During this consolidation phase, observing these flows is crucial. If we see significant accumulation (outflows) even as the price struggles to break resistance, it reinforces the bullish thesis for the long term. If, however, we witness a steady stream of inflows, it might suggest that underlying selling pressure is building, and a breakdown from the current range becomes more probable. Hash rate, a measure of the network's computing power, also provides insight into miner sentiment. A high or increasing hash rate generally indicates confidence in the network's future profitability, which is a net positive. A sustained drop in hash rate could signal miners are struggling or losing faith, a bearish undertone.
The DeFi and NFT ecosystems, while sometimes seen as separate from Bitcoin's price action, can also offer indirect insights. Developments in layer-2 solutions, new protocol launches, or significant shifts in Total Value Locked (TVL) within the broader crypto market can influence overall sentiment. If the DeFi space is booming with innovation and attracting significant capital, it can create a positive halo effect for Bitcoin. Similarly, the performance of major altcoins, which often exhibit higher beta to Bitcoin (meaning they move more dramatically), can provide clues. If leading altcoins like Ethereum (currently trading at $1,747.74) are showing strength and breaking out of their own consolidations, it could suggest a broader market appetite for risk that might eventually lift BTCUSD. However, if altcoins are lagging or showing weakness, it might indicate a more cautious or even risk-off sentiment within the crypto space, which would be a bearish signal for Bitcoin.
Regulatory news continues to be a wildcard for the entire crypto market. Any significant developments, whether positive (like clearer guidelines for ETFs) or negative (like new restrictions or enforcement actions), can cause sharp price movements. While no major regulatory news directly impacted BTCUSD this past week, the ongoing discussions around classification of digital assets and the potential for new legislation in major economies remain a background factor. Investors and traders must remain attuned to these developments, as they can quickly shift market sentiment and trigger significant volatility. The general trend towards greater regulatory clarity in some jurisdictions, coupled with institutional adoption, remains a long-term bullish narrative, but short-term regulatory uncertainty can still create headwinds.
Historical Parallels: What Past Consolidations Tell Us
History offers valuable lessons for understanding current market behavior. We’ve seen Bitcoin undergo numerous consolidation phases throughout its history, often preceding major trend changes. For instance, after the 2021 bull run peak, Bitcoin entered a prolonged period of sideways trading for months before the subsequent bear market truly took hold. Conversely, following significant bottoms, periods of consolidation have often served as accumulation zones, laying the groundwork for powerful rallies. The current price action around $62,515 bears some resemblance to periods of consolidation seen in late 2020 or mid-2023, where price action was tight, and key indicators often provided conflicting signals. During those times, patience was rewarded. Traders who waited for a decisive breakout above resistance or breakdown below support, confirmed by volume and indicator convergence, were often in a better position than those who tried to trade every minor fluctuation within the range.
One specific historical parallel that might be relevant is the consolidation phase that occurred in early 2024, leading up to and following the approval of spot Bitcoin ETFs in the United States. After an initial surge, Bitcoin entered a period of sideways movement as the market digested the news and awaited further inflows. During that time, the RSI often flickered around the 50-60 level, and MACD crossovers were frequent but not always sustained. The breakthrough eventually came when institutional demand, evidenced by consistent ETF inflows, provided the necessary buying pressure. The current situation, with BTCUSD holding $62,515, could be a similar prelude. If institutional adoption continues to grow, perhaps through further ETF inflows or corporate treasury allocations, this consolidation could resolve to the upside. However, if macroeconomic headwinds intensify or regulatory concerns resurface, a breakdown similar to what was seen in previous bear market phases could occur. The key is to identify the confluence of technical and fundamental factors that will ultimately drive the next major move.
Trade Scenarios: Charting the Path Forward
Bullish Scenario: Breaking the Chains
40% ProbabilityNeutral Scenario: Range-Bound Grind
35% ProbabilityBearish Scenario: The Support Test
25% ProbabilityFrequently Asked Questions: BTCUSD Analysis
What happens if BTCUSD breaks decisively above the $62,908 resistance level this week?
A sustained break above $62,908, confirmed by increased trading volume and bullish signals on the 4-hour MACD, would likely trigger a bullish scenario. This could open the door for a move towards the $63,937 and potentially the $65,279 resistance levels. Such a move would indicate that the consolidation phase has concluded to the upside.
Should I buy BTCUSD at current levels of $62,515 given the mixed signals on the 1H chart?
Buying at current levels carries risk due to the conflicting indicators. The 1H ADX at 40 suggests a strong trend, but the Stochastic K/D crossover warns of potential pullback. A more prudent approach would be to wait for confirmation: either a bounce from $61,251 support with bullish signals or a confirmed break above $62,908 resistance. Risk management dictates waiting for a clearer setup.
Is the RSI at 61.54 on the 1H chart a buy signal for BTCUSD right now?
An RSI of 61.54 on the 1-hour chart is in the neutral-to-bullish zone, indicating upward momentum but not yet overbought conditions. While it suggests potential for further gains, it's not a standalone buy signal. It needs to be combined with other confirmations, such as a bullish MACD crossover or a break of resistance, to be considered a strong entry trigger.
How will the current DXY weakness and cooling US jobs data affect BTCUSD this week?
The DXY's weakness and softer US jobs data are generally supportive for BTCUSD, as they reduce the likelihood of aggressive Fed rate hikes. This macro environment could encourage a risk-on sentiment, potentially driving Bitcoin higher. However, the actual impact depends on how these factors influence overall market sentiment and whether Bitcoin can overcome its own technical resistance levels.
Technical Outlook Summary
| Indicator | Value | Signal | Interpretation |
|---|---|---|---|
| RSI (14) | 61.54 | Neutral | Suggests room for gains before overbought. |
| MACD Histogram | +ve | Bullish | Positive momentum on 1H chart. |
| Stochastic | K:65.51, D:75.05 | Bearish Crossover | Suggests potential pullback on 1H. |
| ADX | 40.00 | Strong Trend | Indicates a strong trend on 1H timeframe. |
| Bollinger Bands | Middle Band Breakout | Bullish | Price holding above middle band on 1H. |
Key Levels
This consolidation phase around $62,515 presents a critical juncture for BTCUSD. While short-term indicators offer mixed signals, the broader trend remains positive, supported by increasing adoption and a potentially easing macroeconomic environment. Scalpers will seek quick wins within the range, swing traders await a decisive breakout or breakdown, and long-term investors view this as a potential accumulation period. The correlation with traditional markets, particularly the DXY and equities, remains a key factor to monitor. As we head into the next week, staying vigilant for shifts in volume, indicator confluence, and macro catalysts will be crucial for navigating these choppy waters. The market is building energy; the question is, in which direction will it unleash?
Disclaimer: This analysis is for informational purposes only and does not constitute financial advice. Trading cryptocurrencies involves significant risk, and you may lose your entire investment. Always conduct your own research and consult with a qualified financial advisor before making any investment decisions.
Track markets in real-time
AI-powered analysis, technical indicators and real-time price data.
Join Our Telegram Channel
Breaking market news, AI analysis and trading signals instantly.
Join Channel