As the dust settles from last week, Bitcoin (BTCUSD) finds itself in a precarious position, trading around the $62,610 mark. This level is proving to be a significant battleground, with both bulls and bears vying for control. The past week was a tapestry of conflicting signals: strong intraday rallies were often met with sharp pullbacks, and key support levels were tested but ultimately held, at least for now. This indecision paints a picture of a market grappling with its next directional move. From a technical standpoint, the confluence of indicators presents a complex puzzle, demanding a multi-faceted analysis to navigate the choppy waters ahead. The question on every trader's mind is whether the current consolidation is a prelude to a renewed upward surge or a precursor to a deeper correction. Understanding the nuances of the market structure, the sentiment, and the critical price points is paramount for making informed decisions in the coming days.
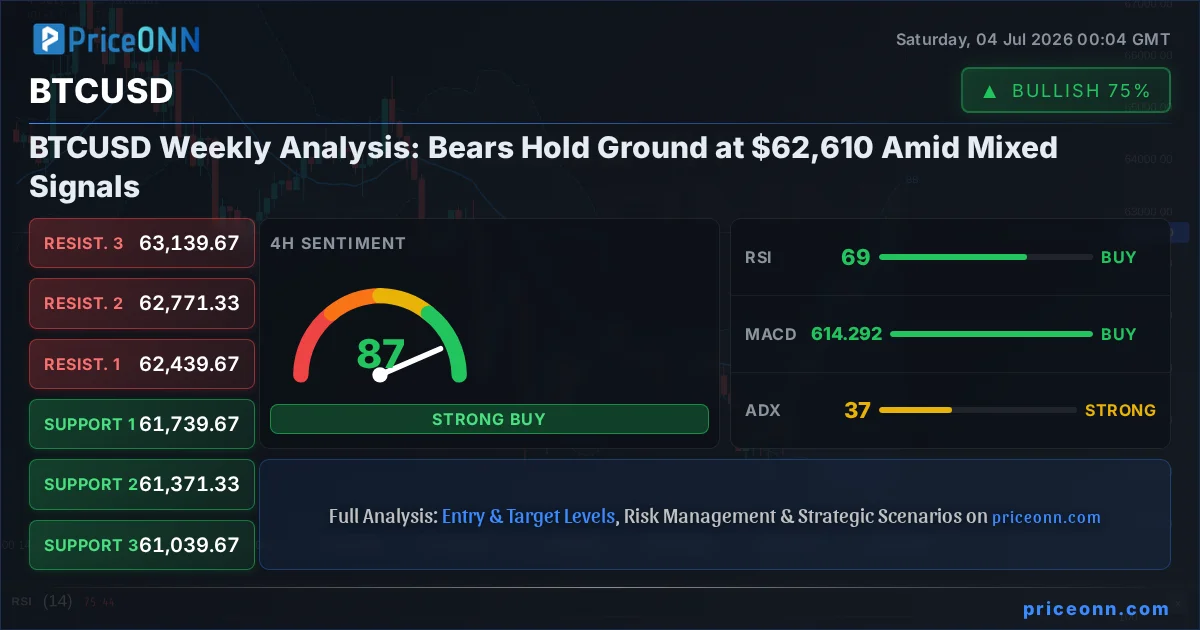
- Bitcoin's RSI at 67.2 signals growing upward momentum but remains in neutral territory, indicating room for further gains before becoming overbought.
- The critical support level for BTCUSD holds firm at $61,251, tested multiple times last week, while immediate resistance looms around $62,709.
- The MACD histogram shows positive momentum on the 1H chart, but divergence on the 4H chart suggests potential weakening of the bullish trend.
- Correlation with the DXY (Dolar Endeksi) at 100.85 suggests that a strengthening dollar could pressure Bitcoin, while softer US jobs data might offer some relief.
Navigating the Consolidation Zone: BTCUSD's Tightrope Walk
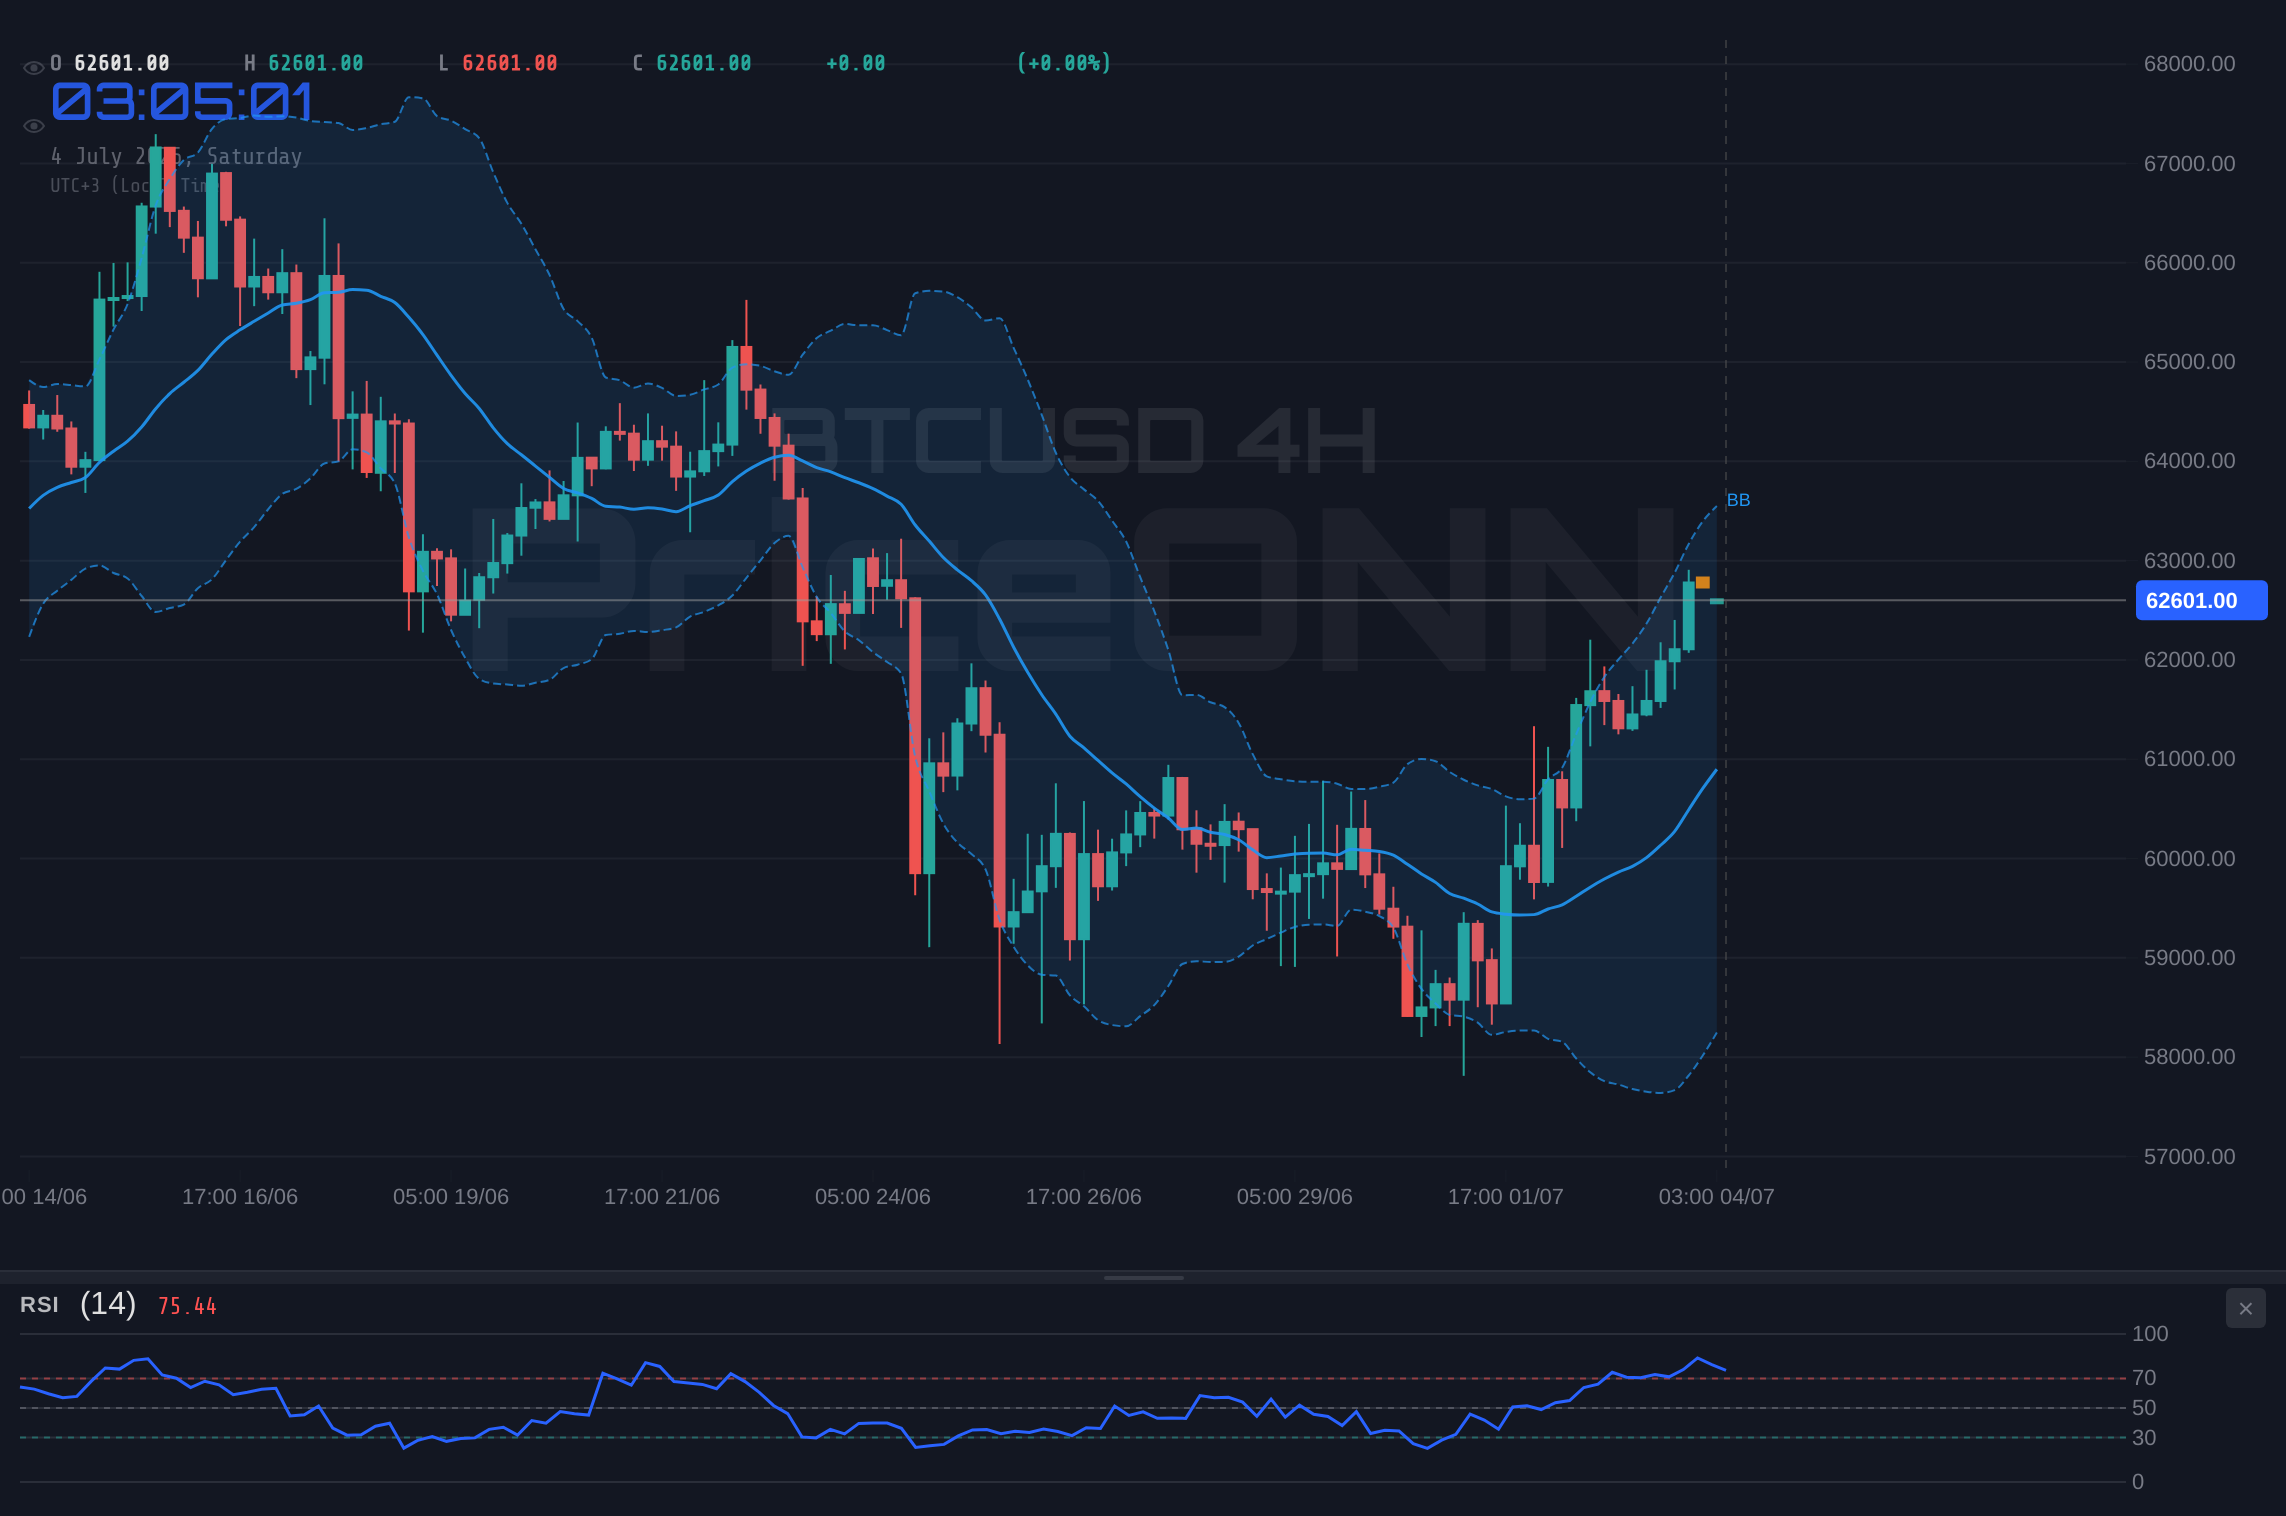
The past week has been characterized by a lack of clear direction for BTCUSD, hovering around the $62,610 level. While the daily chart shows a strong upward trend with an ADX of 34.29, shorter timeframes present a more nuanced picture. The 1-hour chart reveals a bullish trend with a strong ADX of 37.74, supported by a bullish RSI of 67.2 and a positive MACD histogram. This suggests short-term buying pressure. However, the 4-hour chart introduces a note of caution. Here, the ADX dips slightly to 37.26, still indicating a strong trend, but the RSI at 68.92 is nearing overbought territory, and the MACD is showing negative momentum with the histogram below the signal line. This internal conflict across timeframes highlights the current market indecision. Traders are caught between the persistent optimism of a bullish trend and the cautionary signals of potential overextension and waning momentum. The market seems to be waiting for a catalyst to break this stalemate, making the upcoming week crucial for determining the next significant price action.
The Bull's Roadmap: Charting a Path Above Resistance
For the bulls to regain decisive control, BTCUSD needs to convincingly break through immediate resistance levels and establish new higher ground. The 1-hour chart offers the most optimistic outlook, with a strong ADX of 37.74 and a generally positive technical setup. A sustained push above the immediate resistance at $62,709.33, followed by a break of the $62,837.67 level, would be the first critical step. If this upward momentum is sustained, the next psychological barrier at $63,000 would come into play, followed by the more significant resistance zone around $63,139.67 on the 4-hour chart. A break and hold above $63,139.67 would signal a potential continuation towards the $63,741.67 and $64,000 levels. The Stochastic indicator on the 1-hour chart, currently at K=73.3 and D=76.63, shows a slight bearish crossover, which would need to reverse and show renewed strength for a sustained rally. Similarly, the RSI, while still in neutral territory at 67.2, cannot afford to enter the overbought zone (above 70) without a clear breakout confirmation to avoid triggering profit-taking. The key here is volume confirmation; a significant surge in buying volume accompanying these price breaks would lend credibility to the bullish thesis, suggesting institutional interest is driving the move.
Where Bears Take Control: Testing the $61,000 Barrier
On the flip side, the bearish scenario hinges on the failure of key support levels to hold, potentially triggering a cascade of sell orders. The 4-hour chart provides the clearest indication of where bears might find their footing. The support levels at $61,739.67 and $61,371.33 are the first lines of defense. A decisive close below $61,371.33 on the 4-hour chart would be a significant bearish signal, indicating a loss of upward momentum and potentially initiating a move towards the $61,039.67 support. If this level also gives way, the market could rapidly descend towards the daily support at $60,049.33. The daily chart, while showing a strong uptrend on ADX (34.29), has an RSI of 47.92, suggesting room for a decline without immediately entering oversold territory. The MACD on the 4-hour chart, which is currently showing negative momentum, would need to confirm a bearish crossover to add conviction to this downside move. Stochastic indicators on both the 4-hour (K=88.88, D=81.16) and daily charts (K=66.23, D=32.72) are flashing overbought signals, which, if they turn downwards, could fuel a bearish reversal. The failure of BTCUSD to hold above $62,610 and subsequently break below the $61,251 weekly low would be the primary trigger for this bearish scenario, opening the door for further downside exploration.
The Waiting Game: Consolidation and Range-Bound Play
In the absence of a clear directional breakout, BTCUSD could remain locked in a consolidation pattern. This neutral scenario often occurs when conflicting signals across different timeframes create a stalemate. The current price action, hovering around $62,610, with immediate resistance at $62,709 and support at $61,251, defines a relatively tight trading range. The ADX readings across the charts, while generally indicating strong trends (ranging from 37.26 to 37.74 on shorter timeframes and 34.29 on the daily), are not at extreme levels that would guarantee a sustained move. A neutral outlook suggests that neither bulls nor bears have enough conviction to force a significant price shift. In this environment, scalpers and range traders might find opportunities by playing the boundaries of this established range. However, for swing and position traders, this period is often characterized by patience, waiting for a clear breakout signal above resistance or a breakdown below support. The Bollinger Bands on the 1-hour chart are above the middle band, suggesting a slight bullish bias within the range, but the Stochastic crossover on the same timeframe needs careful monitoring. The key for this scenario is the continued inability of price to decisively break either the support or resistance levels for a prolonged period, perhaps for several trading sessions.
The Most Likely Path: A Probabilistic Outlook
Weighing the technical indicators and recent price action, the most probable scenario for BTCUSD in the short to medium term appears to be a continued struggle within a defined range, with a slight bias towards the upside, but significant risk of a bearish reversal. The daily chart's underlying strength, indicated by the ADX at 34.29 and a bullish Stochastic signal, suggests that the long-term trend may still be intact. However, the conflicting signals on the 4-hour chart, particularly the RSI nearing overbought territory and the negative MACD momentum, cannot be ignored. This suggests that any upward move might be met with significant selling pressure as traders look to take profits or initiate short positions. Therefore, I assign a 55% probability to the consolidation scenario, where BTCUSD remains range-bound between $61,251 and $62,709, with potential for minor breaches. The bearish scenario, triggered by a break below $61,251, carries a 35% probability, given the current market structure and the potential for overbought conditions to correct. The purely bullish scenario, requiring a decisive break above $62,709 and sustained momentum, is assigned a lower probability of 10% in the immediate term, due to the conflicting signals and the lack of overwhelming confirmation.
Bearish Scenario: The Downside Risk
35% ProbabilityNeutral Scenario: The Waiting Game
55% ProbabilityBullish Scenario: The Upside Breakout
10% ProbabilityCorrelation and Macro Context: The Dollar's Shadow
While BTCUSD often trades with a degree of independence, its correlation with broader market sentiment and macroeconomic factors remains significant. The DXY (Dolar Endeksi) is currently hovering around 100.85, showing a slight downward bias on the 1-hour chart but a more pronounced bearish trend on the 4-hour chart. Historically, a strengthening dollar tends to put pressure on risk assets like Bitcoin, as it increases the cost of holding non-yielding assets and signals a potential shift towards safer investments. Conversely, a weaker dollar can provide a tailwind for Bitcoin. The recent US jobs data, which showed softer numbers, might contribute to a weaker dollar narrative by potentially lowering the odds of aggressive Fed rate hikes. This could indirectly support BTCUSD if the dollar weakens further. However, the geopolitical tensions in the Middle East, which often drive safe-haven demand for the dollar and gold, could counteract this effect. The WTI crude oil price, currently at $71.97, is showing a slight recovery, which can be seen as an inflation indicator. Elevated oil prices can fuel inflation concerns, potentially leading to tighter monetary policy expectations, which would be bearish for Bitcoin. The S&P 500 and Nasdaq are showing mixed signals, with the S&P 500 on the 1D chart exhibiting a bearish trend (ADX 47.51) despite a recent daily gain, while the Nasdaq 100 shows a neutral trend on the daily. This divergence in equity markets adds another layer of complexity, as Bitcoin's correlation with equities can fluctuate. A risk-off sentiment in equities, potentially triggered by geopolitical events or disappointing economic data, could lead to outflows from Bitcoin as well.
Key Triggers to Watch This Week
For traders and investors monitoring BTCUSD, several key events and technical levels will dictate the market's direction in the coming week. Firstly, the price action around the $61,251 support level is paramount. A sustained break below this level would invalidate the short-term bullish outlook and likely trigger significant selling pressure. Conversely, a decisive push and hold above the $62,709 resistance, particularly on increased volume, could signal a resumption of the upward trend. Secondly, keep a close eye on the DXY. If the dollar index continues its downward trajectory, especially below the 100.81 resistance on the 4H chart, it could provide a bullish catalyst for BTCUSD. Conversely, any signs of dollar strength, perhaps driven by geopolitical escalations or hawkish central bank rhetoric, could cap upside potential for Bitcoin. Thirdly, the upcoming economic data releases will be crucial. Any surprises in inflation or employment figures could dramatically shift market sentiment and Federal Reserve policy expectations, impacting risk assets. Finally, the RSI on the 4-hour chart is nearing overbought territory at 68.92. A reversal from this level, especially if coupled with a bearish MACD crossover, could signal a short-term pullback. Traders should be looking for confirmation – a break of key levels accompanied by corresponding volume and indicator alignment – before committing to significant positions.
| Indicator | Value | Signal | Interpretation |
|---|---|---|---|
| RSI (14) | 67.20 | Neutral | Approaching overbought, but still room to move up. |
| MACD Histogram | +0.55 (1H) / -0.21 (4H) | Bullish (1H) / Bearish (4H) | Conflicting momentum signals across timeframes. |
| Stochastic %K | 73.30 (1H) / 88.88 (4H) | Bearish Crossover (1H) / Overbought (4H) | 1H shows potential reversal, 4H signals caution. |
| ADX | 37.74 (1H) / 37.26 (4H) | Strong Trend | Indicates significant trend strength, but direction is unclear from this alone. |
| Bollinger Bands | Mid Band Breakout (1H/4H) | Bullish Bias | Price trading above the middle band suggests upward pressure. |
The Market's Pulse: Sentiment and Broader Correlations
Beyond the immediate technicals, understanding the broader market sentiment and correlations is crucial for a comprehensive BTCUSD outlook. Last week saw some cooling in US labor market data, which, while potentially easing inflation concerns and reducing the likelihood of aggressive Fed rate hikes, also signals a potential slowdown in economic growth. This duality creates uncertainty. A weaker dollar, a potential consequence of such data, could theoretically benefit Bitcoin. However, geopolitical risks, particularly in the Middle East, continue to cast a shadow, potentially driving safe-haven flows into the dollar and gold, thereby counteracting any dollar weakness. Brent crude oil trading around $71.97 and WTI at $69.10 are showing modest gains, hinting at persistent inflationary pressures or supply-side concerns, which could complicate the inflation narrative and influence central bank policy. Equity markets present a mixed picture: the S&P 500 shows a bearish trend on the daily chart despite recent gains, while the Nasdaq 100 exhibits a neutral trend. This lack of clear direction in major stock indices reflects the broader market's hesitation. For BTCUSD, this means it's operating in an environment where risk appetite can shift rapidly. Institutional flows, though not directly visible in the provided data, are often guided by these macro trends. If risk aversion grows, we could see outflows from speculative assets like Bitcoin, regardless of its internal technical setup. Conversely, any sign of sustained dollar weakness or a significant easing of geopolitical tensions could trigger a flight to risk assets, potentially benefiting BTCUSD.
A Trader's Perspective: What to Watch Next
From a trader's perspective, the current environment demands vigilance and discipline. The $62,610 price point is a psychological anchor, but the real action lies in the defined support and resistance levels. The critical support at $61,251 needs to hold. A failure here opens the door to the bearish scenario, targeting $60,049 and potentially lower. On the upside, a convincing break above $62,709, ideally with increasing volume and positive confirmation from the 4-hour RSI moving away from overbought territory, could signal a move towards $63,139. The immediate focus should be on how price reacts to these levels over the next 24-48 hours. The conflicting signals between the 1-hour and 4-hour charts suggest that short-term traders might find opportunities within the range, but longer-term positions should await clearer directional confirmation. The interplay between the DXY and BTCUSD will also be a key narrative to follow. If the dollar weakens significantly, it could provide the necessary tailwind for Bitcoin to attempt a breakout. Conversely, any geopolitical flare-up could see Bitcoin dragged down by a strengthening dollar and broader risk aversion.
Closing Thoughts: Navigating Uncertainty with Strategy
The BTCUSD market is currently at a crossroads, characterized by consolidation and conflicting technical signals. While the underlying trend on longer timeframes remains resilient, shorter-term indicators suggest caution is warranted. The $62,610 level is a pivotal point, and the battleground between $61,251 support and $62,709 resistance will likely define the immediate future. The probability leans towards continued range-bound trading, but the potential for a sharp move in either direction remains significant, especially given the macroeconomic uncertainties and geopolitical risks. For traders, the key is to remain objective, manage risk diligently, and wait for clear setups. Patience will be rewarded as the market eventually resolves this indecision. The current technical picture, while complex, offers defined levels to work with, allowing for strategic planning based on probable outcomes rather than speculation.
Frequently Asked Questions: BTCUSD Analysis
What happens if BTCUSD breaks below the $61,251 support level?
A break below $61,251, especially on the 4-hour chart, would invalidate the current bullish structure and likely trigger a move towards the next support at $60,049.33. This would signal a bearish reversal, with potential downside extending to $58,511.67 if momentum continues.
Should I buy BTCUSD at current levels around $62,610 given the mixed signals?
Buying at current levels carries significant risk due to the conflicting signals and the proximity to resistance. A more prudent approach would be to wait for a confirmed breakout above $62,709 with strong volume, or a clear bounce from support around $61,251, indicating stronger buying conviction.
Is the RSI at 67.2 a sell signal for BTCUSD right now?
An RSI of 67.2 is in the neutral-to-bullish zone, not yet overbought. While it indicates upward momentum, it's not an immediate sell signal. A move above 70 would increase the risk of a pullback, but confirmation of a trend reversal would require other indicators like MACD and price action to align bearishly.
How will upcoming US economic data affect BTCUSD this week?
Softer US labor market data could weaken the dollar, potentially benefiting BTCUSD. However, if inflation remains sticky, it might keep Fed rate hike odds elevated, creating headwinds. Traders should monitor inflation (CPI) and employment figures closely for potential shifts in market sentiment and Bitcoin's reaction.
Track markets in real-time
AI-powered analysis, technical indicators and real-time price data.
Join Our Telegram Channel
Breaking market news, AI analysis and trading signals instantly.
Join Channel