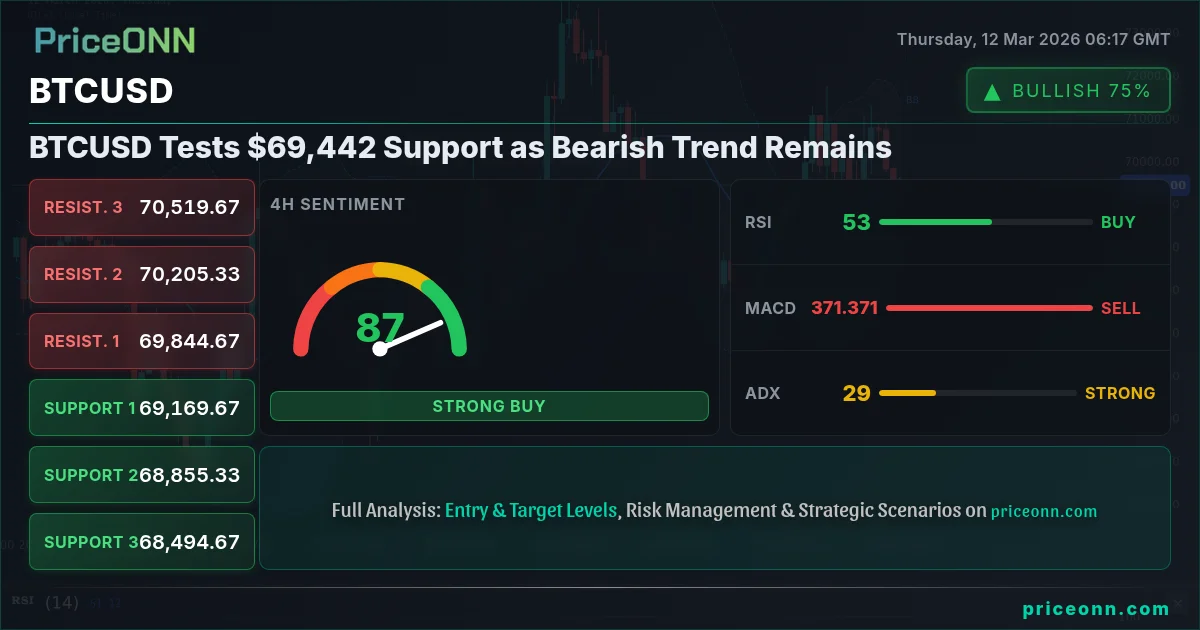
Bitcoin is currently testing the critical $69,442 level, a key support that could determine the short-term trajectory of BTCUSD. A break below this level could signal further downside, while a hold could provide a base for a potential rebound. The overall market sentiment remains cautious, with investors closely monitoring macroeconomic data and geopolitical developments.
Where Bulls Make Their Stand: The $69,227 Test
The immediate focus for Bitcoin is the $69,227.67 support level. This level represents the first line of defense for the bulls. If BTCUSD can hold above this level, it could attempt to consolidate and potentially rebound towards the $69,597.67 resistance. A successful break above this resistance could open the door for a move towards $69,820.33. However, the technical indicators suggest that the bulls face an uphill battle. The RSI on the 1-hour chart is at 41.91, indicating that there is still room for further downside. The MACD histogram also shows negative momentum, suggesting that the bearish pressure is likely to persist. Scalpers may look for quick long positions near the $69,227.67 support, while swing traders will likely wait for a more decisive signal before committing to a long position.
Historically, Bitcoin has shown resilience in the face of bearish pressure, often staging unexpected rallies. However, the current macroeconomic environment, characterized by rising interest rates and a strong dollar, presents a significant challenge. The correlation between BTCUSD and the DXY (Dollar Index) is currently negative, meaning that a stronger dollar is likely to put further pressure on Bitcoin. With the DXY currently trading at 99.23 and showing a strong upward trend, Bitcoin bulls face a difficult task.
The Bear's Den: Cracking $69,227 Opens the Floodgates
For the bears, the key objective is to break below the $69,227.67 support level. A sustained break below this level could trigger a significant sell-off, potentially pushing BTCUSD towards the next support level at $69,080.33. If this level fails to hold, the bears could target $68,857.67. The technical indicators favor the bearish scenario. The 1-hour, 4-hour, and daily charts all show negative momentum. The ADX on the 1-hour chart is at 17.76, indicating a weak trend, but the overall bearish sentiment suggests that a breakdown is more likely than a breakout. Short-term traders may look for short positions on any rallies towards the $69,597.67 resistance, while long-term investors may consider reducing their exposure to Bitcoin if the $69,227.67 support is breached.
The recent news regarding escalating geopolitical tensions in the Middle East, particularly those involving Iran, adds another layer of complexity to the market. According to Reuters, these tensions are threatening Eurozone stability and contributing to the rise in crude oil prices. As geopolitical risks increase, safe-haven assets such as gold and the US dollar tend to attract more demand. This could further exacerbate the negative correlation between BTCUSD and the DXY, putting additional pressure on Bitcoin.
The Waiting Game: Consolidation Between $69,227 and $69,597
A third scenario is that BTCUSD remains range-bound between the $69,227.67 support and the $69,597.67 resistance. This scenario could play out if the bulls and bears remain in a stalemate, with neither side able to gain a decisive advantage. In this case, BTCUSD could oscillate within this range, providing opportunities for range-bound traders. However, this scenario is less likely given the overall bearish sentiment and the strength of the US dollar. The ADX on the 1-hour chart is at 17.76, indicating a weak trend, which supports the possibility of a range-bound scenario. However, the negative momentum on the MACD histogram suggests that the bears are more likely to eventually break below the $69,227.67 support.
For scalpers, a range-bound market can be profitable, but it requires precise timing and risk management. Swing traders typically avoid range-bound markets, preferring to wait for a clear breakout or breakdown before taking a position. Long-term investors should focus on the bigger picture and consider whether the current market conditions align with their overall investment strategy.
The Most Likely Path: Bearish Breakdown (60% Probability)
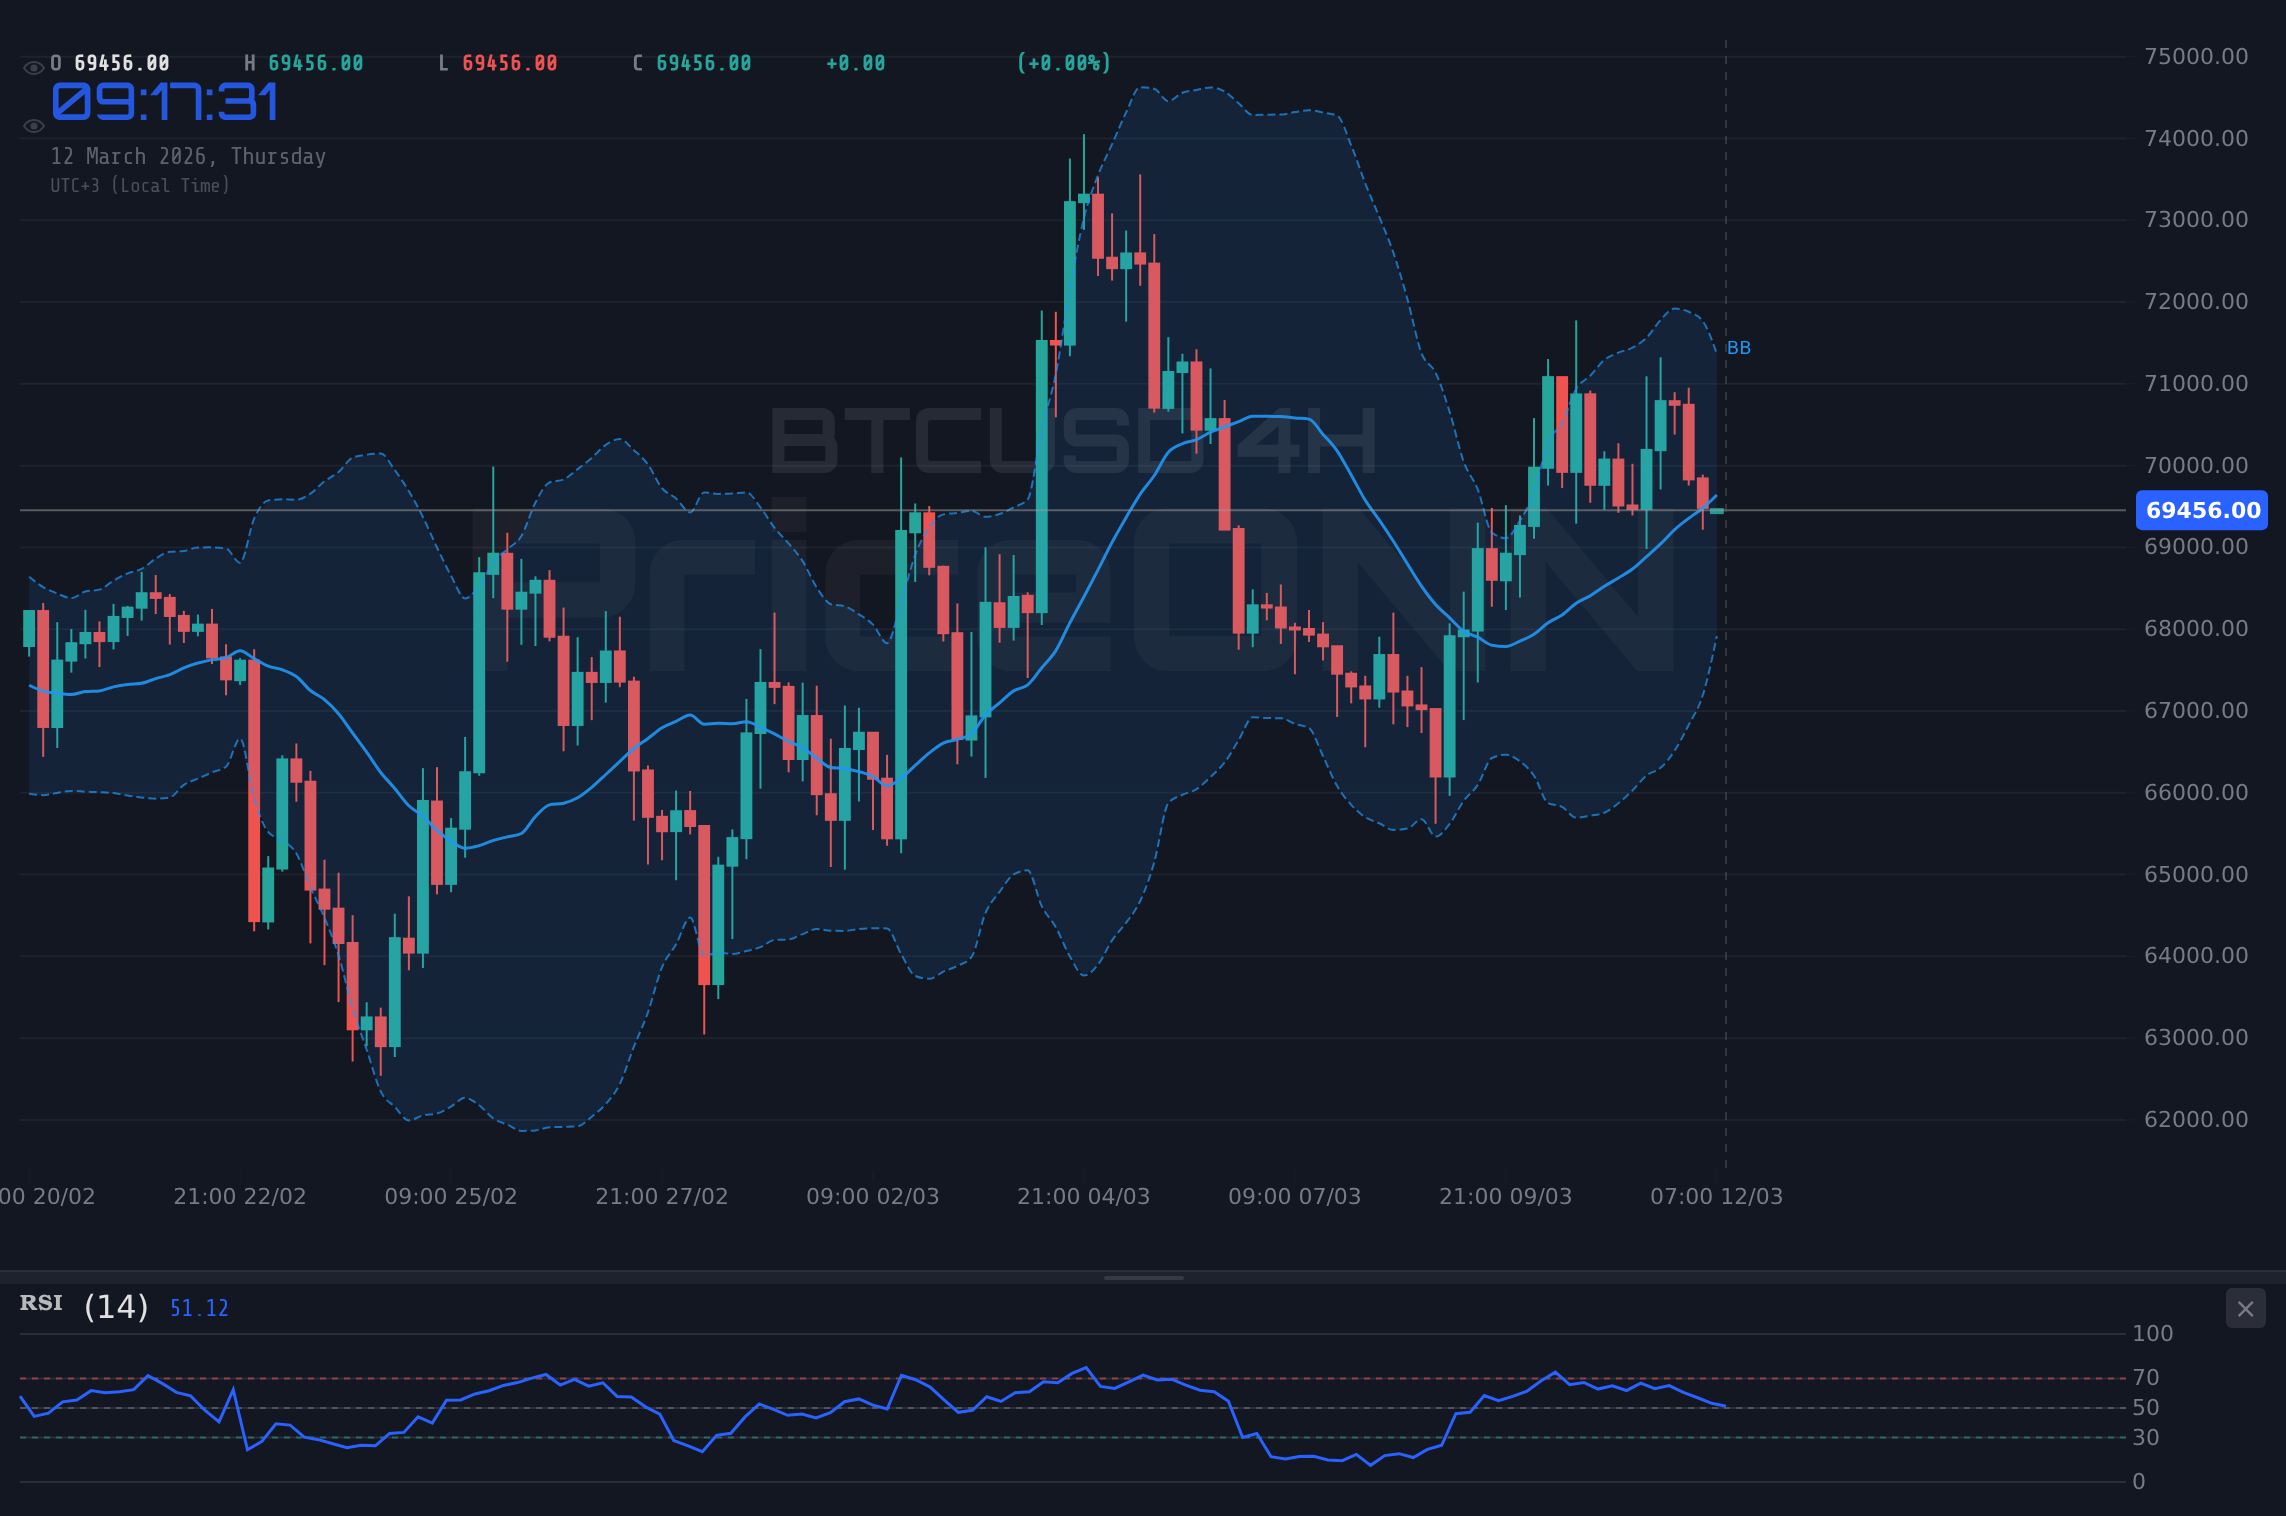
Considering the technical indicators, the macroeconomic environment, and the geopolitical risks, the most likely scenario is a bearish breakdown below the $69,227.67 support level. The negative momentum on the MACD histogram, the strength of the US dollar, and the escalating geopolitical tensions all point to further downside for Bitcoin. The 1-hour chart shows a clear downward trend, with the price consistently making lower highs and lower lows. The 4-hour and daily charts also confirm the bearish sentiment. While a rebound is always possible, the odds favor a continuation of the downward trend. We assign a 60% probability to this scenario. In the event of a bearish breakdown, BTCUSD could target the $69,080.33 support level, followed by $68,857.67.
It's important to remember that market conditions can change rapidly. A surprise announcement from the Federal Reserve, a positive development in the geopolitical arena, or a sudden surge in risk appetite could all alter the trajectory of Bitcoin. Therefore, it's crucial to remain flexible and adapt your strategy as new information becomes available. Those with experience tracking BTCUSD through the 2024 rate cycle will be keenly aware of the impact of the Fed's decisions on the cryptocurrency market.
The strength of the DXY is a critical factor to watch. With DXY at 99.23, Bitcoin is likely to remain under pressure. A sustained break above 99.33 in the DXY could exacerbate the bearish sentiment and trigger a further sell-off in Bitcoin. Conversely, a pullback in the DXY could provide some relief for Bitcoin bulls. Historically, when the RSI reaches this zone on BTCUSD, the outcome has often been a period of consolidation or a further decline. Therefore, caution is warranted at current levels.
What I'm Watching This Week
This week, I'm closely watching three key triggers:
- A sustained break below the $69,227.67 support level.
- A break above the $69,597.67 resistance level.
- Movements in the DXY and their impact on BTCUSD.
The US jobs data release on Friday could also have a significant impact on Bitcoin. A stronger-than-expected jobs report could strengthen the US dollar and put further pressure on Bitcoin, while a weaker-than-expected report could provide some relief. All traders should be aware that a US jobs data release is scheduled to occur on Friday, March 13, 2026.
If BTCUSD breaks above the $69,597.67 resistance, it could target $69,820.33 and potentially $70,000 this week, contingent on positive market sentiment.
If BTCUSD closes below $69,227.67, expect a drop to $69,080.33 and potentially $68,857.67 within the next 24-48 hours as selling pressure increases.
The upcoming US jobs data release on Friday could significantly impact BTCUSD. Exercise caution and manage your risk accordingly.
Technical Outlook Summary
| Indicator | Value | Signal |
|---|---|---|
| RSI (14) | 41.91 | Bearish |
| MACD Histogram | Negative | Bearish |
| Stochastic | 11.43/12.21 | Oversold |
| ADX | 17.76 | Weak Trend |
| Bollinger | Mid Band | Below |
Key Levels
Support Levels
Resistance Levels
Frequently Asked Questions: BTCUSD Analysis
What happens if BTCUSD breaks below $69,227.67 support?
A break below $69,227.67 could trigger a significant sell-off, potentially pushing BTCUSD towards the next support level at $69,080.33. This scenario is supported by the negative momentum on the MACD histogram and the strength of the US dollar.
Should I sell BTCUSD at current levels of $69,442.00 given the bearish signals?
If you are a short-term trader, consider a short position on rallies towards $69,597.67, with a stop-loss just above that level. Long-term investors may consider reducing exposure if $69,227.67 is breached. However, remember to manage your risk and consider the potential for unexpected rallies.
Is RSI at 41.91 a sell signal for BTCUSD right now?
While an RSI of 41.91 indicates bearish momentum, it is not necessarily a definitive sell signal. It suggests that there is still room for further downside, but it's important to consider other factors such as support levels and overall market sentiment before making a trading decision.
How will the US jobs data release on Friday affect BTCUSD this week?
A stronger-than-expected jobs report could strengthen the US dollar and put further pressure on BTCUSD, potentially leading to a breakdown below $69,227.67. Conversely, a weaker-than-expected report could weaken the dollar and provide some relief for Bitcoin, allowing it to rebound towards $69,597.67.
Track markets in real-time
AI-powered analysis, technical indicators and real-time price data.
Join Our Telegram Channel
Breaking market news, AI analysis and trading signals instantly.
Join Channel