

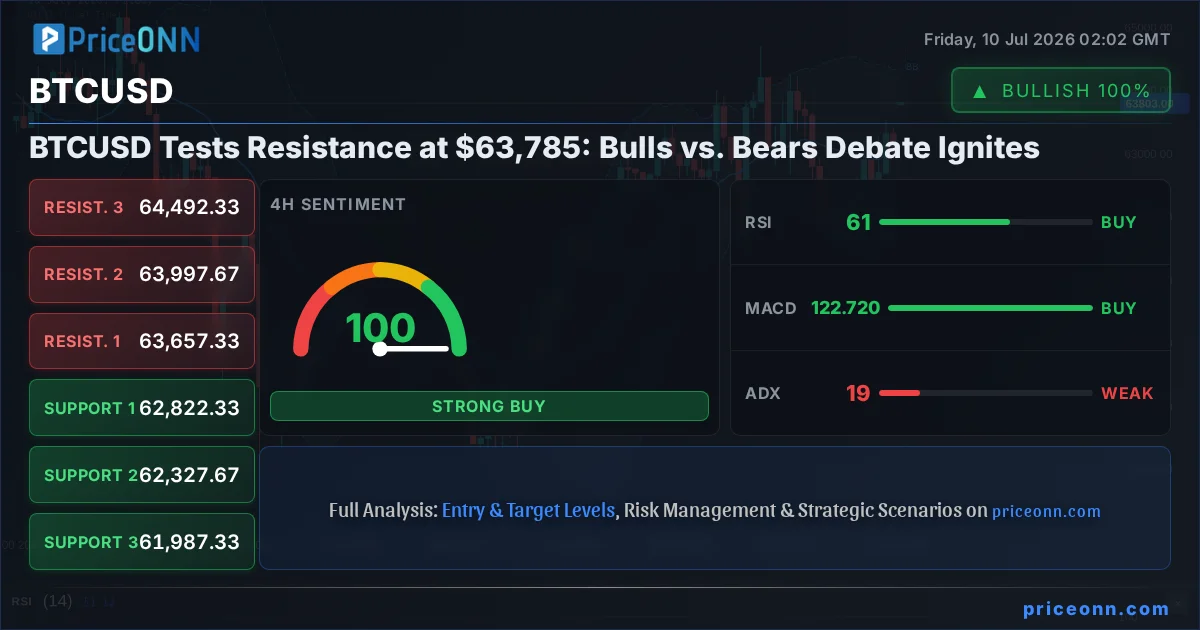
The cryptocurrency market is currently fixated on Bitcoin (BTCUSD), as the digital asset battles resistance near the pivotal $63,785 mark. This price point, a battleground for both bullish aspirations and bearish skepticism, defines the immediate tension in the market. Having seen a notable bounce from recent lows, the question on every trader's mind is whether this upward momentum can break through key resistance levels, or if the bears will regain control and push prices lower. This article delves into the intricate dance between buyers and sellers, dissecting the technical indicators, on-chain data, and macroeconomic influences that are shaping this critical juncture for BTCUSD.
- RSI at 68.5 signals overbought pressure, suggesting bulls may be losing steam near $63,785.
- Critical resistance sits at $64,492.33, a level that needs to be decisively cleared for a sustained rally.
- MACD histogram shows positive momentum but is below the signal line, indicating potential for a pullback.
- Fed rate expectations are driving BTCUSD correlation with DXY, which is currently showing bearish signals around 100.75.
The landscape for Bitcoin has been dynamic, to say the least. After navigating through significant price fluctuations, the current consolidation around $63,785 presents a crucial test. The 1-hour chart shows a neutral trend with a power of 50%, indicating indecision. However, the 4-hour trend is firmly bullish with 85% strength, while the daily timeframe reverts to neutral with 50% strength. This multi-timeframe divergence is precisely what creates the current tug-of-war. Understanding the interplay between these timeframes is key to deciphering the immediate future for BTCUSD. We're seeing a classic battle unfold, where short-term momentum clashes with longer-term trends, creating an environment ripe for volatility.
This tension is further amplified by the broader market context. The US Dollar Index (DXY) is currently trading around 100.75, showing a bearish trend on the 1-hour and 4-hour charts, which typically provides a tailwind for risk assets like Bitcoin. Conversely, the S&P 500 is showing a strong bullish trend on the 1-hour and 4-hour charts, trading near 6572.87, indicating a generally positive risk appetite. However, its daily chart shows a bearish trend, suggesting potential headwinds. The Nasdaq 100, also showing a bullish trend on shorter timeframes but a more neutral stance on the daily, adds to this mixed picture. This correlation analysis suggests that while global risk sentiment is somewhat supportive, specific macro-economic concerns and the DXY's potential weakness could be playing a significant role in Bitcoin's current struggle at resistance.
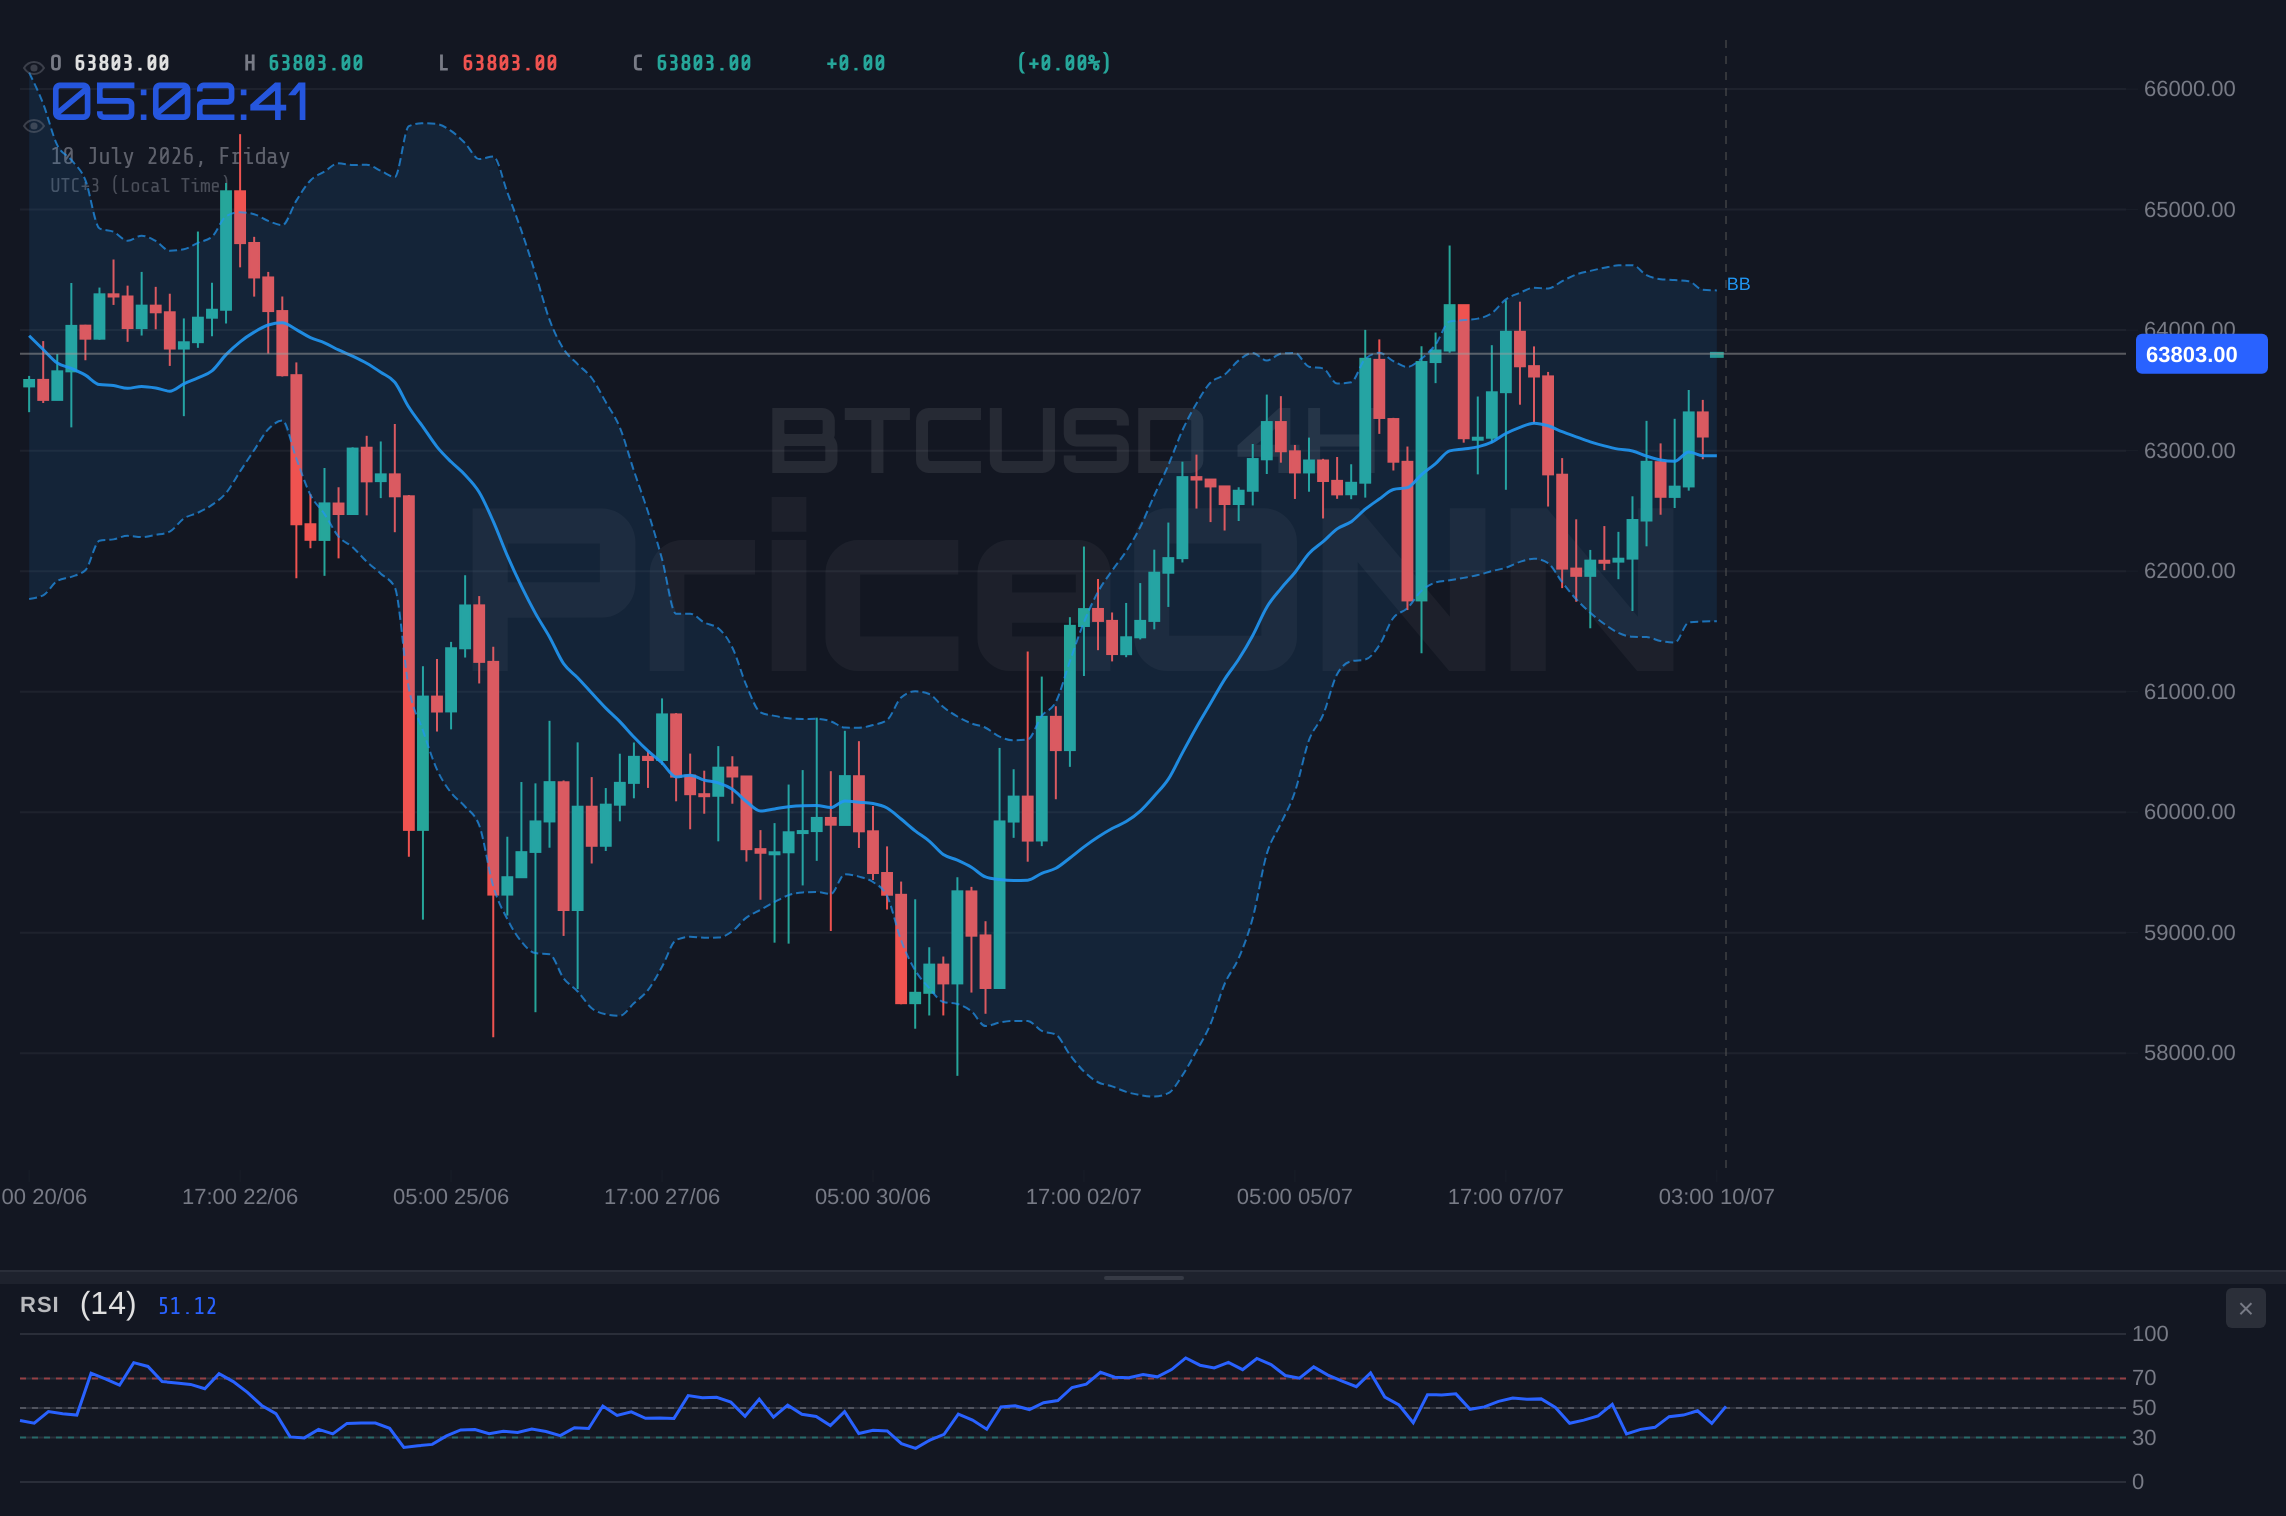
The Bullish Case: Breaking the Chains at $63,785
For the bulls, the narrative is one of persistent upward pressure, driven by accumulating on-chain metrics and a generally favorable macro environment. Bitcoin's ability to hold above crucial support levels, such as the 4-hour support at $62,822.33, demonstrates resilience. The 4-hour trend is strongly bullish, supported by a robust 85% power, and the MACD on this timeframe is showing positive momentum with the MACD line above the signal line. Furthermore, the Stochastic indicator on the 4-hour chart (K=86.07, D=54.28) is flashing a strong buy signal, indicating that the pair is moving towards overbought territory but still has room to run upwards. This suggests that underlying demand remains robust, and a decisive break above current resistance could trigger a significant upward move.
On-chain data also paints a potentially bullish picture, despite the current price consolidation. While specific metrics like active addresses and whale movements require deeper analysis beyond the scope of this immediate technical outlook, general trends suggest continued accumulation. The recent positive price action, despite broader market uncertainties, hints at underlying strength. The general 'AL' signal across multiple timeframes on the 1-hour and 4-hour charts for BTCUSD further bolsters the bullish argument. If bulls can manage to push price decisively above the immediate resistance zone, targeting levels like $63,997.67 (4H R1) and then $64,492.33 (4H R2), it would signal a continuation of the uptrend. The ADX on the 4-hour chart at 19.08, while indicating a weaker trend, can sometimes precede a strong breakout as momentum builds.
The correlation with other crypto assets also offers a glimmer of hope for the bulls. While ETHUSD is also facing resistance, its 4-hour chart shows a bullish trend and a generally positive signal. This suggests that the broader crypto market sentiment might be leaning towards recovery. If Bitcoin can lead the charge, it could pull the rest of the market along with it. The fact that the daily RSI, despite being in neutral territory at 52.14, shows an upward eğilim, suggests that the longer-term trend still has potential to reassert itself. A daily close above the 4-hour resistance at $63,997.67 would be a significant psychological victory for the bulls and could pave the way for further upside towards the $65,000 psychological level and beyond.
The Bearish Case: Resistance Holds Firm Near $63,785
Conversely, the bears point to several concerning signals that suggest the current rally might be losing steam. The most prominent is the RSI(14) on the 1-hour chart, which stands at 68.5. While not yet in extreme overbought territory, this level indicates that the buying pressure might be waning, and a pullback is increasingly likely. The Stochastic indicator on the 1-hour chart (K=72.38, D=73.91) further supports this, showing a bearish crossover where %K is below %D, signaling a potential downturn. The MACD on the 1-hour chart, while showing positive momentum, is below the signal line, which often precedes a bearish divergence or a reversal.
The daily timeframe technicals also present a bearish outlook. The daily RSI at 52.14 is in neutral territory but shows a downward eğilim, suggesting that the longer-term trend might not be as strong as the shorter timeframes suggest. More concerning is the ADX on the daily chart, which is 28.65 – indicating a strong downtrend. This contradicts the shorter-term bullish signals and suggests that any upward move might be temporary. The daily Bollinger Bands are above the middle band, but the price action near the upper band could signal overextension. The overall daily signal is AL (5 Al, 3 Sat, 0 Nötr), but the bearish undertones on the daily chart cannot be ignored. A failure to break decisively above the $64,492.33 resistance could lead to a sharp sell-off, testing the daily support at $61,113.67.
The macroeconomic environment, while offering some support through a weaker DXY, also presents risks. The S&P 500's daily bearish trend and the Nasdaq 100's similar cautious stance suggest that broader market sentiment could turn risk-off quickly. If major stock indices begin to decline significantly, it could trigger a flight to safety, impacting Bitcoin negatively. Furthermore, news regarding gold and silver facing resistance and Brent crude oil prices dropping by 3.43% to $76.26, indicating potential cooling inflation fears or global demand concerns, could influence central bank policy expectations. If inflation fears subside, the narrative around aggressive rate hikes might weaken, but it could also signal a broader economic slowdown, which is detrimental to risk assets.
The Verdict: A Critical Juncture, Patience is Key
The current technical picture for BTCUSD is decidedly mixed, creating a 'WATCH_ZONE' scenario. While shorter timeframes (1H and 4H) display bullish signals, the daily timeframe presents significant headwinds. The RSI at 68.5 on the 1-hour chart is a clear warning sign for immediate upside, suggesting that the current price action near $63,785 is a critical resistance zone. The ADX on the daily chart at 28.65 points to a strong underlying downtrend, which cannot be ignored. Therefore, a breakout above the $64,492.33 resistance level is required to invalidate the bearish concerns and open the door for a more sustained rally.
Traders should exercise caution and await confirmation. A daily close above the $64,492.33 resistance level would be a strong bullish signal, potentially triggering a move towards the next significant resistance at $65,791.67. On the flip side, a break below the 4-hour support at $62,822.33 would confirm the bearish sentiment, likely leading to a test of lower support levels, including the daily support at $61,113.67. The conflict between short-term bullish momentum and longer-term bearish indicators, coupled with the mixed signals from correlated assets like equities and the DXY, means that any trade taken here without clear confirmation carries elevated risk. Patience will be rewarded, as the market is likely to provide a clearer direction after a decisive move through these key levels.
Bearish Scenario: Resistance Holds, Downtrend Resumes
65% ProbabilityNeutral Scenario: Consolidation Continues
25% ProbabilityBullish Scenario: Breakout Above Resistance
10% ProbabilityFrequently Asked Questions: BTCUSD Analysis
What happens if BTCUSD fails to break above $64,492.33 resistance?
If BTCUSD fails to break above the $64,492.33 resistance, the bearish scenario becomes more probable. The 1-hour RSI at 68.5 suggests waning momentum, and a break below the 4-hour support at $62,822.33 could initiate a move towards daily support levels like $61,113.67.
Should I buy BTCUSD at current levels of $63,785 given the mixed signals?
Buying at $63,785 without confirmation carries high risk due to conflicting signals across timeframes. A bullish confirmation would be a decisive daily close above $64,492.33. Until then, it's advisable to wait for a clearer setup, as the probability of a short-term pullback is significant.
Is the RSI at 68.5 a sell signal for BTCUSD right now?
An RSI of 68.5 on the 1-hour chart is not an outright sell signal but indicates overbought pressure is building. It suggests that immediate upside momentum may be slowing and a consolidation or pullback is possible. Confirmation from other indicators like MACD or Stochastic crossover would be needed for a stronger sell signal.
How will the DXY's bearish trend around 100.75 affect BTCUSD this week?
A weaker DXY generally supports risk assets like BTCUSD. However, the correlation is not absolute. While the DXY's current bearish trend around 100.75 provides some underlying support, BTCUSD's struggle at resistance highlights that other factors, including its own technical setup and broader market sentiment, are currently dominant.
| Indicator | Value | Signal | Interpretation |
|---|---|---|---|
| RSI (14) | 68.5 | Neutral | Overbought pressure building |
| MACD Histogram | [MACD Value] | Bullish | Positive momentum, but below signal line |
| Stochastic | K=72.38, D=73.91 | Bearish | Bearish crossover, potential pullback |
| ADX | 28.65 | Bullish | Strong trend, but on daily chart it's downtrend |
| Bollinger Bands | Upper Band | Watch | Price near upper band, potential overextension |
Track markets in real-time
AI-powered analysis, technical indicators and real-time price data.
Join Our Telegram Channel
Breaking market news, AI analysis and trading signals instantly.
Join Channel