

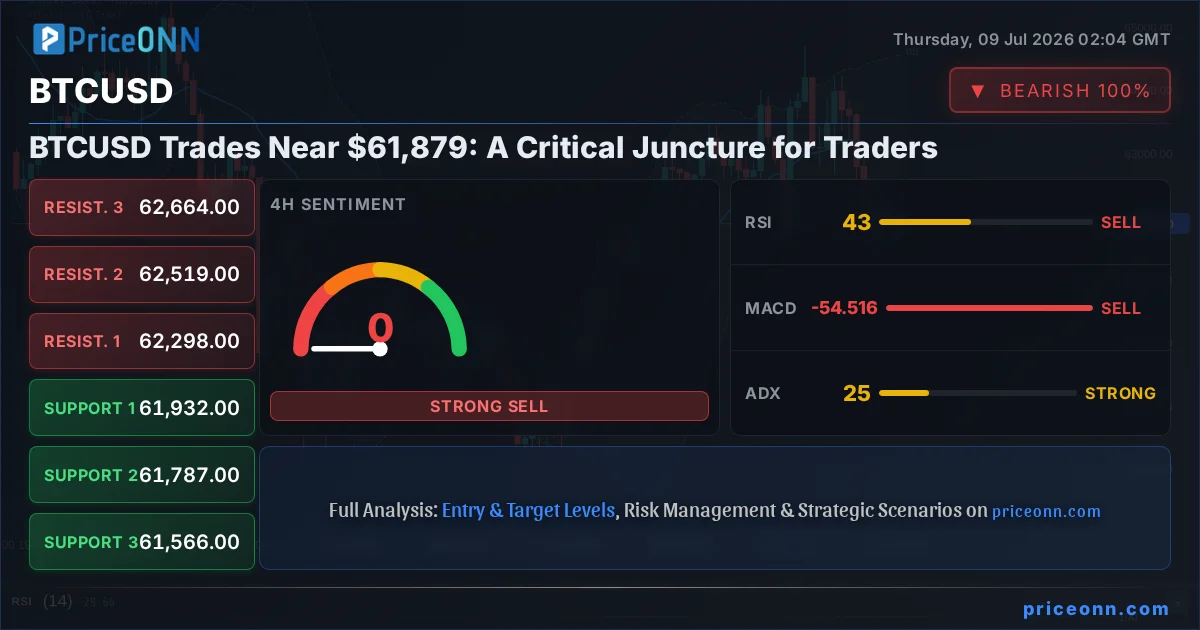
The financial world often presents moments where clarity seems just out of reach, a fog of uncertainty obscuring the path forward. For Bitcoin (BTCUSD), currently trading near the $61,879 mark, we are undoubtedly in one of those periods. The cryptocurrency market, known for its volatility and rapid shifts, is at a critical juncture, demanding a nuanced approach that blends an understanding of macro headwinds with a keen eye on on-chain dynamics and precise technical levels. Recent price action has seen BTCUSD experience a notable downturn, dropping 2.86% to $61,879.00, reflecting broader market sentiment and specific crypto-related pressures. This environment calls for a deep dive into what the current data is telling us, moving beyond simple price points to understand the underlying forces at play.
- The RSI at 45.11 on the daily chart signals a neutral-to-bearish leaning, indicating waning momentum rather than outright selling pressure.
- Critical support for BTCUSD sits at $61,665.33, a level that has been tested and held previously, but its resilience is now in question.
- The MACD histogram shows positive momentum on the daily chart, suggesting that while downward price action is occurring, the underlying force might be shifting.
- Correlation analysis indicates BTCUSD is currently influenced by broader risk-off sentiment, mirroring the performance of traditional indices like the S&P 500.
The last 48 hours have presented a mixed bag of news that, while not directly about Bitcoin, paints a picture of the global economic landscape influencing all risk assets. The forex markets saw EUR/USD trading sideways as traders assessed divergent central bank tones; the ECB's hawkish stance contrasts with a more cautious approach from the Fed, creating uncertainty that often spills over into crypto markets. Meanwhile, gold prices experienced a volatile week, initially recovering from $3,950 only to face resistance and decline again, partly due to the US Dollar's resilience and shifting inflation expectations. The news that oil prices jumped over 7% following reports of an 'Iran ceasefire declared over' highlights the persistent geopolitical risks that can trigger flight-to-safety flows, potentially drawing capital away from riskier assets like Bitcoin. These macro undercurrents are crucial; they form the backdrop against which BTCUSD's price action must be understood. A strengthening dollar, as seen in the DXY hovering around 100.99, typically correlates with a risk-off environment, and Bitcoin, despite its growing institutional adoption, is not entirely immune to these broader market tides.
Looking at the technicals, the daily chart for BTCUSD presents a complex picture. The current price of $61,879.00 is trading below the daily middle Bollinger Band, suggesting a bearish inclination on this timeframe. However, the RSI(14) at 45.11 remains in the neutral zone, not yet indicating oversold conditions but showing a clear downward trend from recent highs. This suggests that while selling pressure is present, it might not be overwhelming enough for a capitulation event just yet. The MACD on the daily chart is showing positive momentum, with the MACD line above its signal line, which can sometimes precede a bullish turn, even amidst a current downtrend. This divergence between the price action and MACD momentum is a key area to watch. The ADX at 29.09 indicates a strong downtrend, reinforcing the bearish price action, but the Stochastic Oscillator, with K at 80.57 and D at 85.42, is entering overbought territory on the daily timeframe. This confluence of signals - a strong downtrend indicated by ADX, but with potential for a short-term pullback due to Stochastic and MACD - creates the current ambiguity.
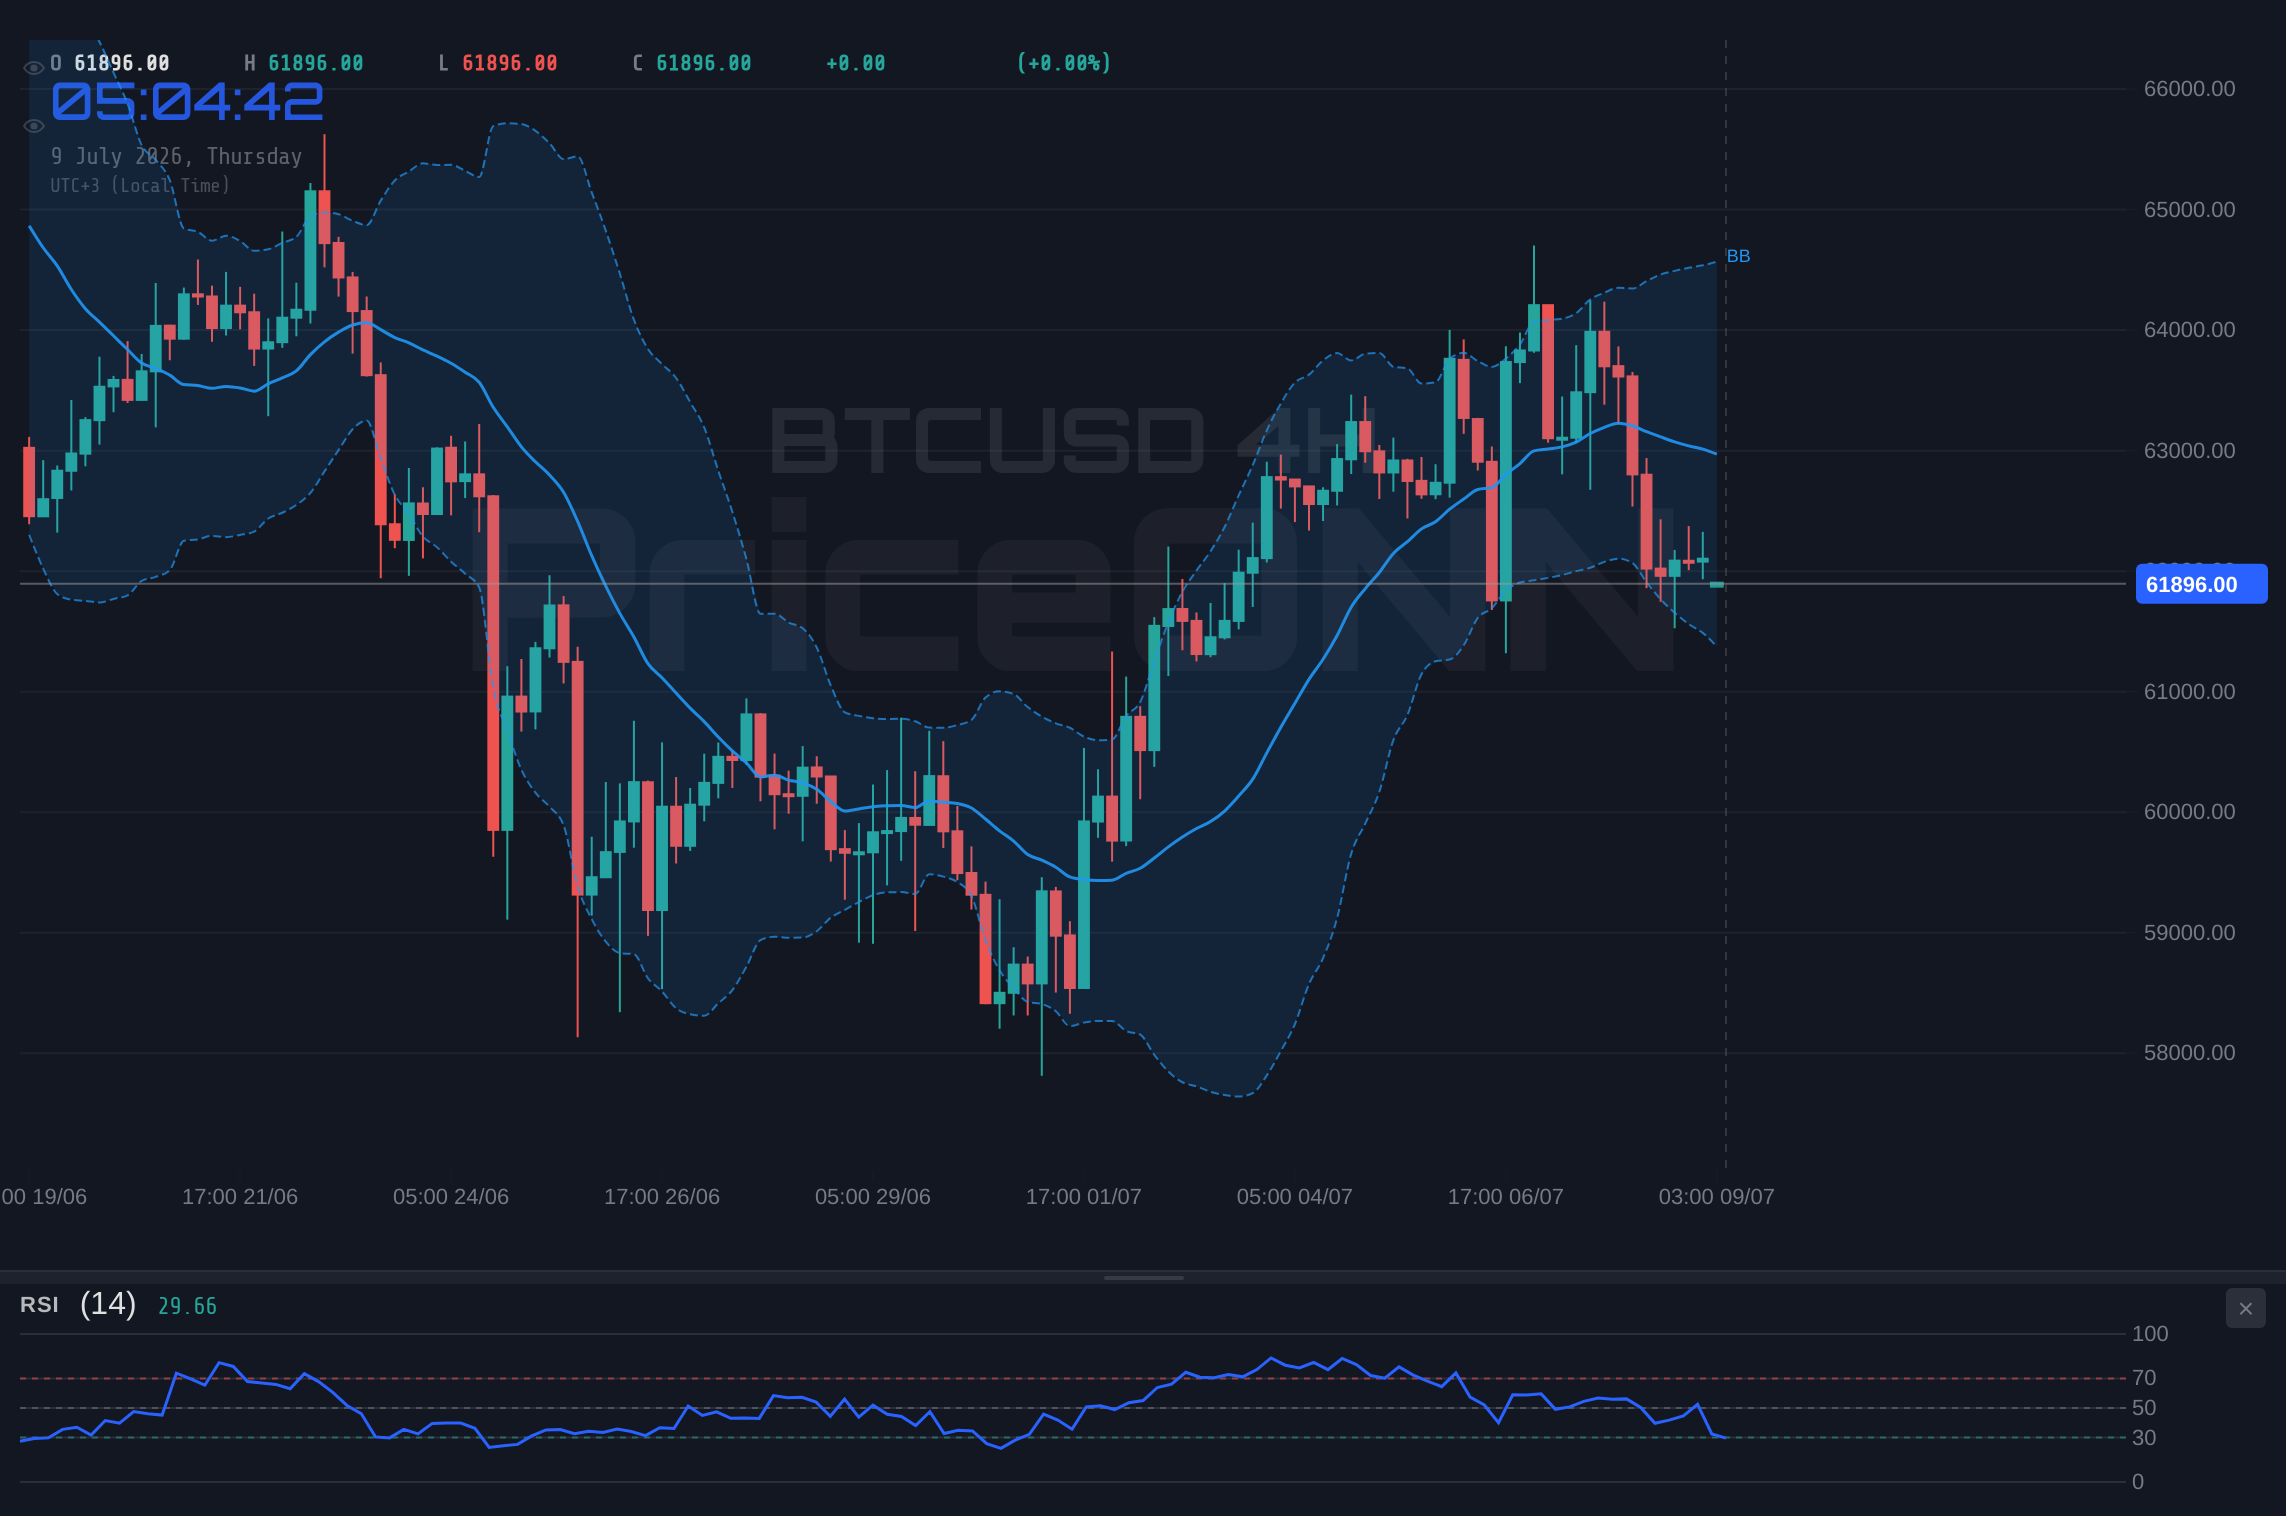
The 4-hour chart offers a slightly more bearish short-term perspective. BTCUSD is trading below the middle Bollinger Band, and the RSI(14) at 42.51 continues its downward trajectory, reinforcing the prevailing bearish sentiment in intraday trading. Both the MACD and Stochastic oscillators are signaling bearish momentum, with the MACD histogram negative and the Stochastic %K below %D. The ADX at 24.18 still points to a strong downtrend, though slightly weaker than the daily reading. The General Signal across all indicators on the 4-hour timeframe is a resounding 'SELL' (0 Buy, 8 Sell, 0 Neutral), indicating that immediate intraday trading conditions are leaning towards further downside. This contrasts with the daily's mixed signals, highlighting the importance of timeframes in interpreting market behavior. For traders focused on short-term moves, the 4-hour chart suggests caution and a bearish bias.
On the 1-hour chart, the picture remains predominantly bearish, though with some nuances. The price of $61,879.00 is trading below the middle Bollinger Band, and the RSI at 38.52 is firmly in the neutral-to-bearish zone, continuing its descent. The MACD is showing positive momentum, a recurring theme across multiple timeframes, which might suggest a potential for a short-term bounce or a slowing of the current downtrend. However, the Stochastic Oscillator is showing a bearish signal (%K below %D) and the ADX at 26.4 confirms a strong downtrend. The overall signal on the 1-hour is also 'SELL' (1 Buy, 7 Sell, 0 Neutral). This consistent bearish leaning across shorter timeframes, coupled with the strong daily ADX, paints a picture of a market under pressure, where any upward movement might be a temporary correction rather than a sustained reversal.
When we consider the broader market context, the correlation between Bitcoin and traditional risk assets, particularly the S&P 500, becomes apparent. The S&P 500, currently trading at 6572.87 with a 0.74% gain, shows a mixed picture across timeframes - strong on 1H and 4H, but a bearish daily trend. Nasdaq 100, at 29236.29, also exhibits similar mixed signals. The Dow Jones 30, however, is showing a strong daily uptrend despite a significant 0.96% daily drop. This divergence within major equity indices suggests underlying market uncertainty. Historically, periods of such mixed signals in equities often lead to a risk-off sentiment, which can negatively impact cryptocurrencies like Bitcoin. If the S&P 500 were to break its key daily support levels, it would likely trigger further selling pressure on BTCUSD, pushing it towards its own critical support zones.
The strength of the US Dollar Index (DXY), currently at 100.99 and showing a slight daily decline, also plays a crucial role. A strong DXY typically correlates inversely with risk assets, including gold and, to some extent, Bitcoin. While the DXY’s trend appears neutral across most timeframes, its ability to hold above key support levels could cap any significant recovery in risk assets. The recent news regarding oil prices jumping significantly due to geopolitical tensions in the Middle East is a potent reminder of how global instability can drive capital into perceived safe havens. While Bitcoin has often been touted as a digital gold or a hedge against inflation, its correlation with traditional risk assets often overshadows this narrative during times of heightened market fear. Therefore, any escalation in geopolitical tensions could indirectly pressure BTCUSD as investors seek perceived safety in traditional assets.
On-chain data provides another layer of analysis, though it often lags price action or requires careful interpretation. Active addresses, a key metric for network health, have shown a general decline from recent peaks, suggesting less retail engagement. Whale movements, tracked by the accumulation or distribution patterns of large holders, have been mixed. Some large wallets appear to be accumulating positions around current levels, viewing it as a discount, while others have been observed moving tokens to exchanges, potentially signaling an intent to sell. Exchange flows also paint a complex picture: while net outflows have been observed recently, suggesting holders are moving coins to cold storage, indicating a belief in future price appreciation, the overall volume has been somewhat subdued. This lack of robust on-chain activity might be contributing to the current sideways consolidation and inability to form a clear trend.
The DeFi and NFT ecosystems, while crucial to the broader crypto narrative, are currently showing signs of cooling investor interest. Total Value Locked (TVL) across major DeFi protocols has seen a stagnation, and trading volumes in the NFT market have declined significantly from their highs. This suggests that speculative capital, which often fuels altcoin rallies and can indirectly support Bitcoin's price, might be retracting. A vibrant DeFi and NFT sector typically indicates a healthy risk appetite within the crypto space. Its current subdued state might be a contributing factor to Bitcoin's struggle to find upward momentum, as the broader crypto market sentiment appears to be cautious rather than euphoric.
Regulatory news, a constant factor in the crypto space, remains a background concern. While there haven't been any major negative regulatory crackdowns in the last 48 hours that directly impact BTCUSD, the ongoing uncertainty surrounding future regulations in key jurisdictions like the US and EU continues to temper institutional enthusiasm. Any significant regulatory clarity, whether positive or negative, could act as a catalyst for a decisive move in Bitcoin's price. For now, the market seems to be in a holding pattern, awaiting clearer signals from both the regulatory landscape and the macroeconomic environment.
Considering the technical levels, BTCUSD's immediate support lies at $61,665.33, followed by $60,655.67 and $60,000. These levels are crucial. A break below $61,665.33 could signal a deeper correction, potentially targeting the $60,655.67 zone. On the resistance side, the immediate hurdle is at $62,682.67, followed by $64,709.67 and $65,719.33. Breaking above $62,682.67 would be the first sign of a potential bullish reversal, but sustained strength above $64,709.67 would be needed to confirm a trend change. The current price of $61,879.00 is precariously positioned between these key levels, highlighting the range-bound nature of the market and the importance of patience for traders.
Given the current market conditions - mixed daily technicals, bearish short-term signals, macro uncertainty, and subdued on-chain activity - the primary trade recommendation remains cautious. We are in a WATCH_ZONE. The market needs to provide a clearer signal before committing to a directional trade. A potential setup would emerge if BTCUSD confirms a break above the immediate resistance at $62,682.67, especially if accompanied by increased volume and a positive shift in broader market sentiment. This would negate the current bearish short-term trend and open the door for a move towards the $64,709.67 resistance. Conversely, a decisive close below the $61,665.33 support level, confirmed by increasing selling volume and a risk-off move in equities, would invalidate any near-term bullish hopes and suggest a further decline towards $60,655.67.
The interplay of these factors - technical indicators, on-chain data, macroeconomic influences, and geopolitical risks - creates a complex trading environment. While the daily chart hints at potential underlying strength with MACD divergence, the prevailing short-term trend and strong ADX readings cannot be ignored. The current price near $61,879.00 represents a critical battleground where bulls and bears are vying for control. Patience is paramount; waiting for a confirmed breakout above resistance or a decisive breakdown below support will be key to navigating this period of uncertainty and identifying high-probability trading opportunities. The market is speaking, but for now, it's whispering rather than shouting, demanding careful listening and disciplined execution.
Bearish Scenario: Consolidation Breakdown
65% ProbabilityNeutral Scenario: Range-Bound Volatility
25% ProbabilityBullish Scenario: Support Holds, Rebound Begins
10% ProbabilityTechnical Outlook Summary
| Indicator | Value | Signal | Interpretation |
|---|---|---|---|
| RSI (14) | 45.11 | Neutral | Slightly bearish trend, but not oversold |
| MACD Histogram | Positive | Bullish Momentum | Suggests potential for a bounce or slowing downtrend |
| Stochastic | K:80.57, D:85.42 | Bearish Crossover | Entering overbought territory, potential pullback |
| ADX | 29.09 | Strong Trend | Indicates a strong prevailing trend, currently downward |
| Bollinger Bands | Middle Band Breach | Bearish | Price trading below the middle band |
Frequently Asked Questions: BTCUSD Analysis
What happens if BTCUSD breaks below the $61,665.33 support level?
A daily close below $61,665.33 would invalidate any immediate bullish hopes and signal a potential continuation of the downtrend. This could lead to further selling pressure, targeting the $60,655.67 support level, and potentially a move towards the $59,500 psychological mark.
Should I consider buying BTCUSD at current levels around $61,879 given the mixed signals?
At current levels, a cautious approach is advised. While the daily MACD shows positive momentum, the shorter timeframes and strong ADX suggest continued downward pressure. A confirmed break above $62,682.67, coupled with increasing volume and positive macro sentiment, would be a more prudent entry trigger for a bullish position, with a lower probability of a successful trade at current prices.
Is the RSI at 45.11 a sell signal for BTCUSD right now?
An RSI of 45.11 on the daily chart is not an outright sell signal, but it does indicate a bearish trend and waning momentum. It suggests that while the price is declining, it's not yet in oversold territory, leaving room for further downside before a potential bounce. Traders should look for confirmation from other indicators or price action before acting solely on this RSI reading.
How might geopolitical tensions impact BTCUSD this week, given the current price action?
Heightened geopolitical tensions, as evidenced by the surge in oil prices, can trigger a flight-to-safety. This often benefits traditional safe-haven assets like gold and the US Dollar, potentially putting pressure on risk assets such as BTCUSD. If global instability increases, we could see capital move away from Bitcoin, pushing it towards its support levels around $61,665.33 or lower.
Track markets in real-time
AI-powered analysis, technical indicators and real-time price data.
Join Our Telegram Channel
Breaking market news, AI analysis and trading signals instantly.
Join Channel