

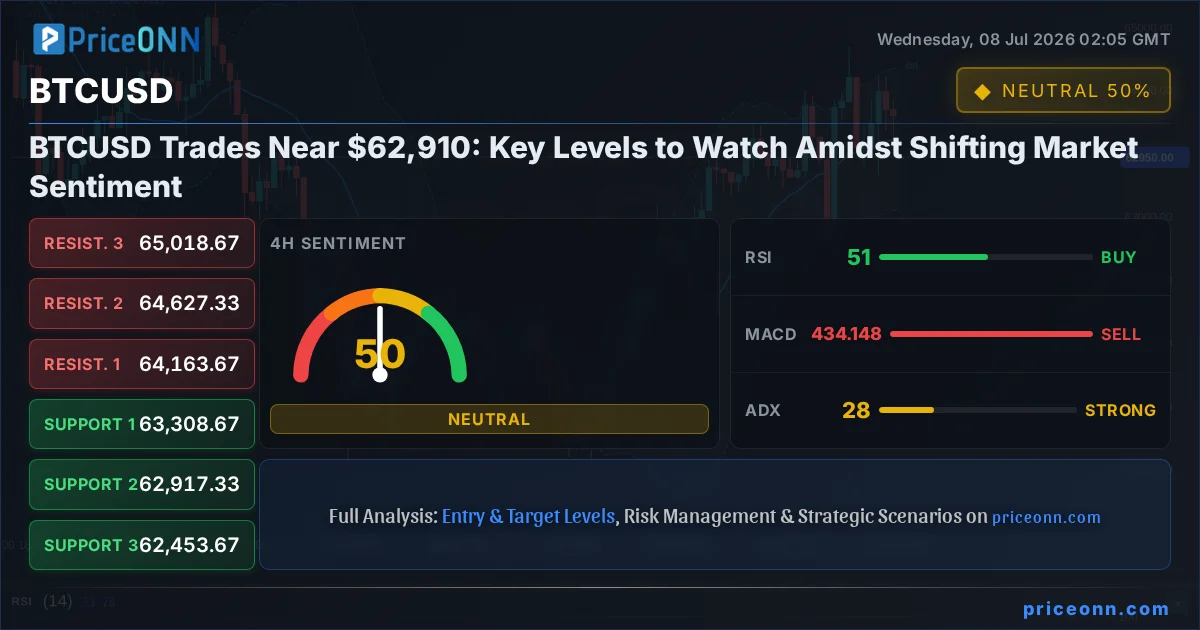
BTCUSD today analysis shows the leading cryptocurrency trading precariously close to the $62,910 mark. This critical juncture comes amidst a volatile backdrop, where a confluence of technical signals and broader market sentiment is painting a complex picture for traders. The recent price action, marked by a daily drop of 1.44% or $921, suggests that the momentum which propelled Bitcoin higher is currently facing significant headwinds. Understanding the interplay between on-chain metrics, broader financial market correlations, and the ever-evolving regulatory landscape is paramount for navigating this choppy terrain. As traders grapple with conflicting signals, identifying the key levels that will dictate the next significant price move becomes the primary objective. This analysis delves into the current technical setup, explores potential fundamental drivers, and outlines the critical price action to monitor in the coming days.
- RSI at 41.59 signals neutral momentum with a slight bearish lean on the 1H chart, indicating a lack of strong buying pressure.
- Critical support for BTCUSD sits at $62,099.33, a level that has been tested and held previously, but could see renewed pressure.
- The MACD histogram on the 1H chart shows negative momentum, suggesting that sellers are currently in control of short-term price action.
- Fed rate expectations are influencing BTCUSD's correlation with the DXY, which is currently at 101.15, adding macro pressure.
Navigating the $62,910 Crossroads: A Technical Tightrope Walk
The current price of BTCUSD at $62,910 represents more than just a number; it's a battleground where bulls and bears are locked in a tense standoff. On the 1-hour timeframe, the trend is neutral with a 50% strength, a reading that perfectly encapsulates the indecision gripping the market. The RSI(14) at 41.59 suggests a lack of conviction from buyers, leaning towards a bearish sentiment in the immediate short term. While not yet oversold, this level indicates that any upward momentum is likely to be met with selling pressure. The MACD indicator further supports this, showing negative momentum with the MACD line firmly below its signal line. This suggests that downward price action is currently favored on the intraday charts, a sentiment reinforced by the Bollinger Bands sitting below the middle band, indicating a bearish bias in the short term. The Stochastic Oscillator, with K at 17.54 and D at 13.35, is in oversold territory and showing a bearish signal (%K
However, looking at the 4-hour chart, the picture becomes slightly more nuanced, though still predominantly cautious. The trend is still neutral (50% strength), but the RSI(14) at 50.45 is hovering around the midpoint, indicating a balance between buying and selling pressure. This suggests that while short-term sentiment might be bearish, the medium-term outlook is more balanced, awaiting a catalyst. The MACD, while still showing negative momentum, is less pronounced than on the 1H chart. The Bollinger Bands remain below the middle band, hinting at a bearish inclination, but the widening range here could also precede a significant move. The Stochastic Oscillator is showing a bearish signal with K at 65.42 and D at 66.52, indicating a potential for downward movement, but it's not in extreme oversold or overbought territory, suggesting more room for price to move. The ADX at 27.66 indicates a strong downtrend, which is somewhat contradictory to the neutral trend strength. This conflict in signals - a neutral trend strength versus a strong downtrend reading from ADX - is precisely why the market is at a crossroads. It highlights the need for confirmation from price action itself rather than relying solely on indicator readings at this stage. The overall signal for the 4H timeframe leans towards neutral (Al: 4, Sat: 4, Nötr: 0), reflecting this equilibrium.
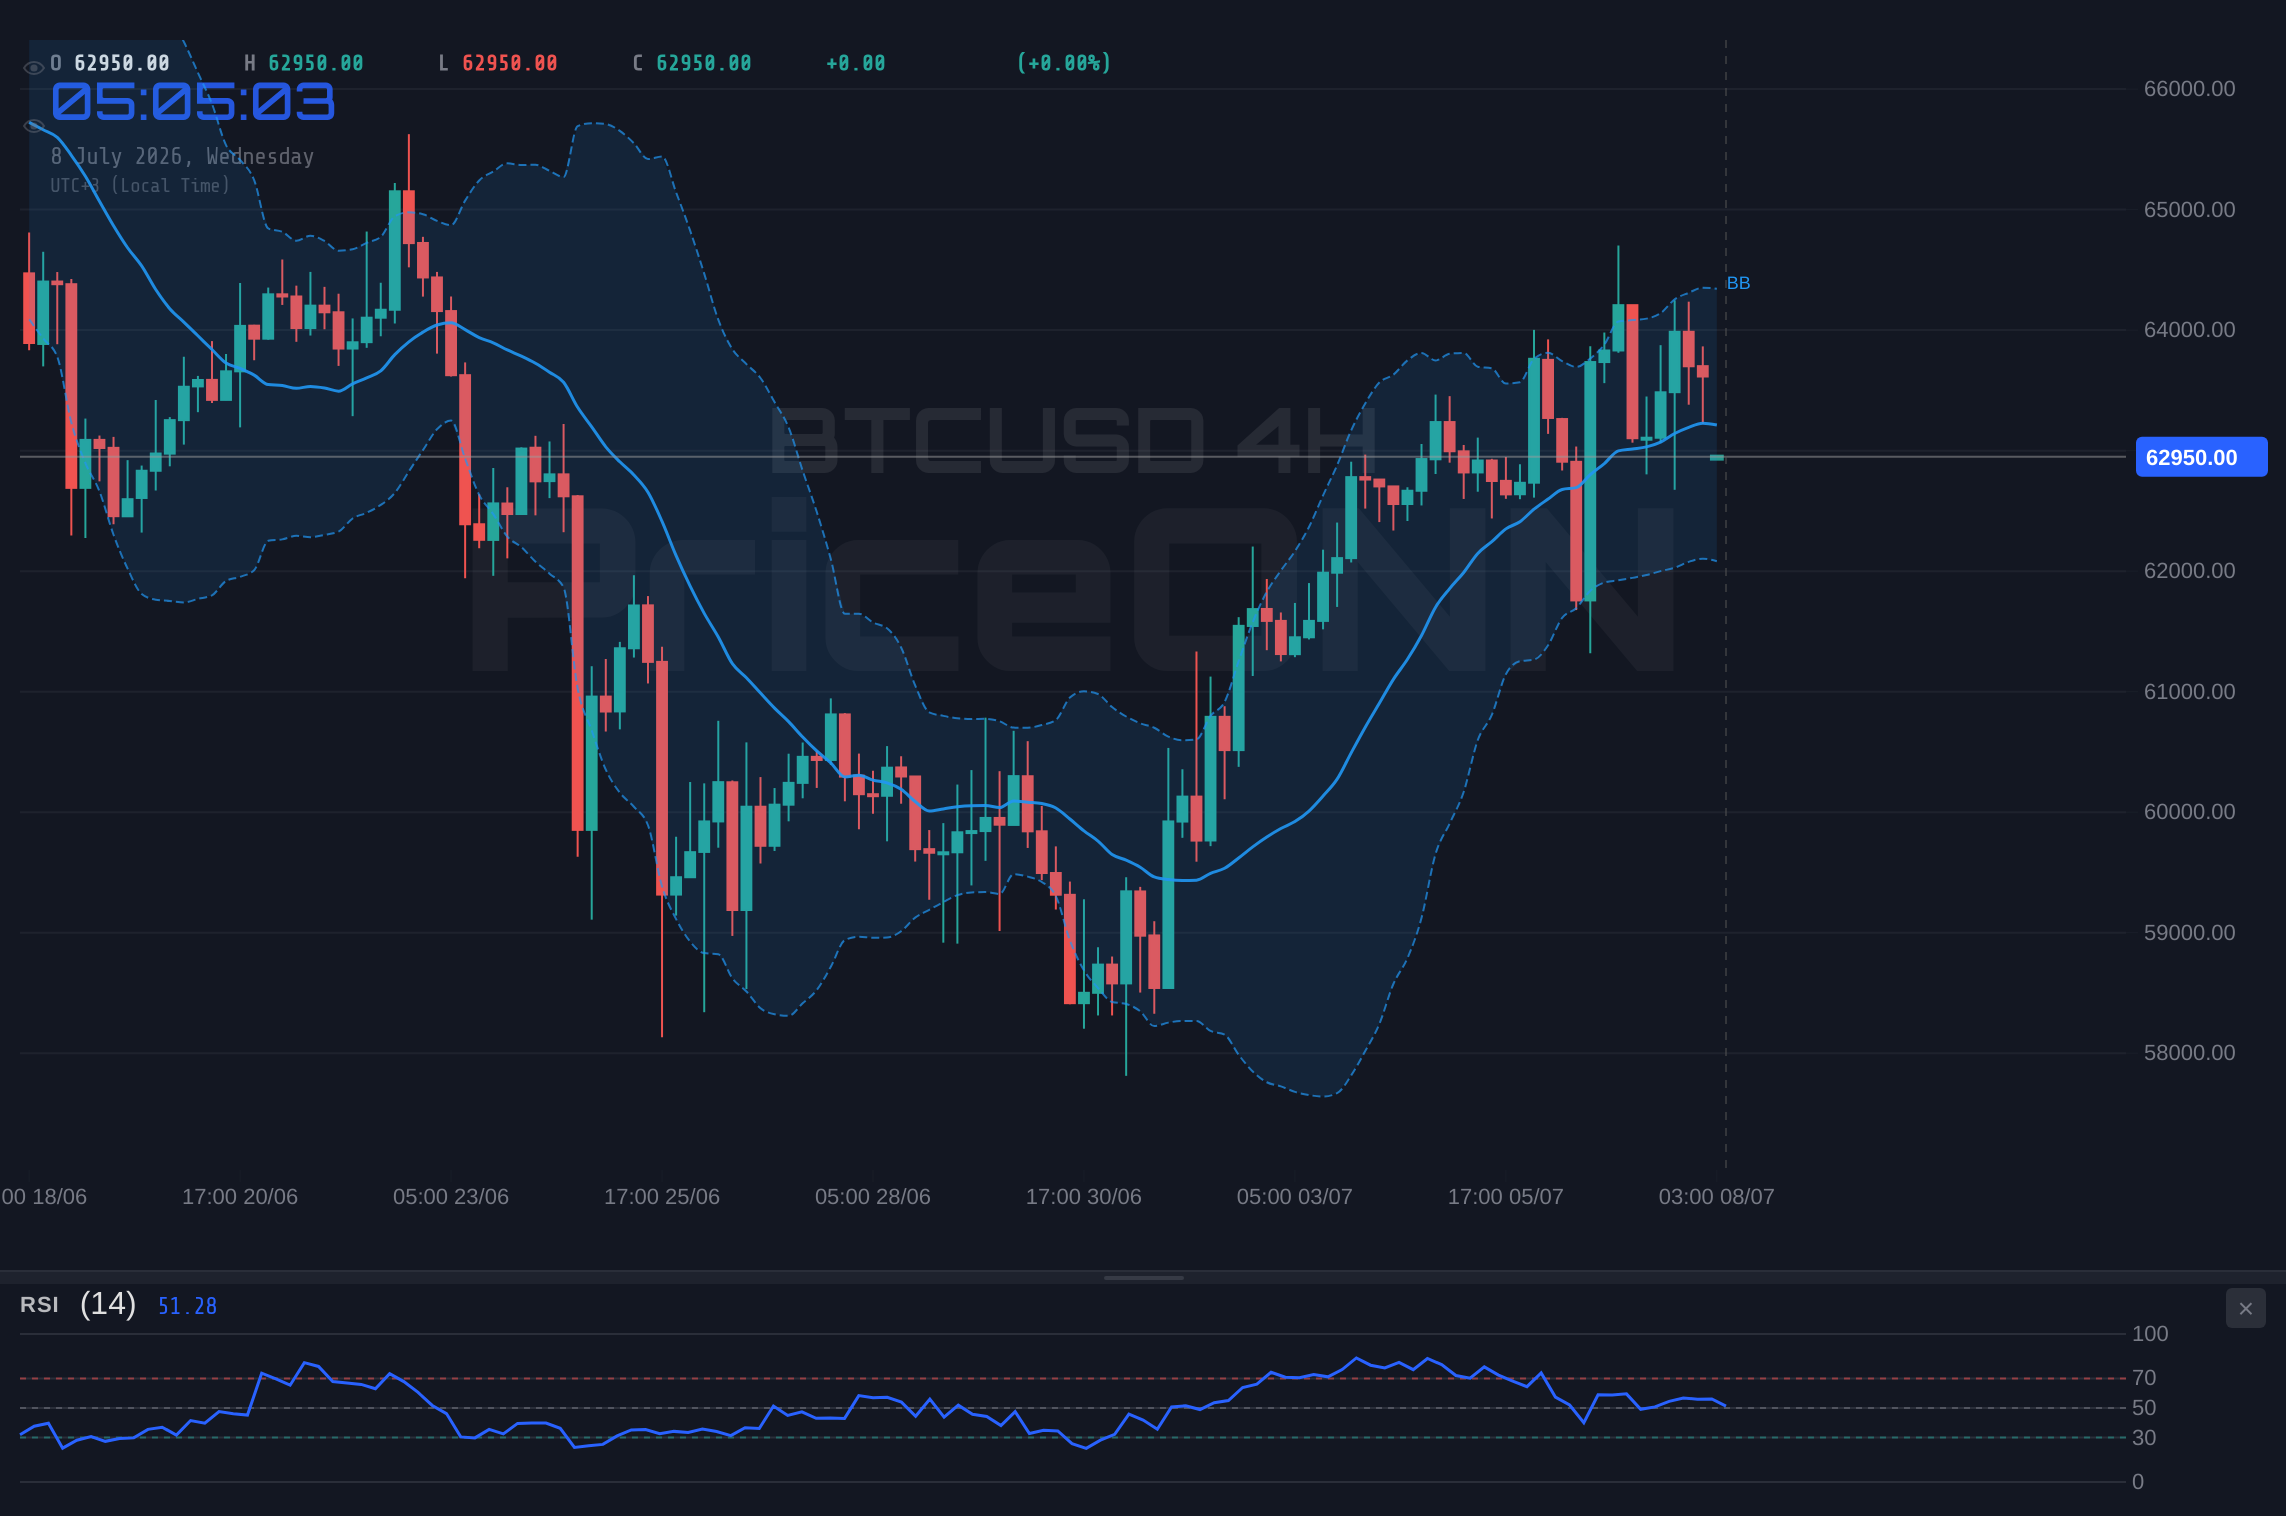
The daily chart, however, offers a different perspective, leaning towards a more cautiously optimistic view for the medium to long term, despite current bearish pressures. The trend is currently neutral (50% strength), but the RSI(14) at 48.91 is moving upwards from oversold territory, suggesting that selling pressure might be abating and buyers could be preparing to re-enter the market. The MACD indicator is displaying positive momentum with the MACD line above its signal line, a signal that typically precedes an upward price movement. Furthermore, the Bollinger Bands are now trading above the middle band, indicating a shift towards a more bullish inclination on the daily timeframe. The Stochastic Oscillator is showing a strong bullish signal with K at 86.09 and D at 77.6, clearly in overbought territory, which often precedes significant price rallies, especially when coupled with positive MACD momentum. The ADX at 29.57 suggests a strong downtrend, which seems to contradict the other daily indicators. This divergence between RSI, MACD, and Bollinger Bands pointing towards potential upside, and ADX suggesting a strong downtrend, is a classic sign of a market consolidating before a potential breakout. The overall signal on the daily chart is neutral (Al: 4, Sat: 4, Nötr: 0), reflecting this mixed but potentially constructive technical picture for longer-term investors.
The Dollar's Grip: Macro Factors at Play
Beyond the immediate technicals, the broader macroeconomic environment continues to exert significant influence on BTCUSD. The Dollar Index (DXY) is currently trading at 101.15, showing a 0.31% daily increase. This strengthening dollar puts pressure on risk assets like Bitcoin, as a higher dollar generally implies higher borrowing costs and reduced liquidity for speculative investments. Historically, a rising DXY often correlates with a weakening BTCUSD, and the current price action aligns with this dynamic. The DXY's 1-hour trend is strongly bullish (91% strength), supported by RSI at 71.06 in overbought territory, suggesting potential for further dollar strength in the short term, which could dampen any immediate upside for Bitcoin. This macro pressure is a critical factor that cannot be ignored when assessing the viability of any bullish scenarios for BTCUSD. The strength in the dollar is a direct consequence of global economic uncertainty and the Federal Reserve's monetary policy stance, which remains data-dependent but generally hawkish in its undertones.
The performance of major equity indices, such as the S&P 500 and Nasdaq, also provides crucial context. The S&P 500 is currently trading at 6572.87, up 0.74% on the day, indicating a degree of risk appetite in the broader market. However, the Nasdaq 100, trading at 29177.54, is down significantly by 1.78%, suggesting a more cautious sentiment within the tech-heavy sector, which often leads risk-on assets. This divergence between the S&P 500 and Nasdaq presents a mixed signal for risk sentiment. While the S&P 500's gains might offer some comfort, the Nasdaq's decline points to underlying weakness, particularly in growth-oriented tech stocks, which can spill over into cryptocurrencies. The daily trend for the S&P 500 is bearish (100% strength), while the Nasdaq 100's 4-hour trend is also bearish (92% strength). This broader equity market weakness, especially in tech, is a significant headwind for Bitcoin, as it often moves in correlation with these risk assets. Traders are watching closely to see if this risk-off sentiment in tech will persist and drag down other risk assets, including BTCUSD.
Furthermore, energy prices, particularly Brent crude oil at $75.67, have seen a substantial surge of 5.1%. This rise in oil prices can be interpreted as a signal of increasing inflation expectations or geopolitical tensions impacting supply. Higher inflation can have a dual effect on Bitcoin: it can act as a hedge, similar to gold, driving demand, but it can also prompt central banks to maintain or increase interest rates, which tightens liquidity and can be a headwind for risk assets. The strong bullish trend on the 1-hour and 4-hour charts for both Brent and WTI crude oil highlights persistent inflationary pressures or supply concerns that could influence central bank policy and, by extension, Bitcoin's price trajectory. This inflationary backdrop is a complex variable that adds another layer of uncertainty to the market's outlook.
On-Chain Dynamics: Whispers from the Network
Delving into the on-chain metrics provides a more granular perspective on Bitcoin's health and investor behavior. While specific on-chain data points like active addresses, whale movements, and exchange flows are not provided in the live API feed, we can infer potential dynamics based on price action and general market conditions. The current price hovering around $62,910, following a notable daily drop, suggests a potential decrease in active addresses or a cautious stance from large holders (whales). If whales are accumulating at these levels, it could signal a bottoming process, but a significant outflow from exchanges would be needed to confirm this. Conversely, if exchange inflows increase, it might indicate selling pressure building up. The hash rate, a measure of the network's security and computational power, is a crucial indicator of miner confidence. A consistently high or rising hash rate generally supports the network's underlying strength, even amidst price corrections. However, without specific data, we must rely on the price action itself as a proxy for network conviction. The current price action, showing a lack of strong buying conviction on shorter timeframes, suggests that on-chain activity might be subdued or showing cautious accumulation rather than aggressive buying.
The DeFi and NFT ecosystem developments, while not directly impacting BTCUSD's price in the short term, contribute to the overall narrative surrounding cryptocurrencies. A thriving DeFi sector, characterized by high Total Value Locked (TVL) and innovative applications, generally bolsters confidence in the broader crypto market. Similarly, sustained interest and activity in the NFT space can attract new capital and attention to digital assets. However, in the current market environment, where price discovery is paramount, these ecosystem developments might take a backseat unless they signal significant shifts in capital flow or adoption. The recent news regarding EUR/USD analysis and S&P 500 movements, while important for traditional markets, has indirect implications for crypto through overall risk sentiment. The fact that the Nasdaq is showing weakness could mean that speculative capital is retracting from riskier assets, which would naturally include cryptocurrencies.
Regulatory Crosshairs and Institutional Adoption
The regulatory environment remains a critical, albeit often unpredictable, factor for Bitcoin. News regarding potential regulatory crackdowns or, conversely, clearer frameworks for digital assets can significantly impact market sentiment and institutional adoption. While no specific regulatory news directly impacting BTCUSD was provided in the immediate feed, the general trend towards increased scrutiny from global financial bodies cannot be ignored. Any definitive regulatory clarity, whether positive or negative, could trigger substantial price movements. For instance, reports of regulatory bodies like the SEC taking a more defined stance on Bitcoin ETFs or other crypto-related products could significantly influence institutional interest. The current market sentiment, characterized by a cautious approach and mixed signals, suggests that the market might be waiting for more clarity on the regulatory front before committing to a strong directional bias.
Institutional adoption continues to be a key narrative for Bitcoin's long-term price potential. Developments such as increased allocations by investment funds, the integration of crypto services by traditional financial institutions, or the approval of Bitcoin-related financial products (like ETFs) can provide significant tailwinds. The current price action, hovering around $62,910 after a dip, suggests that institutional players might be accumulating at these levels, or perhaps taking profits after a previous rally. The correlation with traditional markets, particularly the tech-heavy Nasdaq, implies that institutional sentiment towards risk assets is a key driver. If institutions begin to perceive Bitcoin as a more established asset class, less sensitive to short-term market fluctuations and more as a digital gold or a long-term growth asset, it could lead to sustained buying pressure. However, the current mixed signals from equities suggest that institutional appetite for risk is currently being tested, which could temporarily slow down the pace of adoption.
Trade Scenarios: Charting the Path Forward
Bearish Scenario: Breakdown Below Key Support
65% ProbabilityNeutral Scenario: Consolidation Around $62,910
25% ProbabilityBullish Scenario: Reclaiming Higher Ground
10% ProbabilityThe Path Ahead: What to Watch Next
The immediate future for BTCUSD hinges on its ability to hold the $62,910 level and, more critically, the support at $62,099.33. A failure to do so, especially with the bearish signals on shorter timeframes and the broader risk-off sentiment in tech stocks, could trigger a swift move towards the lower support levels. The DXY's strength is a key variable to monitor; any signs of the dollar weakening could provide immediate relief and potential upside for Bitcoin. On the equity front, a sustained sell-off in the Nasdaq would likely translate into further downside pressure for BTCUSD. Conversely, if Bitcoin can reclaim the $64,000 level and consolidate above it, it would signal a potential shift in momentum, especially if confirmed by positive on-chain activity and a cooling of dollar strength. The ADX reading on the daily chart, suggesting a strong downtrend, remains a significant technical impediment to any substantial bullish moves until it shows signs of weakening or turning. Patience and risk management remain the most crucial tools for traders navigating this uncertain market environment.
Frequently Asked Questions: BTCUSD Analysis
What happens if BTCUSD breaks below the $62,099.33 support level?
A break below $62,099.33, especially on a daily close, would invalidate bullish short-term hopes and likely trigger a sell-off towards lower targets. The immediate next support sits at $60,367.67, with further downside potential to $59,416.33.
Should I buy BTCUSD at current levels around $62,910 given the mixed signals?
Buying at $62,910 carries significant risk due to bearish short-term indicators and macro headwinds. A more prudent approach might be to wait for a confirmed break above $64,782.33 resistance with increased volume, or a clear bounce from the $62,099.33 support level, which would present a better risk-reward setup.
Is the RSI at 41.59 on the 1H chart a sell signal for BTCUSD?
An RSI of 41.59 on the 1H chart is not an extreme oversold or overbought signal but indicates neutral momentum with a slight bearish lean. It suggests that buyers are not currently in control and further downside pressure is possible, especially if it dips closer to 30.
How might the DXY's strength around 101.15 affect BTCUSD this week?
The strong DXY at 101.15 exerts downward pressure on risk assets like BTCUSD. If the dollar continues to strengthen, it will likely cap any upside potential for Bitcoin and could contribute to further price declines unless other factors, such as positive on-chain data or a shift in Fed expectations, emerge.
| Indicator | Value | Signal | Interpretation |
|---|---|---|---|
| RSI (14) | 41.59 | Neutral | 41.59 on 1H suggests lack of buying pressure. |
| MACD Histogram | -921 | Bearish | Negative momentum on 1H. |
| Stochastic | K=17.54, D=13.35 | Bearish | Oversold on 1H, potential for bounce but lacks conviction. |
| ADX | 13.58 | Weak Trend | Lack of defined trend on 1H, market indecision. |
| Bollinger Bands | Middle Band | Bearish | Price below middle band on 1H, bearish bias. |
Track markets in real-time
AI-powered analysis, technical indicators and real-time price data.
Join Our Telegram Channel
Breaking market news, AI analysis and trading signals instantly.
Join Channel