The Dow Jones Industrial Average (DowJones30) has taken a significant hit, plunging below $46,924.50 as inflation concerns intensify. This move raises critical questions about the market's resilience and whether this is a temporary pullback or the beginning of a more prolonged bearish trend.
- DowJones30 fell below $46,924.50 amid rising inflation fears, marking a significant downturn.
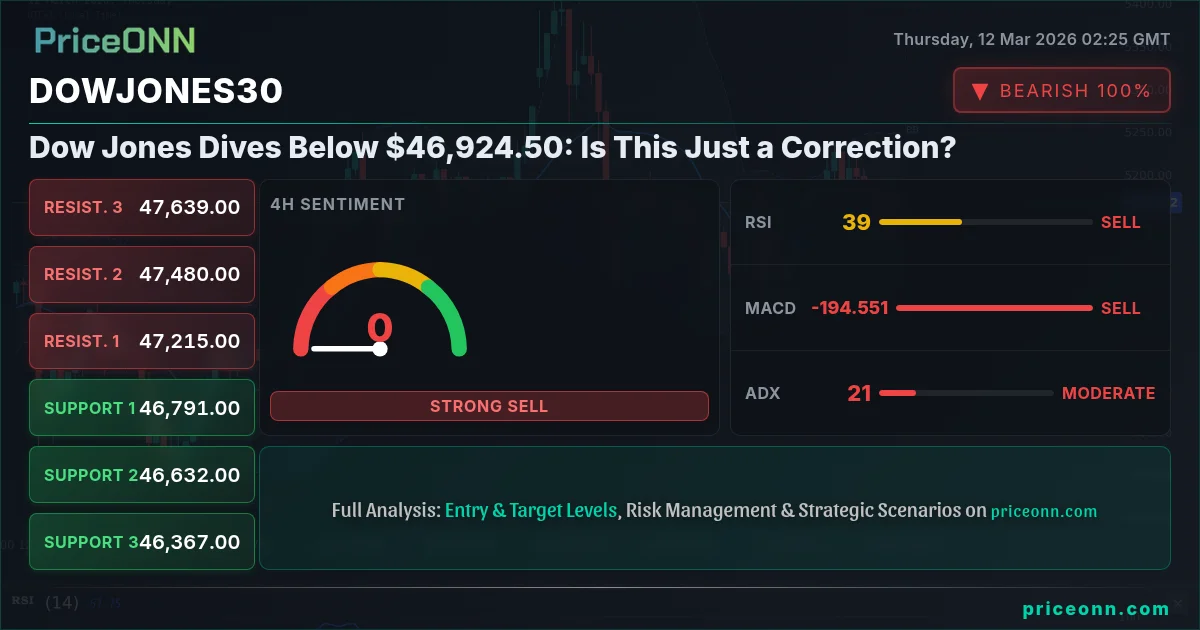
- RSI at 31.62 on the 1H chart suggests oversold conditions, but the strong downward trend may persist.
- Key support lies at 46,906.67, a break below which could trigger further losses.
- The DXY's strength at 99.17 is adding pressure on DowJones30, correlated with broader equity selloff.
Having tracked the DowJones30 through various economic cycles, the current situation presents a unique challenge. The combination of persistent inflation, rising interest rate expectations, and geopolitical tensions are creating a perfect storm for market volatility. The question now is whether the DowJones30 can find a foothold and rebound, or if the bears will continue to dominate.
Inflation Fears Grip Market: What's Driving the Sell-Off?
The primary catalyst for the Dow Jones' recent decline is the growing concern over inflation. Recent economic data has shown that inflation remains stubbornly high, defying expectations of a rapid decline. This has led to increased speculation that the Federal Reserve may need to take more aggressive action to curb rising prices, potentially including further interest rate hikes. According to Reuters, Fed officials have emphasized that inflation remains 'too high,' signaling a hawkish stance.
The energy sector is also playing a significant role. As reported on March 11, WTI crude is trading near $93.70, fueled by rising geopolitical tensions and concerns that energy price shocks will exacerbate inflation fears. This has a direct impact on companies within the DowJones30, particularly those in the transportation and manufacturing sectors, as higher energy costs squeeze profit margins.
Technical Breakdown: Key Levels to Watch
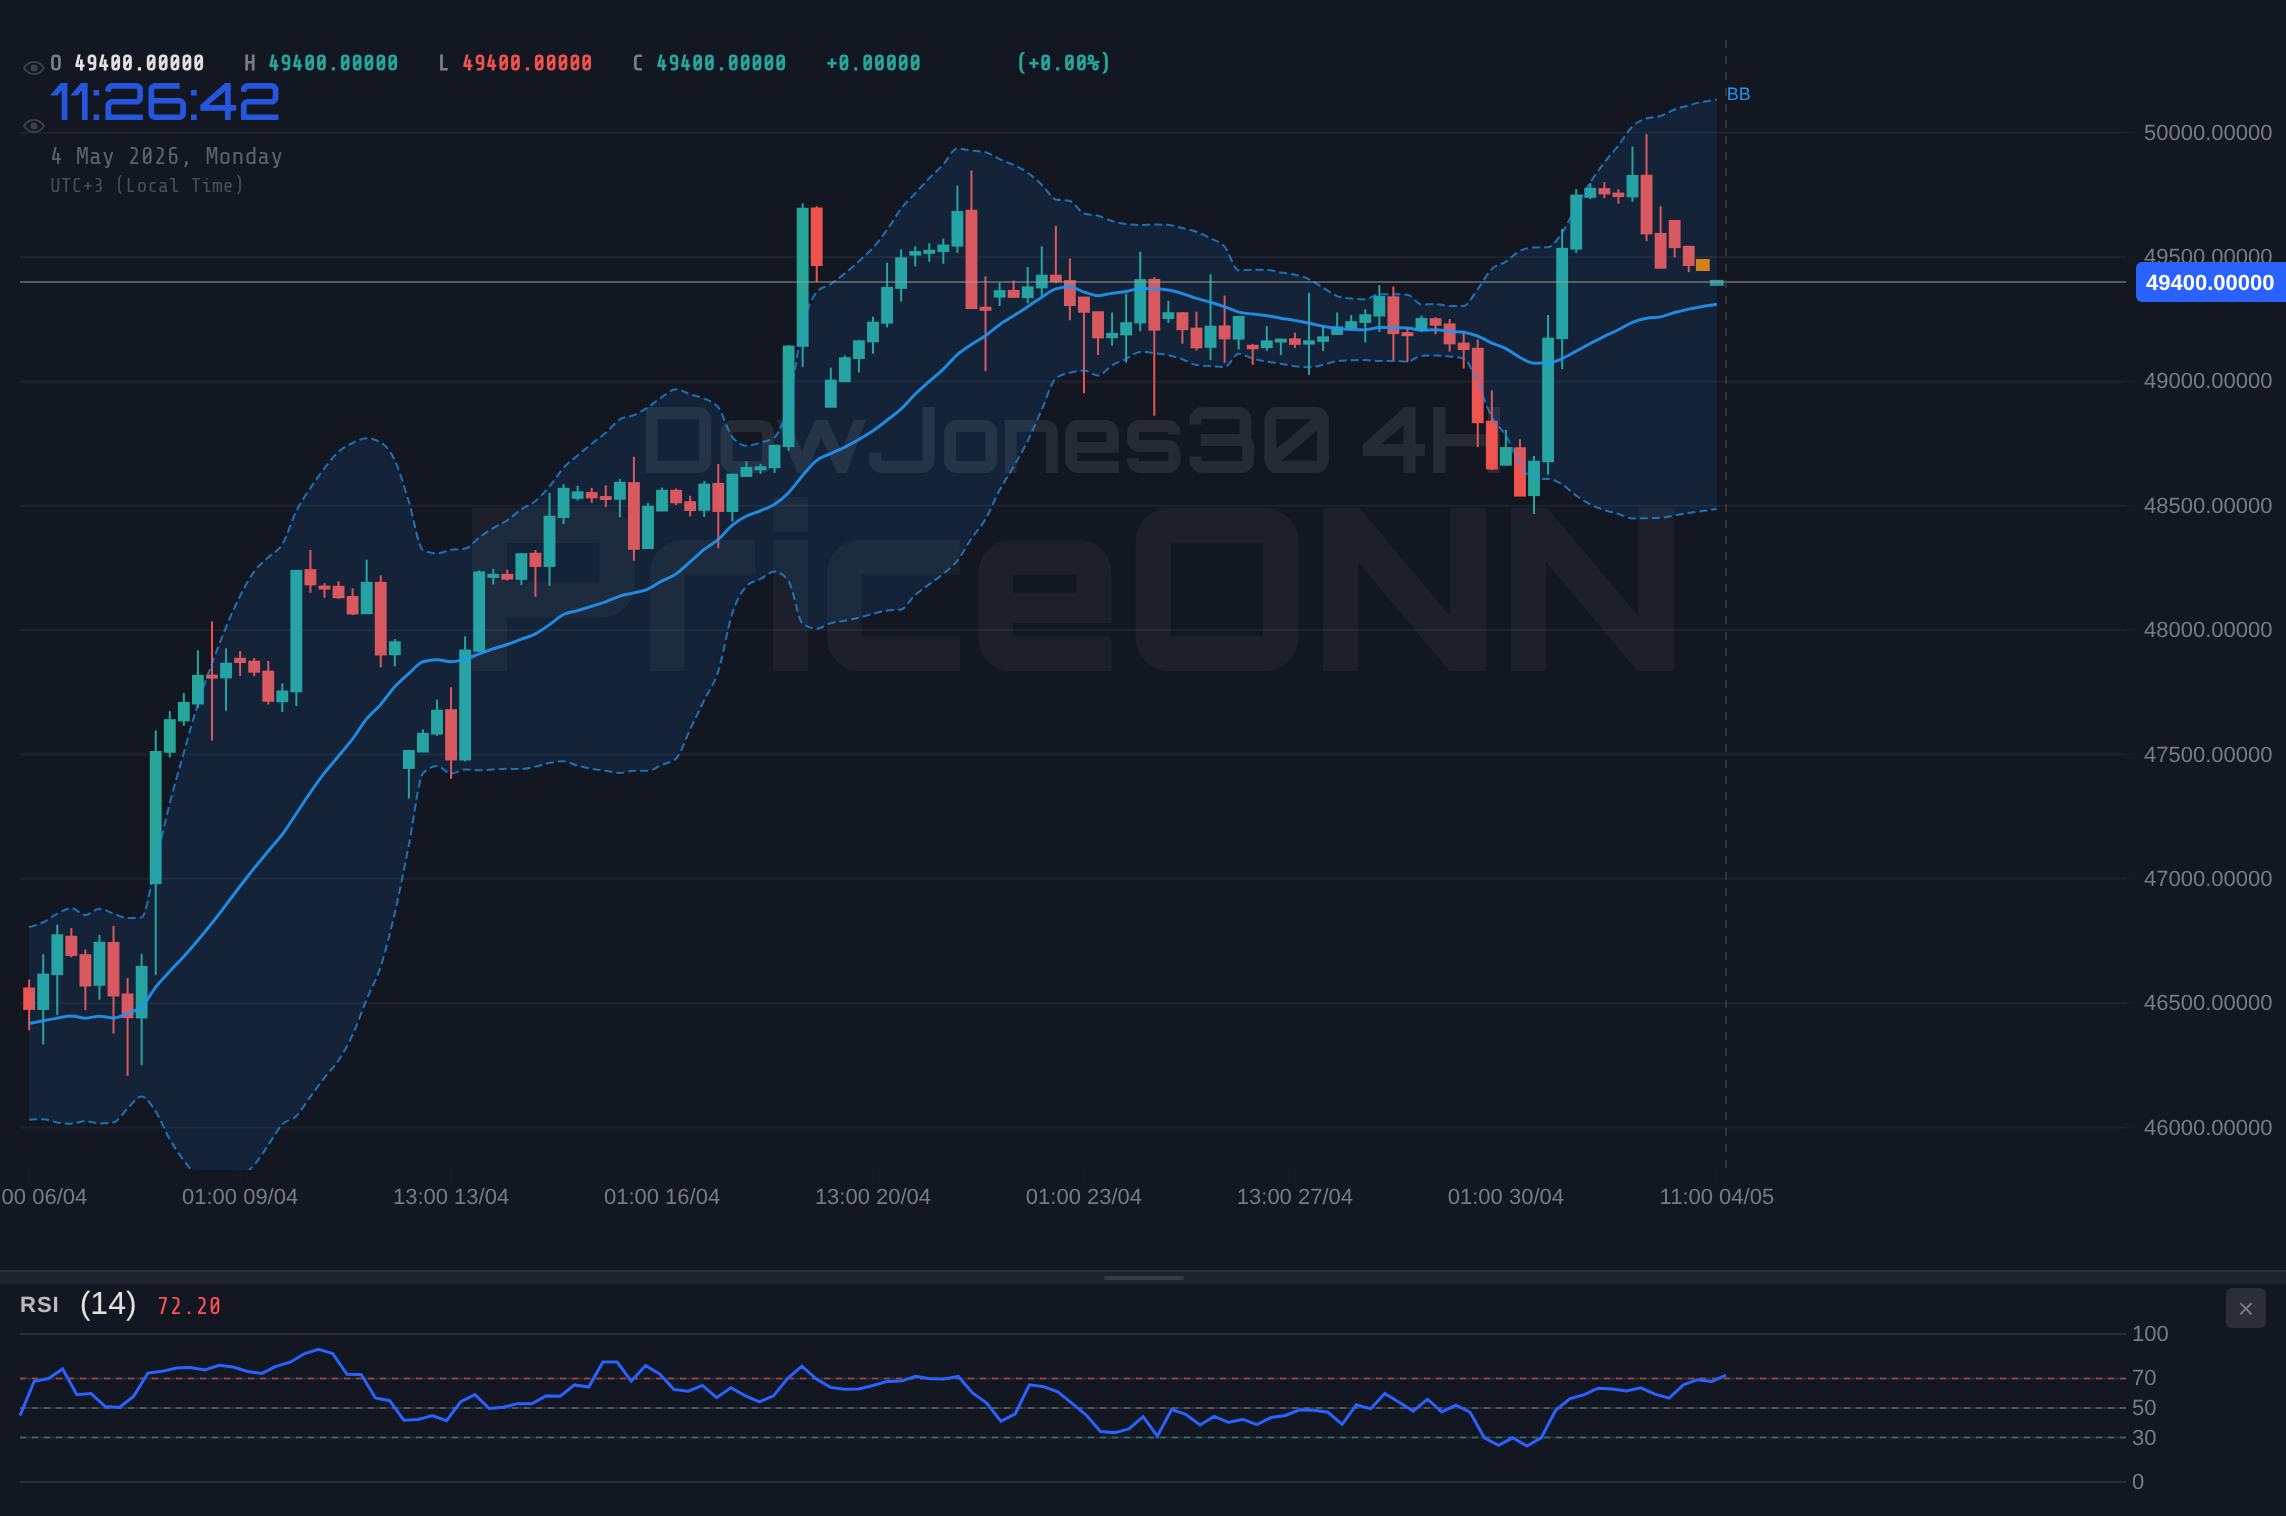
From a technical perspective, the DowJones30's break below $46,924.50 is a bearish signal. The index is now trading below its 200-day moving average, a key indicator of long-term trend direction. The 1-hour chart shows a strong downtrend, with the ADX at 23.52 indicating moderate trend strength. The RSI at 31.62 suggests that the market is approaching oversold conditions, which could lead to a short-term bounce. However, the overall trend remains bearish.
Key support levels to watch are 46,906.67, 46,835.33 and 46,773.67. A break below 46,906.67 could trigger further selling pressure, potentially leading to a test of lower support levels. On the upside, immediate resistance lies at 47,039.67, followed by 47,101.33 and 47,172.67. For the bulls to regain control, they need to push the price back above 47,172.67 and hold that level.
DXY Strength Adds Pressure
The strength of the U.S. dollar is also contributing to the Dow Jones' woes. The DXY (Dollar Index) is currently trading at 99.17, up 0.64% on the day. A stronger dollar makes U.S. exports more expensive, potentially hurting the earnings of multinational companies within the DowJones30. Historically, there's an inverse correlation; as the dollar strengthens, the DowJones30 tends to weaken, and vice versa. With DXY at 99.17, DowJones30 is under pressure.
The 1-hour chart for DXY shows the RSI in the overbought zone at 72.53, which may lead to a short-term pullback. However, the overall trend for the dollar remains bullish, which could continue to weigh on the Dow Jones.
The Bearish Scenario: Breakdown and Target Levels
The bearish scenario for the DowJones30 involves a continued sell-off driven by inflation fears and a strong dollar. If the index breaks below the immediate support at 46,906.67, the next target would be 46,835.33, followed by 46,773.67. A decisive break below 46,773.67 could open the door for a test of lower levels, potentially reaching 46,568.33, the daily support 2. This scenario has a probability of 60% given the current market conditions.
Continued sell-off driven by inflation fears and a strong dollar. If the index breaks below the immediate support at 46,906.67, the next target would be 46,835.33, followed by 46,773.67.
The Bullish Scenario: A Potential Rebound
Despite the current bearish sentiment, there is a possibility of a rebound. The RSI on the 1-hour chart is approaching oversold territory, which could lead to a short-term bounce. If the bulls can push the price back above 47,039.67, the next target would be 47,101.33, followed by 47,172.67. However, for this scenario to play out, there would need to be a shift in market sentiment, potentially driven by positive economic data or a dovish signal from the Federal Reserve. This scenario has a probability of 40%.
A rebound driven by oversold conditions and a potential shift in market sentiment. If the bulls can push the price back above 47,039.67, the next target would be 47,101.33, followed by 47,172.67.
Trade Plan: Navigating the Volatility
Given the current market conditions, a cautious approach is warranted. Traders should wait for confirmation of either the bullish or bearish scenario before initiating a position. For a bearish trade, the entry trigger would be a confirmed break below 46,906.67, with initial targets at 46,835.33 and 46,773.67. The invalidation level for this trade would be a move back above 47,039.67.
Economic Calendar: Key Events to Watch
Several key economic events could impact the DowJones30 in the coming days. On March 13 (Friday), there are multiple USD events scheduled. These data releases could provide further clues about the state of the U.S. economy and the Federal Reserve's future policy decisions. Traders should closely monitor these events and be prepared to adjust their positions accordingly.
The upcoming USD events on March 13 (Friday) could trigger significant volatility in the DowJones30. Traders should exercise caution and manage their risk accordingly.
Key Levels
Support Levels
Resistance Levels
Frequently Asked Questions: DowJones30 Analysis
What happens if DowJones30 breaks below $46,906.67 support?
If DowJones30 decisively breaks below the immediate support at $46,906.67, we can expect further selling pressure, potentially leading to a test of lower support levels at $46,835.33 and $46,773.67. This breakdown would confirm the bearish scenario driven by inflation fears.
Should I sell DowJones30 at current levels of $46,924.50 given the RSI at 31.62?
While the RSI at 31.62 on the 1H chart suggests oversold conditions, it is not a standalone sell signal. A more prudent approach would be to wait for a confirmed break below $46,906.67 before initiating a short position, managing risk with a stop-loss above $47,039.67.
Is the MACD signal on the 1H chart confirming the bearish trend for DowJones30?
Yes, the MACD on the 1H chart is showing negative momentum, with the MACD line below the signal line, further confirming the bearish trend. This adds confluence to the breakdown scenario, suggesting that the bears are currently in control.
How will the upcoming USD events on March 13 affect DowJones30 this week?
The upcoming USD events on March 13, particularly those related to inflation, could significantly impact the DowJones30. Stronger-than-expected inflation data could reinforce the hawkish Fed narrative, leading to further downside pressure on the index, while weaker data could trigger a relief rally.
Track markets in real-time
AI-powered analysis, technical indicators and real-time price data.
Join Our Telegram Channel
Breaking market news, AI analysis and trading signals instantly.
Join Channel