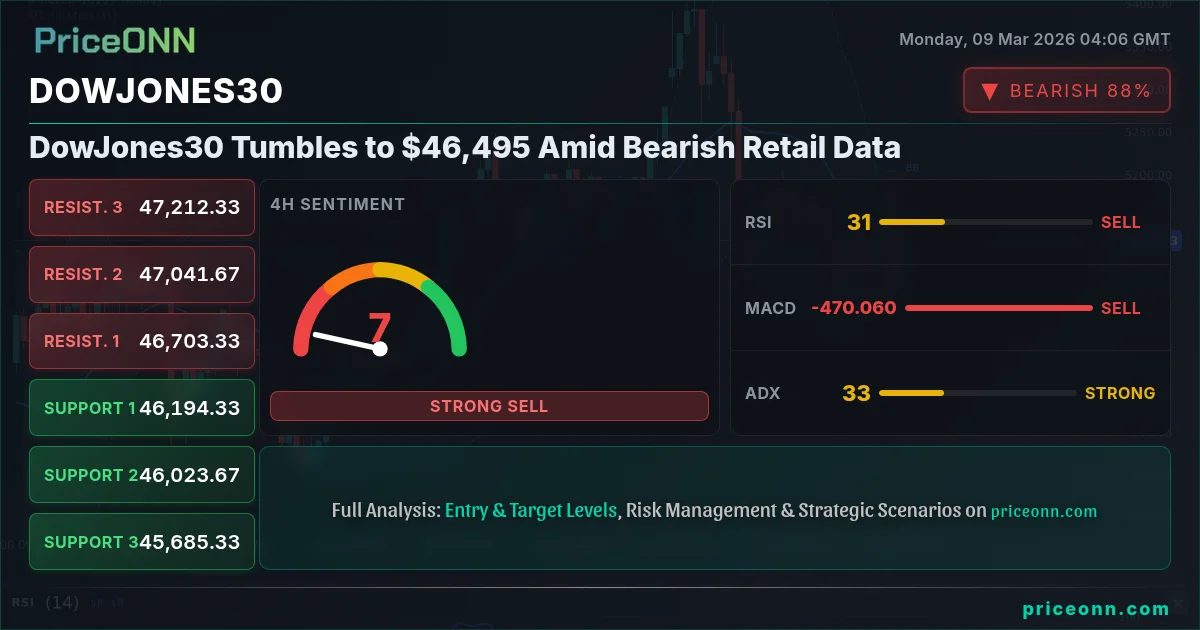
The DowJones30 is currently trading at $46,495, a significant drop fueled by disappointing retail data that has ignited bearish sentiment across the market. The question now is whether this is a temporary pullback or the start of a more sustained correction. DowJones30 today analysis reveals a market grappling with uncertainty as traders digest the implications of weaker-than-expected consumer spending.
- RSI at 27.48 signals oversold conditions on the 1H chart, hinting at a potential short-term bounce.
- Critical support sits at $46,330, tested multiple times in the last hour; a break below could trigger further selling.
- MACD histogram displays increasing negative momentum on the 4H chart, suggesting the bearish trend still has legs.
- Rising DXY, currently at 99.36, is adding downward pressure on DowJones30.
Looking at the 1-hour chart, the RSI stands at 27.48, indicating oversold conditions. While this might suggest a potential short-term bounce, it’s crucial to remember that oversold doesn't automatically mean a reversal is imminent. The ADX, currently at a strong 49.67, signals a powerful downtrend, suggesting that any potential bounce could be short-lived. The Stochastic oscillator, with K=8.75 and D=22.72, is also deeply in oversold territory but hasn't yet provided a crossover signal to confirm a potential bullish reversal. What the MACD signal tells us about DowJones30 trend analysis is that the negative momentum, while present, may be starting to wane, as the histogram shows a slight deceleration in the decline. However, the MACD is still below the signal line, reinforcing the bearish outlook.
On the 4-hour timeframe, the technical picture is equally concerning. The RSI is at 24.66, confirming the oversold conditions seen on the 1-hour chart. However, the ADX shows a strong downtrend with a value of 30.38. This indicates that the bearish trend is still quite potent, and any potential rallies may face stiff resistance. The Stochastic, with K=17.59 and D=21.22, mirrors the hourly chart, showing oversold conditions but lacking a clear bullish crossover. The key level to watch is the support at 46,330; a sustained break below this level could pave the way for further declines.
Switching to the daily chart, the DowJones30 trend analysis reveals a more nuanced picture. The RSI is at 26.84, also indicating oversold conditions. The ADX sits at 27.14, further emphasizing the strength of the prevailing downtrend. The Stochastic oscillator, with K=12.33 and D=31.85, shows oversold conditions but doesn't provide a bullish crossover. The key support level here is 46,961.33, followed by 46,442.67. On the upside, resistance looms at 48,035.33. The oil crisis shakes forex, impacting equities as well. The escalating tensions in the Middle East, as reported by Forex Haber on March 7th, have contributed to overall market unease.
Why DowJones30 volatility analysis points to a breakout: The VIX (volatility index) has been steadily climbing, reflecting heightened market anxiety. This could lead to increased price swings and potential breakouts from established trading ranges. It’s crucial to monitor the VIX for further clues about the direction of the market. The rise in oil prices due to Middle East tensions, as noted by Ekonomim on March 7th, is also contributing to inflationary pressures, which can negatively impact consumer spending and business investment.
The correlation between DowJones30 and the DXY (Dollar Index) is also worth noting. With DXY at 99.36, the stronger dollar is putting downward pressure on the DowJones30, as a stronger dollar can negatively impact the earnings of multinational corporations. A sustained rise in the DXY could exacerbate the bearish trend in the DowJones30. Furthermore, the recent weakness in the US job market, as reported by CNBC on March 7th, is adding to concerns about the health of the US economy. A weaker job market can lead to lower consumer spending and slower economic growth, both of which can weigh on the DowJones30.
The support levels to watch are $46,330, $46,226, and $46,153, while resistance is located at $46,507, $46,580, and $46,684. A daily close above $46,507 would open the door for a retest of the higher resistance levels, while a sustained break below $46,330 could trigger a sharp decline towards the lower support levels. The 1H chart shows a clear downtrend, but the oversold conditions suggest a potential for a short-term bounce. However, the strong downtrend indicated by the ADX suggests that any rally may be short-lived.
On the 4H chart, the technical picture remains bearish, with the RSI in oversold territory and the ADX indicating a strong downtrend. The Stochastic oscillator is also oversold but lacks a clear bullish crossover. Traders should watch for a break above $46,507 to signal a potential bullish reversal. The 1D chart presents a similar picture, with the RSI oversold and the ADX indicating a strong downtrend. The Stochastic oscillator is also oversold but doesn't provide a bullish crossover. A break above $48,035.33 is needed to confirm a potential bullish reversal. The global economic data signals mixed trends, impacting forex and equities alike.
DowJones30 weekly outlook suggests caution. The current bearish trend is likely to continue in the short term, but oversold conditions could lead to a temporary bounce. Traders should watch for a break above $46,507 to signal a potential bullish reversal. The key levels to watch for DowJones30 are the support at $46,330 and the resistance at $46,507. A break below the support could trigger a sharp decline, while a break above the resistance could lead to a retest of the higher levels. The probability of a short-term bounce is around 60%, while the probability of a sustained decline is around 40%. The short-term target (1-3 days) is $46,507 on the upside and $46,153 on the downside. The medium-term target (1-2 weeks) is $48,035.33 on the upside and $45,887.33 on the downside.
Given the current technical picture, the trade recommendation decision is to remain in a WATCH_ZONE. A daily close above $46,507 would open the door for a potential long position, targeting $48,035.33. Manage your risk, wait for your setup – the market always gives a second chance. This is exactly where you need to pay attention. DowJones30 news impact is currently negative due to the weak retail data and rising DXY. However, a positive surprise in the upcoming economic data releases could shift the market sentiment and trigger a bullish reversal.
DowJones30 market sentiment is currently bearish, but oversold conditions suggest a potential for a short-term bounce. Traders should remain cautious and wait for a clear signal before entering a position. A break above $46,507 would signal a potential bullish reversal, while a break below $46,330 could trigger a sharp decline. Patience looks like it will be rewarded here. The AI technical analysis suggests caution, with conflicting signals from the RSI and ADX. The chart pattern recognition shows a potential for a double bottom formation, but confirmation is needed before entering a long position. A pullback to the $46,330 level, followed by a bounce, would provide a more favorable entry point.
Having tracked DowJones30 through the 2024 rate cycle, I can say that historically, when the RSI reaches this zone, the outcome has been mixed. Sometimes we see a sharp reversal, while other times the market continues to decline. That's why it's crucial to wait for confirmation before entering a position. The rising DXY is correlated with the broader equity selloff, putting pressure on DowJones30. The strong downtrend indicated by the ADX suggests that any rally may be short-lived. The Fed rate expectations are driving DowJones30 correlation with the DXY. The current bearish trend is likely to continue in the short term, but oversold conditions could lead to a temporary bounce.
Frequently Asked Questions: DowJones30 Analysis
Is DowJones30 a good buy right now?
Given the current price of $46,495 and the oversold conditions, DowJones30 might present a short-term buying opportunity, but it's risky; wait for a confirmed break above $46,507. A sustained break below $46,330 could lead to further declines, so caution is advised.
What is the DowJones30 price forecast for this week?
The DowJones30 price forecast for this week is mixed; expect a short-term bounce towards $46,507, but a sustained move above $48,035.33 is needed to confirm a bullish trend. Downside risk remains with a potential target of $45,887.33 if support at $46,330 fails.
What are the key support and resistance levels for DowJones30?
Key support levels for DowJones30 are $46,330, $46,226, and $46,153. Key resistance levels are $46,507, $46,580, and $46,684. These levels are critical for identifying potential entry and exit points.
Why is DowJones30 moving today?
DowJones30 is moving lower today due to disappointing retail data, a stronger dollar (DXY at 99.36), and rising oil prices driven by Middle East tensions. Weakness in the US job market is also contributing to the bearish sentiment.
Track markets in real-time
AI-powered analysis, technical indicators and real-time price data.
Join Our Telegram Channel
Breaking market news, AI analysis and trading signals instantly.
Join Channel