WTI Soars 15% to $90.66 Amid Middle East Tensions; What's Next?
WTI crude oil surged 15% last week, closing at $90.66 amid escalating Middle East tensions. Traders eye key levels and upcoming economic data for the next move.
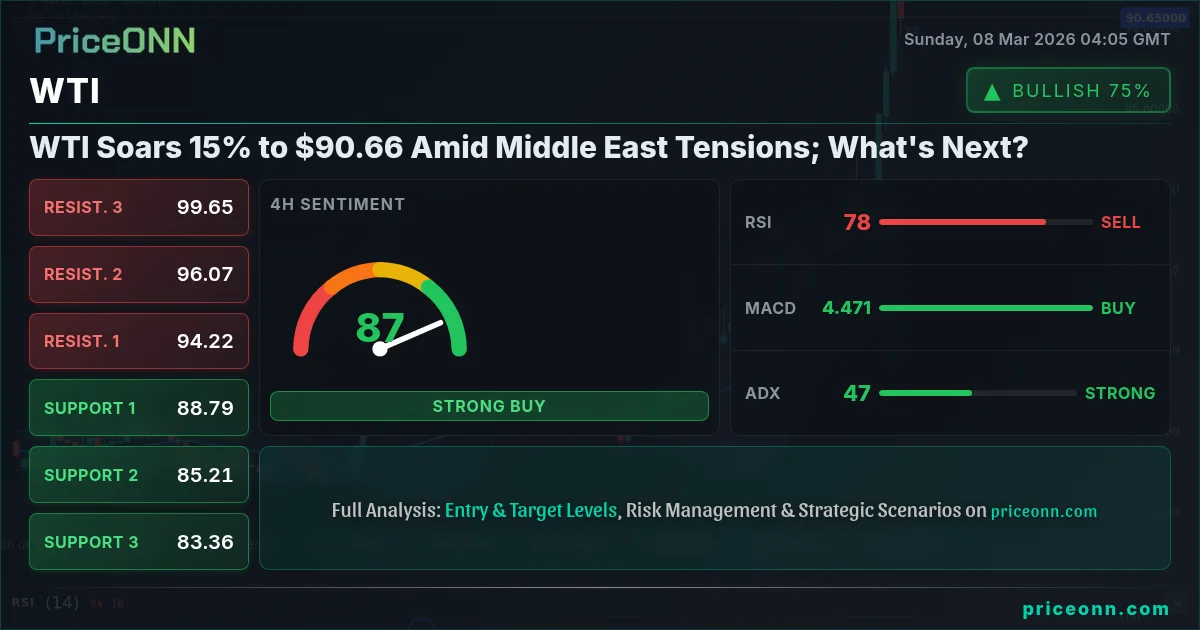
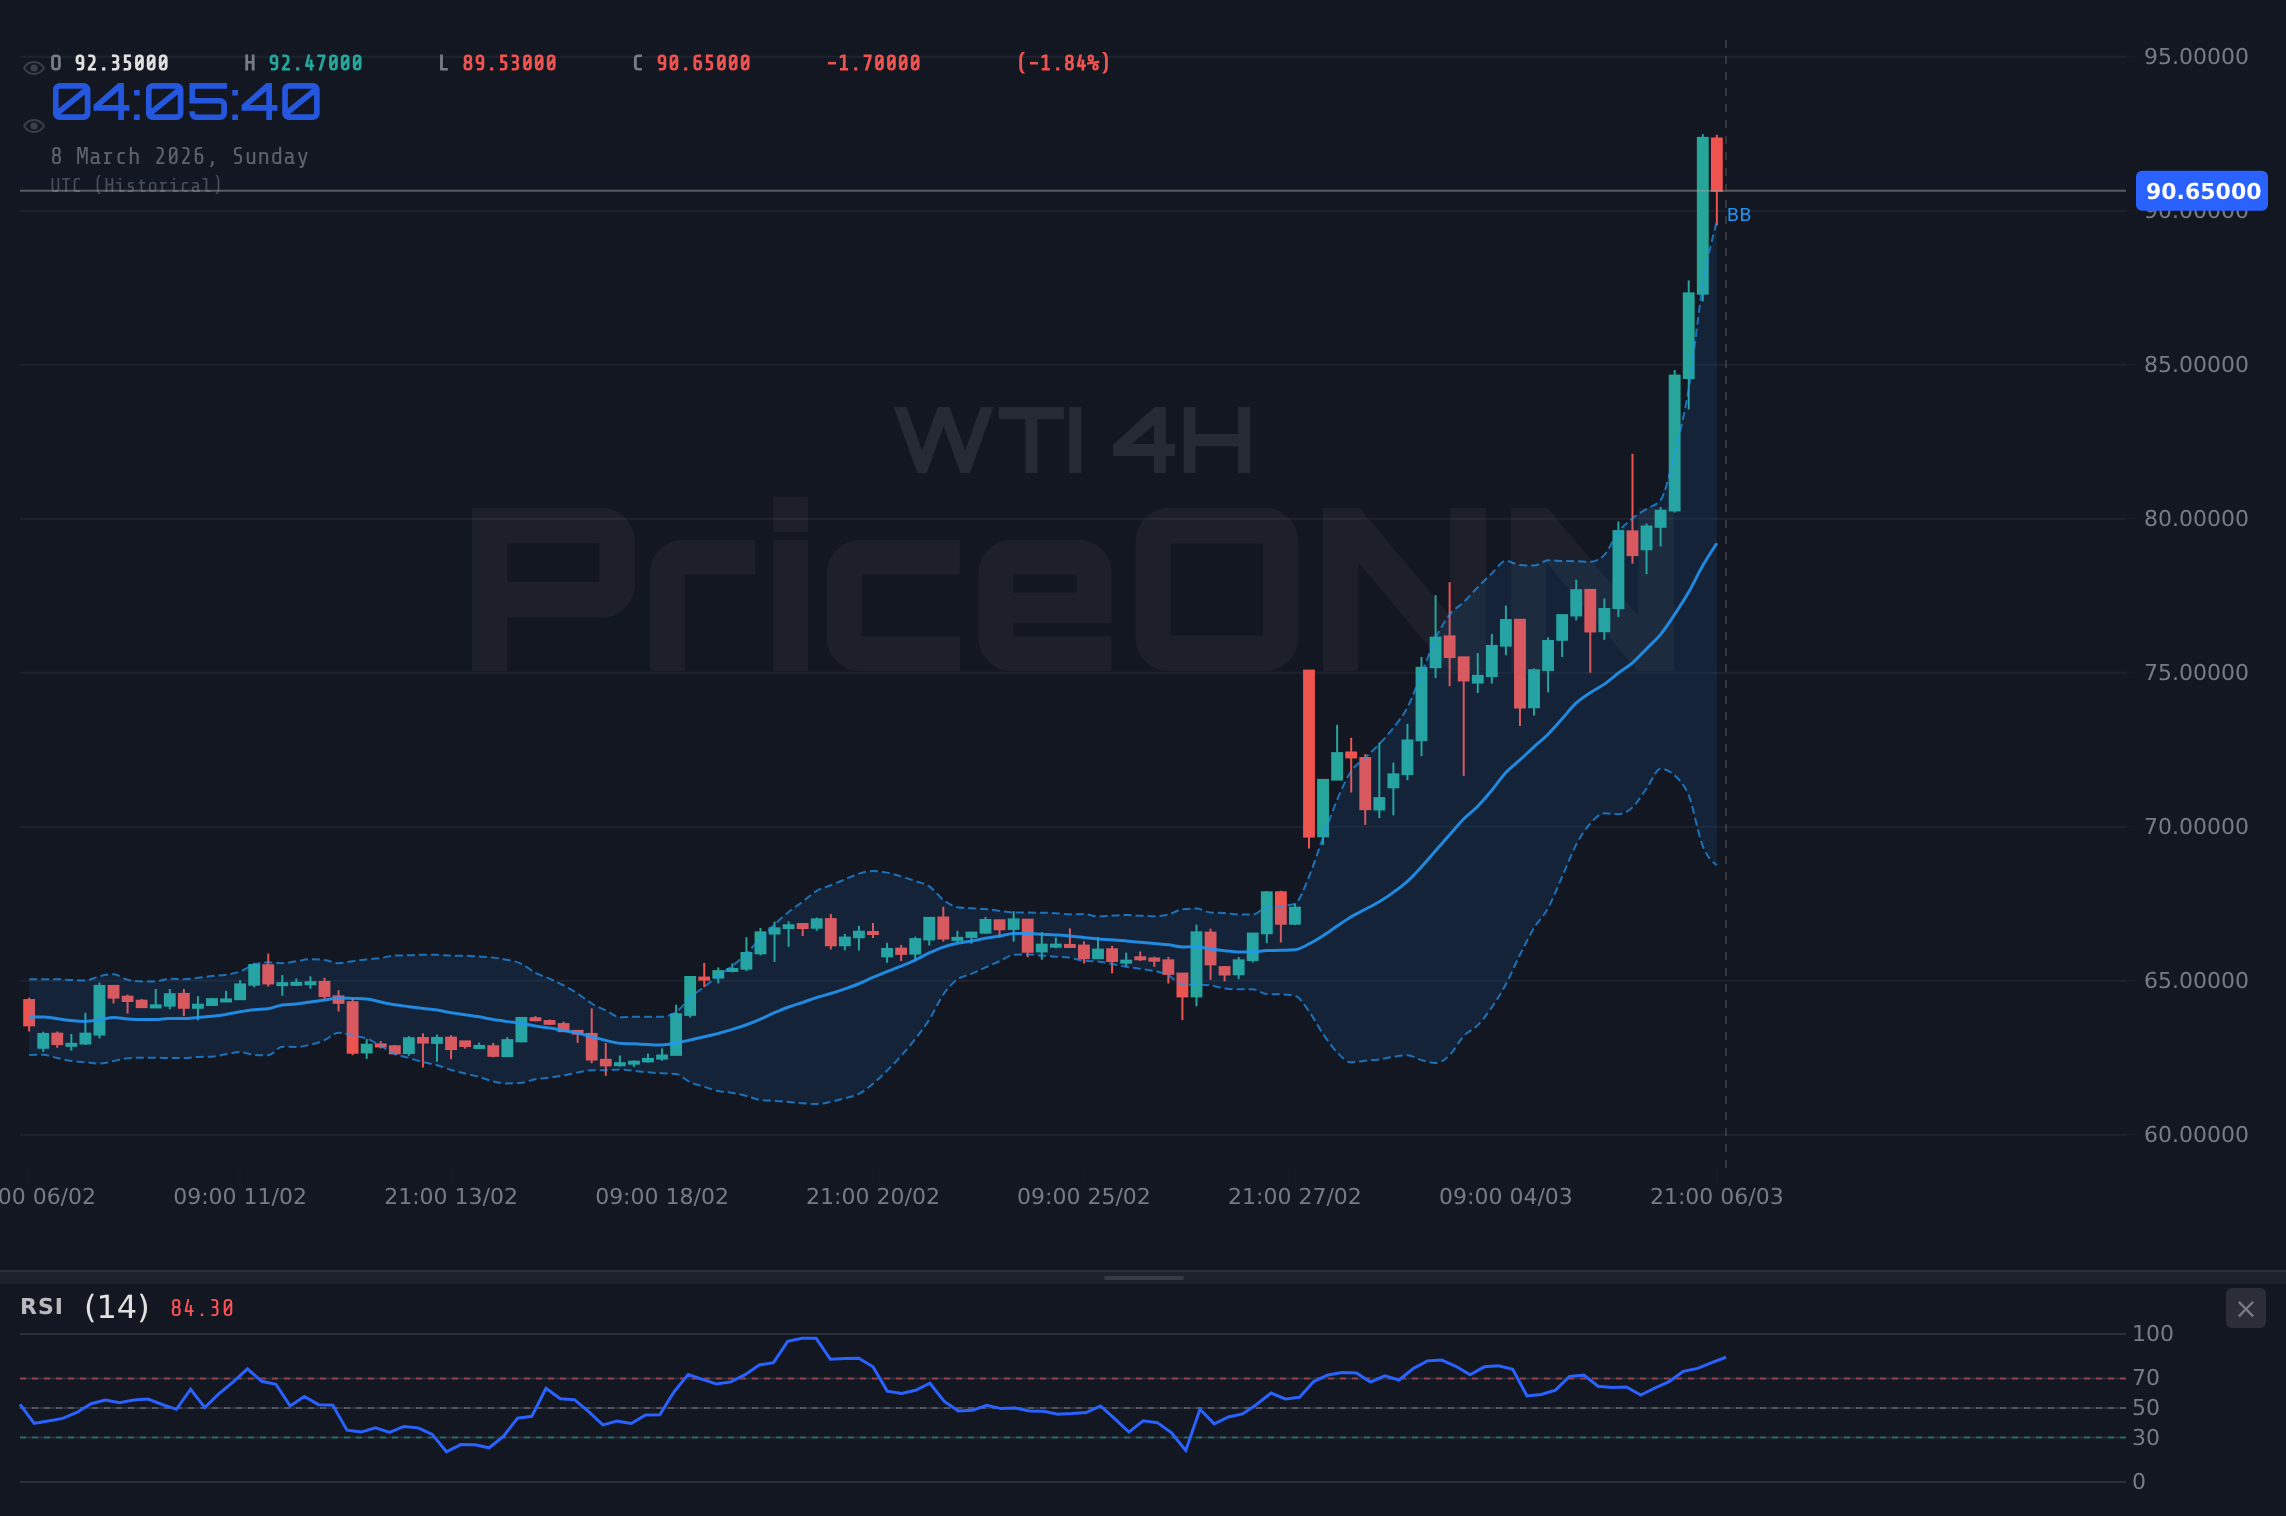
WTI crude oil just delivered a powerful punch, surging 15% last week to close at $90.66. This explosive move, fueled by escalating tensions in the Middle East, has traders scrambling to reassess their outlook. But is this the start of a sustained rally, or a short-term spike destined to fizzle out? That's the million-dollar question, and the answer lies in a careful analysis of technical levels, fundamental drivers, and market sentiment.
- WTI closed last week at $90.66, marking a 15% surge driven by geopolitical tensions.
- RSI at 88.86 on the daily chart signals overbought conditions, suggesting potential for a pullback.
- Key resistance lies at $92.84 (1H chart), a break above which could signal further upside.
- Middle East conflict and potential supply disruptions are driving WTI's correlation with safe-haven demand.
Oil Crisis Shakes Forex: The EUR/CAD Connection
The surge in oil prices isn't just impacting the energy sector- it's sending ripples through the forex market. As reported by PriceONN, the escalating oil crisis, triggered by Middle East tensions, is sending shockwaves through forex markets with EUR/CAD under significant downward pressure. This is largely due to Canada’s strong correlation with oil prices, making the Canadian dollar a beneficiary of the current situation. This highlights the complex interplay between commodity markets and currency valuations, a dynamic that forex traders need to closely monitor. The question now is whether this trend will continue or if we will see a correction. The rise in WTI to $90.66 is also impacting other currencies, making this a widespread issue that needs to be addressed.
Why $92.84 is the Line in the Sand
From a technical perspective, the immediate level to watch is the $92.84 resistance on the 1-hour chart. This level represents a significant hurdle for the bulls. A decisive break above this resistance could pave the way for further gains, potentially targeting the $94.13 and $95.78 levels. However, failure to breach $92.84 could signal a potential pullback, with initial support at $89.90. The RSI on the 1-hour chart is currently at 75.97, indicating overbought conditions. While this doesn't necessarily mean an immediate reversal, it does suggest that the market may be due for a breather. Traders should be wary of chasing the rally at these levels and instead, look for potential pullback opportunities or await a confirmed breakout above $92.84.
The Bearish Counterpoint: Is a Pullback Imminent?
While the bullish momentum is undeniable, it's crucial to consider the bearish counterpoint. The daily RSI reading of 88.86 is a flashing warning sign. Historically, such elevated RSI levels have often preceded significant pullbacks in WTI. Furthermore, the stochastic oscillator on the daily chart is showing a bearish crossover, with K=87.44 and D=79.24, further reinforcing the potential for a correction. If the geopolitical tensions ease, or if there are signs of increased oil production, we could see a sharp reversal in WTI prices. The key support level to watch in this scenario is $89.90. A break below this level could trigger a deeper correction, potentially targeting the $88.25 and $86.96 levels.
Multi-Timeframe Analysis: Conflicting Signals Emerge
A multi-timeframe analysis reveals conflicting signals. On the 1-hour chart, the trend is neutral, but the ADX is weak at 19.03. This suggests that the short-term rally may be losing steam. However, on the 4-hour chart, the trend is bullish, and the ADX is stronger at 47.92, indicating a more sustained uptrend. The daily chart also shows a bullish trend with an ADX of 37.08, but the overbought RSI and bearish stochastic crossover warrant caution. This conflicting picture highlights the need for a nuanced approach, combining technical analysis with fundamental awareness. Scalpers may look for short-term pullback opportunities, while swing traders may await a confirmed breakout above $92.84 before initiating long positions. Long-term investors, on the other hand, may view any pullback as a buying opportunity, given the favorable long-term outlook for oil prices.
The Middle East Wildcard: Geopolitical Risk Premiums
The current surge in WTI prices is largely attributed to escalating tensions in the Middle East. The potential for supply disruptions is injecting a significant geopolitical risk premium into oil prices. As reported by PriceONN, the Middle East conflict is driving oil surge, and Qatar’s Kaabi expects oil price to surge to $150/barrel amid Iran conflicts. This underscores the sensitivity of oil prices to geopolitical events and the potential for sudden and dramatic price swings. Traders need to closely monitor the news flow and assess the evolving geopolitical landscape to gauge the sustainability of the current rally. A de-escalation of tensions could lead to a sharp reversal, while further escalation could fuel even higher prices.
The DXY Factor: Dollar Strength Weighs on WTI
The Dollar Index (DXY) is another crucial factor to consider. Currently, the DXY is trading at 98.57, showing a slight downward pressure. In general, a stronger dollar tends to weigh on commodity prices, including oil, as it makes them more expensive for buyers using other currencies. However, in the current environment, the geopolitical risk premium is overriding the negative impact of a stronger dollar. If the DXY were to strengthen significantly, it could put downward pressure on WTI prices, potentially exacerbating any technical pullback. Therefore, traders need to monitor the DXY closely and assess its potential impact on WTI.
Economic Data in Focus: Upcoming Catalysts to Watch
Several key economic data releases could influence WTI prices in the coming week. While there is no actual data for the USA as of 2026-03-05 or 2026-03-06, traders will be focused on future releases. On March 10th, traders will be watching the US data closely. Any surprises in these releases could trigger significant volatility in WTI prices. For example, stronger-than-expected data could support the dollar and put downward pressure on oil, while weaker-than-expected data could have the opposite effect. Traders should prepare for potential volatility around these data releases and adjust their positions accordingly. The market is pricing in a high degree of uncertainty, and any surprises could lead to sharp price swings.
Trade Recommendation: Watch Zone - Awaiting Confirmation
Given the conflicting signals and the high degree of uncertainty, our trade recommendation for WTI is to remain in a watch zone. A daily close above $92.84 would open the door for a test of $94.13 and potentially $95.78. Conversely, a break below $89.90 would signal a potential pullback towards $88.25 and $86.96. Traders should await confirmation of either of these scenarios before initiating new positions. The market is currently in a state of flux, and patience is likely to be rewarded. Manage your risk, wait for your setup- the market always gives a second chance.
Frequently Asked Questions: WTI Analysis
Is WTI a good buy right now?
Given the current price of $90.66 and the overbought RSI on the daily chart, WTI is not a clear buy right now. A more attractive entry point might be found on a pullback towards the $88.25 support level, or on a confirmed breakout above the $92.84 resistance.
What is the WTI price forecast for this week?
The WTI price forecast for this week is highly dependent on geopolitical developments and economic data releases. A bullish scenario, with a 60% probability, targets $92.84 and potentially $94.13. A bearish scenario, with a 40% probability, targets $88.25 and potentially $86.96.
What are the key support and resistance levels for WTI?
Key support levels for WTI are $89.90, $88.25, and $86.96. Key resistance levels are $92.84, $94.13, and $95.78. These levels represent potential areas of price consolidation or reversal.
Why is WTI moving today?
WTI is moving today primarily due to escalating tensions in the Middle East, which are raising concerns about potential supply disruptions. This geopolitical risk premium is overriding other factors, such as the stronger dollar.
Volatility creates opportunity- those prepared will be rewarded.
Technical Outlook Summary
| Indicator | Value | Signal |
|---|---|---|
| RSI (14) | 75.97 | Overbought |
| MACD Histogram | Positive | Bullish |
| Stochastic | 89.09/93.28 | Overbought |
| ADX | 47.92 | Strong Trend |
| Bollinger | Upper Band | Watch |
Key Levels
Support Levels
Resistance Levels
Track markets in real-time
AI-powered analysis, technical indicators and real-time price data.
Join Our Telegram Channel
Breaking market news, AI analysis and trading signals instantly.
Join Channel