WTI at $90.66: Is the Weekly Surge Sustainable Amid Trade Data?
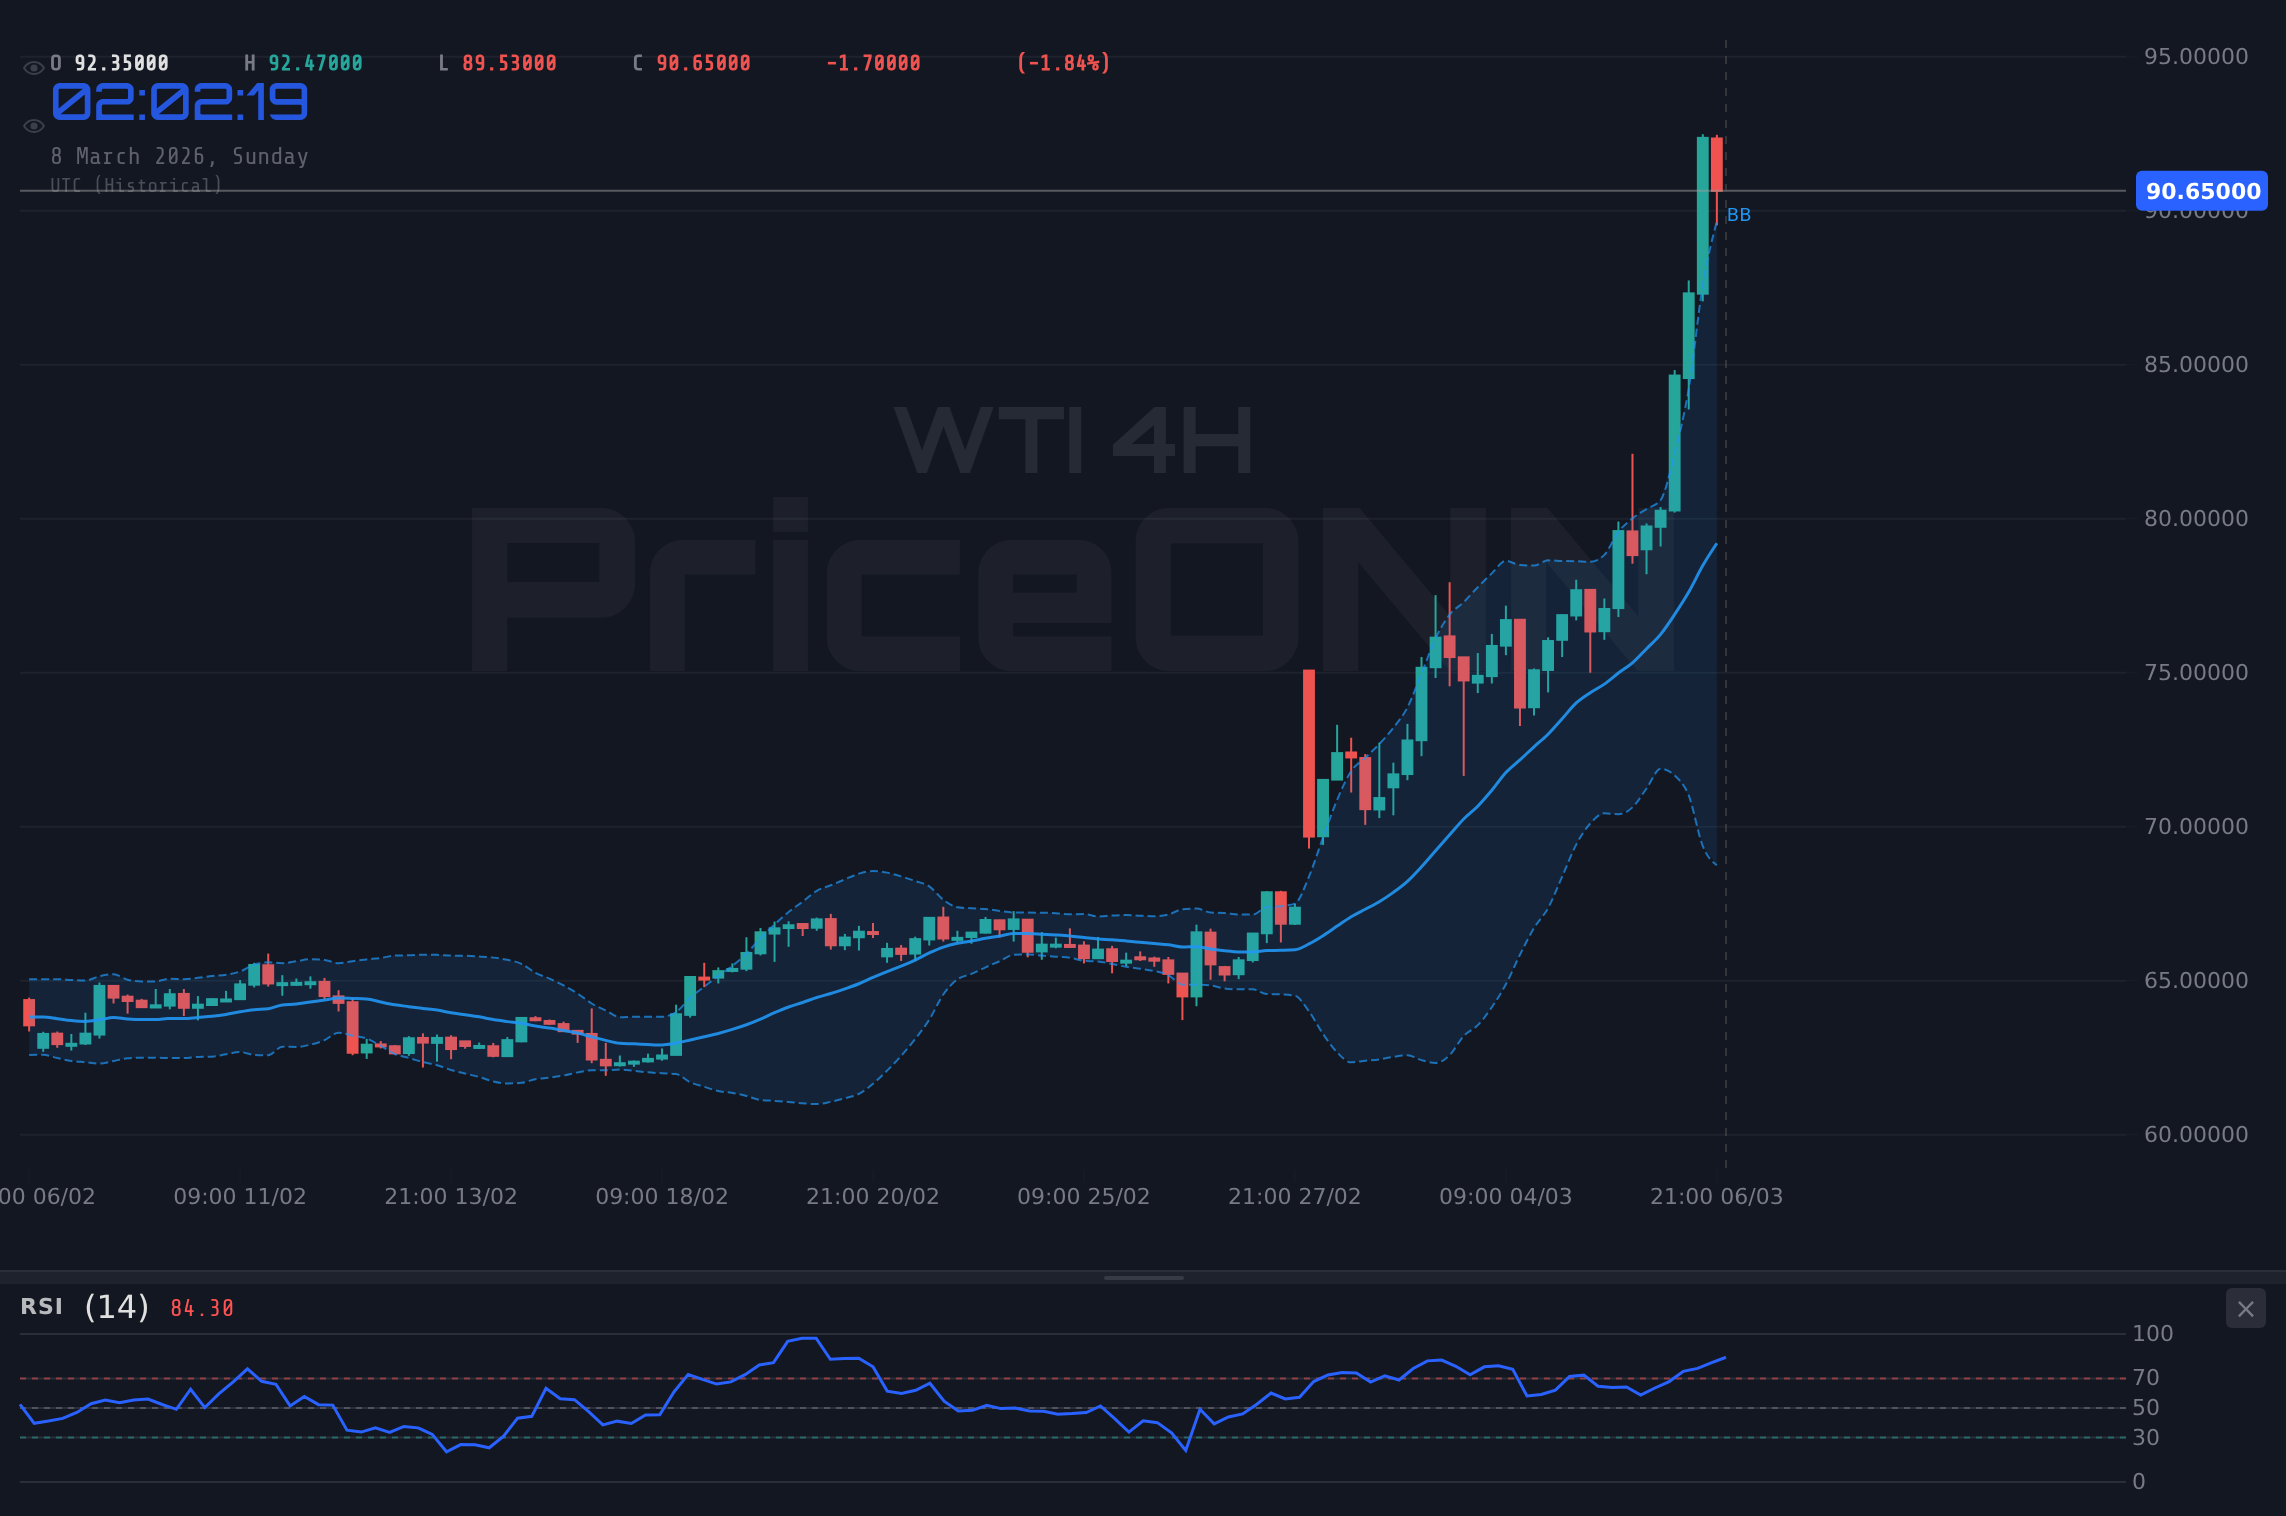
WTI crude closed last Friday at $90.66, marking a significant weekly surge. Traders are now watching incoming trade data for clues about the sustainability of this rally.
WTI crude oil closed last Friday at $90.66, a notable jump that has traders assessing the factors driving this surge and whether it can be sustained in the coming week. The market's attention is now focused on upcoming trade data releases and geopolitical developments that could either reinforce or undermine this recent bullish momentum.
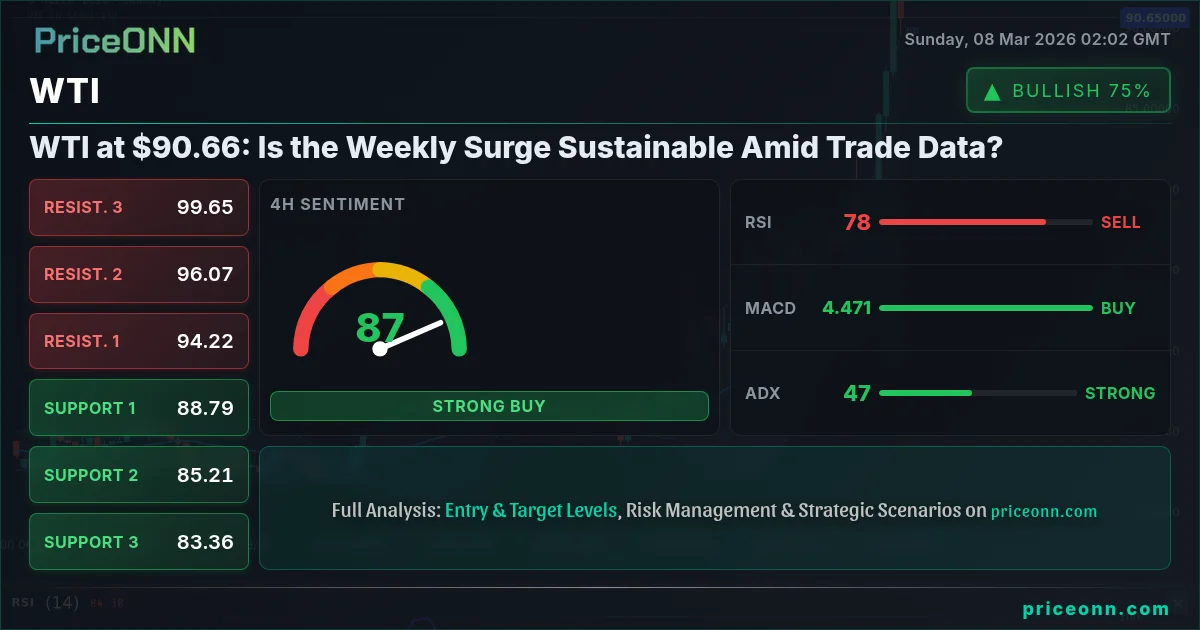
- WTI closed at $90.66, signaling a strong bullish close to the week.
- RSI at 75.97 on the 1H chart indicates overbought conditions, suggesting potential for a short-term pullback.
- Key support level to watch is $89.9, a break below which could signal a trend reversal.
- Strong ADX reading of 47.92 on the 1H chart confirms the strength of the current uptrend but also warrants caution.
The recent surge in WTI prices can be attributed to a combination of factors, including escalating tensions in the Middle East and supply concerns. The market is particularly sensitive to disruptions in global energy flows, as evidenced by PriceONN's recent report on Middle East conflicts driving oil prices higher. However, with the 1H RSI at 75.97, WTI is entering overbought territory, suggesting that a period of consolidation or a short-term pullback may be imminent. The question now is whether the underlying bullish drivers are strong enough to overcome this technical hurdle.
From a technical perspective, WTI's performance across different timeframes presents a mixed picture. On the 1H chart, the trend is neutral, but the ADX at 19.03 suggests a weak trend, indicating that the recent surge may lack conviction. The Stochastic oscillator, with K=90.49 and D=81.87, is also in overbought territory, further supporting the possibility of a short-term correction. However, the 4H and 1D charts paint a more bullish picture, with both showing upward trends and positive momentum. The 4H ADX is at 13.59 and the 1D ADX is at 28.64, indicating a stronger trend on the daily timeframe. This multi-timeframe analysis suggests that while a short-term pullback is possible, the overall trend remains bullish.
One key level to watch in the short term is the support at $89.9 on the 1H chart. A break below this level could signal a trend reversal and open the door for a deeper correction towards the next support at $88.25. On the upside, immediate resistance lies at $92.84. A sustained break above this level would confirm the bullish trend and pave the way for further gains towards $94.13 and beyond. The overall signal from the 1H timeframe is AL, suggesting that the bulls still have the upper hand, but caution is warranted given the overbought conditions.
Looking at the 4H timeframe, the key support level is $84.67. The RSI is at 83.61, which is in overbought territory. This adds further weight to the possibility of a short-term correction. However, the MACD is showing positive momentum, indicating that the bulls are still in control. The key resistance level on the 4H chart is $88.86. A break above this level would confirm the bullish trend and pave the way for further gains towards $90.39. The overall signal from the 4H timeframe is AL, suggesting that the bulls still have the upper hand.
On the 1D timeframe, the key support level is $75.18. The RSI is at 88.86, which is in overbought territory. This adds further weight to the possibility of a short-term correction. However, the MACD is showing positive momentum, indicating that the bulls are still in control. The key resistance level on the 1D chart is $82.29. A break above this level would confirm the bullish trend and pave the way for further gains towards $85.75. The overall signal from the 1D timeframe is AL, suggesting that the bulls still have the upper hand.
From a fundamental standpoint, the oil market is currently being driven by geopolitical risks and supply concerns. As reported by PriceONN, tensions in the Middle East are contributing to the upward pressure on oil prices. The potential for further disruptions to global energy flows remains a key factor to watch in the coming week. In addition, economic data releases, such as the U.S. weekly economic & financial commentary, will provide insights into the health of the global economy and its impact on oil demand. The market will also be closely monitoring the JPY data release scheduled for Monday, March 9, as well as the USD and EUR data releases scheduled for Tuesday, March 10, and Wednesday, March 11, respectively.
The correlation between WTI and other asset classes is also worth noting. Typically, a stronger dollar, as measured by the DXY, puts downward pressure on oil prices. However, the current market dynamics suggest that geopolitical risks and supply concerns are overriding this traditional relationship. With the DXY at 98.57, the strength in the dollar may eventually weigh on WTI prices, but the timing and magnitude of this impact remain uncertain. The SP500 and Nasdaq100 are both showing downward trends, which may put downward pressure on WTI prices. The DowJones30 is also showing a downward trend, which may put downward pressure on WTI prices.
Given the mixed technical signals and the complex interplay of fundamental factors, a neutral stance on WTI appears warranted at this time. While the overall trend remains bullish, the overbought conditions and the potential for a short-term correction suggest that caution is advised. Traders should closely monitor the key support and resistance levels outlined above and be prepared to adjust their positions based on incoming data and market developments. As tensions in the Middle East escalate, traders must remain vigilant and adapt to the ever-changing market landscape.
The current scenario suggests a WATCH_ZONE approach. A daily close above $92.84 would open the door for a test of the $94.13 resistance level. Conversely, a break below the $89.9 support could trigger a deeper correction towards $88.25. Traders should wait for a clear breakout or breakdown before committing to a directional trade.
Frequently Asked Questions: WTI Analysis
Is WTI a good buy right now?
Given the overbought conditions and mixed technical signals, WTI may not be a good buy right now. A more prudent approach would be to wait for a pullback towards the $89.9 support level or a breakout above the $92.84 resistance before initiating a long position.
What is the WTI price forecast for this week?
The WTI price forecast for this week is highly dependent on incoming trade data and geopolitical developments. A sustained break above $92.84 could lead to further gains towards $94.13, while a break below $89.9 could trigger a correction towards $88.25. The probability of each scenario is roughly equal at this time.
What are the key support and resistance levels for WTI?
Key support levels for WTI are $89.9, $88.25, and $84.67. Key resistance levels are $92.84, $94.13, and $92.84. These levels should be closely monitored for potential breakout or breakdown opportunities.
Why is WTI moving today?
WTI is moving today due to a combination of factors, including escalating tensions in the Middle East, supply concerns, and economic data releases. The market is particularly sensitive to disruptions in global energy flows, and any news that threatens supply will likely drive prices higher.
Volatility creates opportunity-those prepared will be rewarded.
Technical Outlook Summary
| Indicator | Value | Signal |
|---|---|---|
| RSI (14) | 75.97 | Overbought |
| MACD Histogram | Positive | Bullish |
| Stochastic | 90.49/81.87 | Overbought |
| ADX | 19.03 | Weak Trend |
| Bollinger | Upper Band | Watch |
Key Levels
Support Levels
Resistance Levels
Track markets in real-time
AI-powered analysis, technical indicators and real-time price data.
Join Our Telegram Channel
Breaking market news, AI analysis and trading signals instantly.
Join Channel