

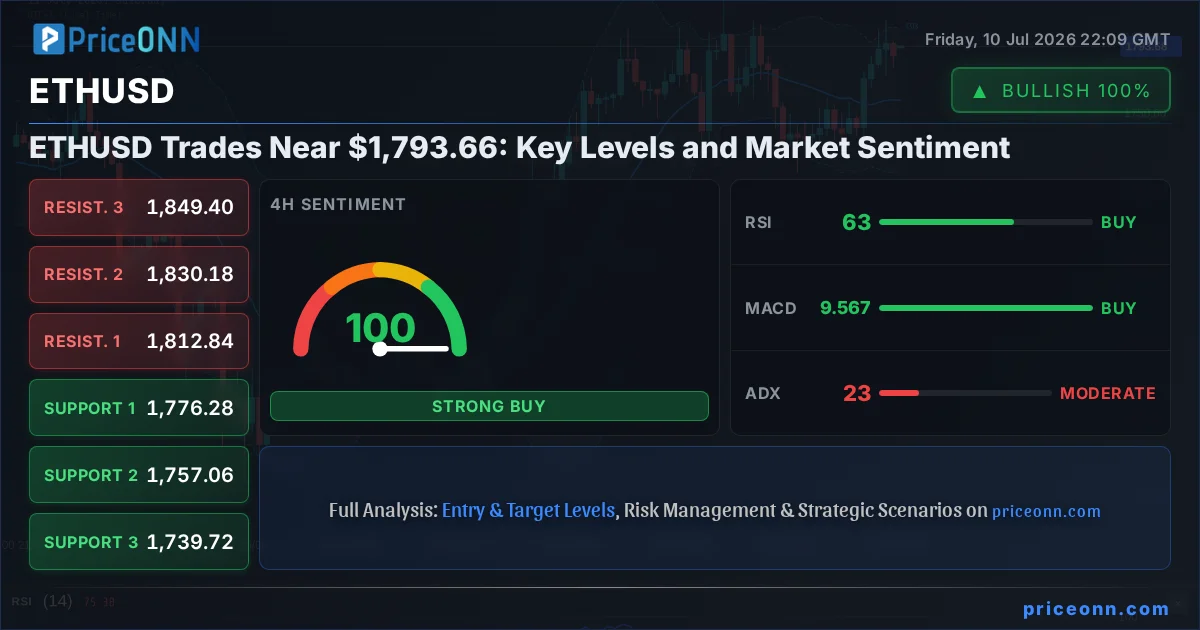
The intricate dance between macroeconomic forces and digital asset undercurrents continues to shape the market. While global headlines often focus on traditional markets and geopolitical tensions, the cryptocurrency space, particularly Ethereum (ETHUSD), is carving its own path. Currently trading around the critical $1,793.66 mark, ETHUSD presents a fascinating case study in market sentiment, technical confluence, and the ever-present influence of broader economic trends. Understanding where this digital asset is headed requires a deep dive into not just its price action, but also the underlying currents that dictate its value. This analysis aims to dissect the current technical landscape, explore the fundamental drivers, and map out potential scenarios for ETHUSD traders and investors navigating this dynamic environment.
- RSI at 59.6 on the 1H chart signals positive momentum, but remains in neutral territory, indicating room for further upside before overbought conditions emerge.
- Critical support for ETHUSD lies at $1,724.48, a level that has held firm in previous pullbacks, while resistance looms at $1,804.02, a key psychological and technical barrier.
- The MACD histogram on the 1H chart shows negative momentum, suggesting short-term caution despite the overall bullish lean indicated by other indicators.
- The correlation with DXY (currently at 100.99) suggests that a strengthening dollar could exert downward pressure on ETHUSD, though current crypto-specific strength might offer some decoupling.
The cryptocurrency market, often seen as a distinct ecosystem, is nonetheless deeply intertwined with the global financial narrative. Events that shake traditional markets invariably send ripples through digital assets. Currently, the strength in the US Dollar Index (DXY), hovering around 100.99, presents a noteworthy correlation. Historically, a robust dollar tends to exert downward pressure on risk assets, including cryptocurrencies, as it increases the cost of holding them for holders of other currencies and can signal a flight to safety. However, the resilience shown by ETHUSD, trading near $1,793.66, suggests that specific crypto-market dynamics might be temporarily overriding this typical correlation. The question remains: how long can this divergence persist, and what technical signals are confirming or refuting the current price action?
Navigating the Technical Tapestry of ETHUSD
1-Hour Chart Dynamics: A Mixed Signal Picture
On the 1-hour timeframe, ETHUSD is showing a complex picture. The current price of $1,793.66 sits above the middle Bollinger Band, which is generally interpreted as a bullish sign, indicating upward momentum. This is further supported by the Stochastic oscillator, where the %K line (23.72) has crossed above the %D line (19.09), signaling a potential buy opportunity. The ADX at 25.86 suggests a strong upward trend is in play on this shorter timeframe. However, the MACD histogram is painting a slightly different story, showing negative momentum. This divergence - where price action suggests upward movement but momentum indicators hint at caution - is precisely where traders need to pay close attention. The RSI at 54.83 is comfortably in neutral territory, suggesting there's still room for price appreciation before hitting overbought conditions, but it's not aggressively bullish either. This 1-hour setup highlights a market that is trying to move higher but faces some internal headwinds, making immediate breakout conviction questionable.
4-Hour Chart: The Bullish Undercurrent
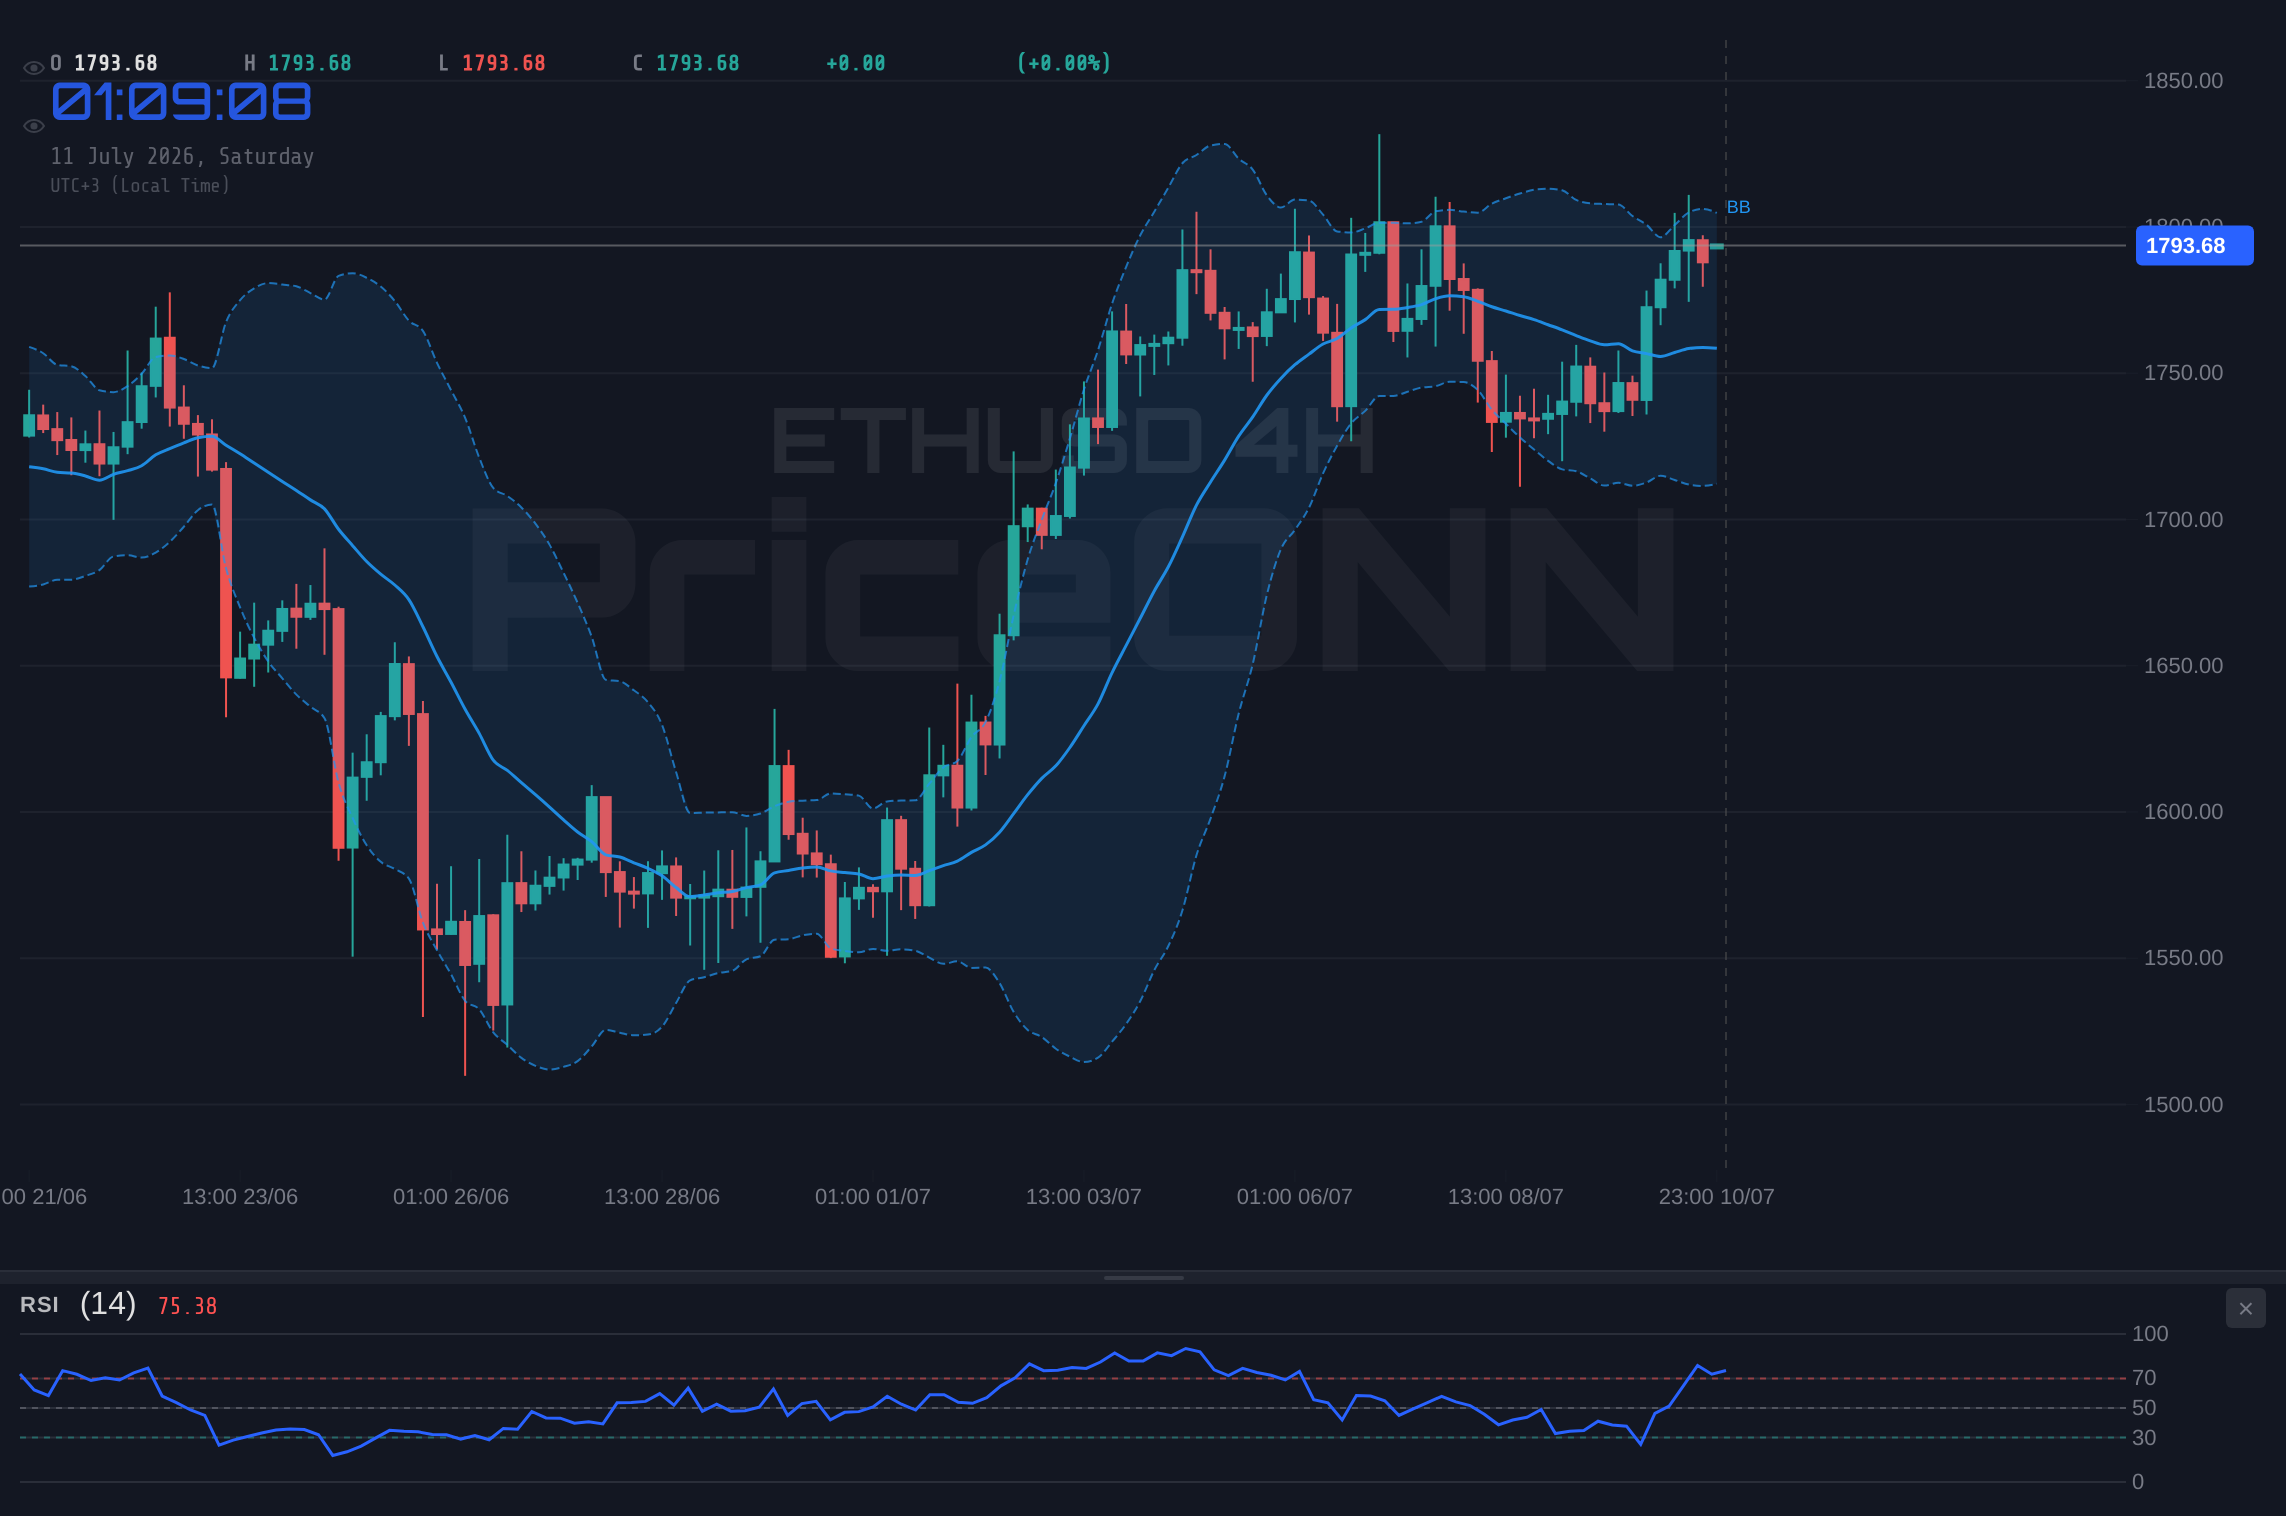
Shifting to the 4-hour chart, the narrative for ETHUSD becomes more decidedly bullish. The price of $1,793.66 is well-positioned above the middle Bollinger Band, reinforcing the upward trend. The MACD is showing positive momentum, with the MACD line above the signal line, a classic bullish signal. The RSI at 59.91 is firmly in the neutral zone, leaning towards bullish, and indicating substantial room for growth before triggering overbought alerts. The ADX at 20.88 suggests a moderately strong uptrend, providing a solid foundation for potential further gains. However, a note of caution comes from the Stochastic oscillator (%K at 78.65, %D at 86.15), which is showing a bearish divergence, suggesting that the current upward momentum might be losing steam and a pullback could be on the horizon. Despite this, the overall confluence of indicators on the 4-hour chart leans towards a bullish bias, suggesting that dips might be viewed as buying opportunities by market participants.
Daily Chart: The Long-Term Perspective
The daily chart provides the broadest context for ETHUSD's current position around $1,793.66. Here, the picture is more neutral, reflecting the asset's consolidation phase after recent moves. The price is trading above the middle Bollinger Band, which is a positive sign, but the RSI at 53.03 is also in the neutral zone, not providing a strong directional cue. The MACD is exhibiting positive momentum, with the MACD line above its signal line, indicating that the longer-term trend might still be intact. However, the ADX at 27.3 signifies a strong downtrend, which seems counterintuitive to the other bullish signals. This conflict underscores the complexity of the daily chart, suggesting that while there are underlying bullish hints, the market is not yet in a clear, sustained uptrend from a daily perspective. The Stochastic oscillator (%K at 76.07, %D at 85.03) is in overbought territory and showing a bearish crossover, which could signal a potential reversal or a period of consolidation. This daily neutral-to-cautiously-bullish stance implies that significant price action might be contingent on external factors or a clear break of key levels.
Fundamental Underpinnings and Market Sentiment
The Crypto Ecosystem: Developments and Correlations
Beyond the charts, the health of the broader cryptocurrency ecosystem plays a pivotal role in ETHUSD's performance. Developments in Decentralized Finance (DeFi) and the Non-Fungible Token (NFT) space, often built on Ethereum's infrastructure, can significantly influence investor sentiment and demand for ETH. A rising Total Value Locked (TVL) in DeFi protocols or renewed interest in high-value NFT collections can directly translate into buying pressure for ETH. On-chain metrics also offer crucial insights. For instance, a surge in active addresses or a significant increase in whale holdings could signal growing confidence and accumulation. Conversely, large outflows from exchanges might indicate a 'hodling' sentiment, while inflows could suggest increased selling pressure. Currently, while specific on-chain data isn't provided, the general narrative around the crypto market's recovery, often spurred by institutional interest in Bitcoin ETFs, indirectly supports Ethereum. The success of Bitcoin ETFs has paved the way for potential Ethereum-based investment products, creating a positive feedback loop for the second-largest cryptocurrency.
Regulatory Landscape: Navigating Uncertainty
The regulatory environment remains a significant overhang for the entire crypto market, and Ethereum is no exception. Any news regarding regulatory crackdowns, new frameworks, or pronouncements from major financial bodies can cause sharp price movements. For example, a stricter stance from the SEC on staking yields or classifying ETH as a security could trigger a sell-off. Conversely, clearer regulatory guidelines or the approval of Ethereum-based investment vehicles could provide a substantial boost. Recent news, such as discussions around the US and Iran potentially de-escalating tensions, indirectly impacts risk assets by reducing geopolitical uncertainty, which can sometimes lead to a reallocation of capital towards riskier assets like crypto. However, it's crucial to distinguish between general market sentiment shifts and direct regulatory impact. For ETHUSD, clarity on its regulatory status, especially in major economies, remains a key factor to watch.
Institutional Adoption and Capital Flows
The increasing involvement of institutional investors is a defining trend in the current crypto market cycle. The approval and subsequent trading of Bitcoin ETFs have opened the doors for significant capital inflows, and anticipation of similar products for Ethereum is a constant theme. If institutions begin to allocate capital to Ethereum, either directly or through regulated products, it could lead to substantial price appreciation. Tracking exchange flows and large wallet movements (whale activity) provides clues about institutional sentiment. While direct data isn't available here, the general trend of institutional adoption in crypto, driven by its potential as an uncorrelated asset class and a hedge against inflation, remains a fundamental tailwind for ETHUSD. The market is keenly watching for any concrete steps towards Ethereum ETFs or other institutional-grade investment avenues.
Trade Scenarios and Key Levels
Given the mixed signals across different timeframes and the interplay of technical and fundamental factors, identifying clear trade scenarios for ETHUSD around $1,793.66 is crucial. The key levels provided are essential reference points. Support is found at $1,724.48, $1,702.31, and $1,700 (using $1,684.71 as S3). Resistance is identified at $1,804.02, $1,830.18, and $1,849.40 (using $1,812.84 as R1). The immediate focus is on whether ETHUSD can consolidate above $1,793.66 and push towards the $1,804.02 resistance. A decisive break and hold above this level could signal the start of a more significant upward move, potentially targeting higher resistance levels.
Conversely, a failure to hold the current price and a subsequent break below the $1,724.48 support level would invalidate the bullish short-term thesis. Such a move would likely trigger further downside, potentially testing the subsequent support at $1,702.31. The daily ADX at 27.3 indicates a strong trend, but its direction is not clearly defined by the daily chart alone, making the shorter-term timeframes more critical for immediate trading decisions. The conflict between the daily chart's weak trend strength and the shorter-term bullish signals necessitates a cautious approach, emphasizing risk management and waiting for clear confirmation.
Bearish Scenario: Consolidation Below Resistance
35% ProbabilityNeutral Scenario: Range-Bound Trading
30% ProbabilityBullish Scenario: Breakout Above Resistance
35% Probability| Indicator | Value | Signal | Interpretation |
|---|---|---|---|
| RSI (14) | 59.91 | Neutral | Approaching overbought, but room to run. |
| MACD Histogram | +0.85 | Bullish | Positive momentum building. |
| Stochastic %K | 78.65 | Bearish Divergence | Potential pullback signal on 4H. |
| ADX (14) | 20.88 | Moderate Uptrend | Suggests an established trend on 4H. |
| Bollinger Bands | Middle Band | Above | Price holding above mid-band is bullish. |
Frequently Asked Questions: ETHUSD Analysis
What happens if ETHUSD breaks above the $1,804.02 resistance level?
A decisive close above $1,804.02 on a 1-hour or 4-hour chart, especially with confirming volume, would likely trigger a bullish scenario. This could open the door for ETHUSD to test the next resistance levels at $1,812.84 and potentially $1,830.18 in the short term.
Should I buy ETHUSD at current levels near $1,793.66 given the RSI is at 59.91?
While the RSI at 59.91 suggests room for upside, the Stochastic on the 4H chart showing bearish divergence warrants caution. A prudent approach would be to wait for confirmation of a clear breakout above $1,804.02 or a pullback to a strong support like $1,724.48 before considering entry.
Is the MACD histogram showing negative momentum a sell signal for ETHUSD at $1,793.66?
The negative MACD histogram on the 1-hour chart suggests short-term selling pressure or consolidation, but it's not a standalone sell signal when viewed against other bullish indicators like the RSI and Bollinger Band position. It indicates caution is warranted, rather than an immediate sell.
How will the current DXY level of 100.99 affect ETHUSD this week?
A DXY at 100.99 generally implies a stronger dollar, which can put pressure on risk assets like ETHUSD. However, if crypto-specific factors like institutional adoption or positive DeFi news remain strong, ETHUSD might show resilience or even decouple from the dollar's immediate influence.
Track markets in real-time
AI-powered analysis, technical indicators and real-time price data.
Join Our Telegram Channel
Breaking market news, AI analysis and trading signals instantly.
Join Channel