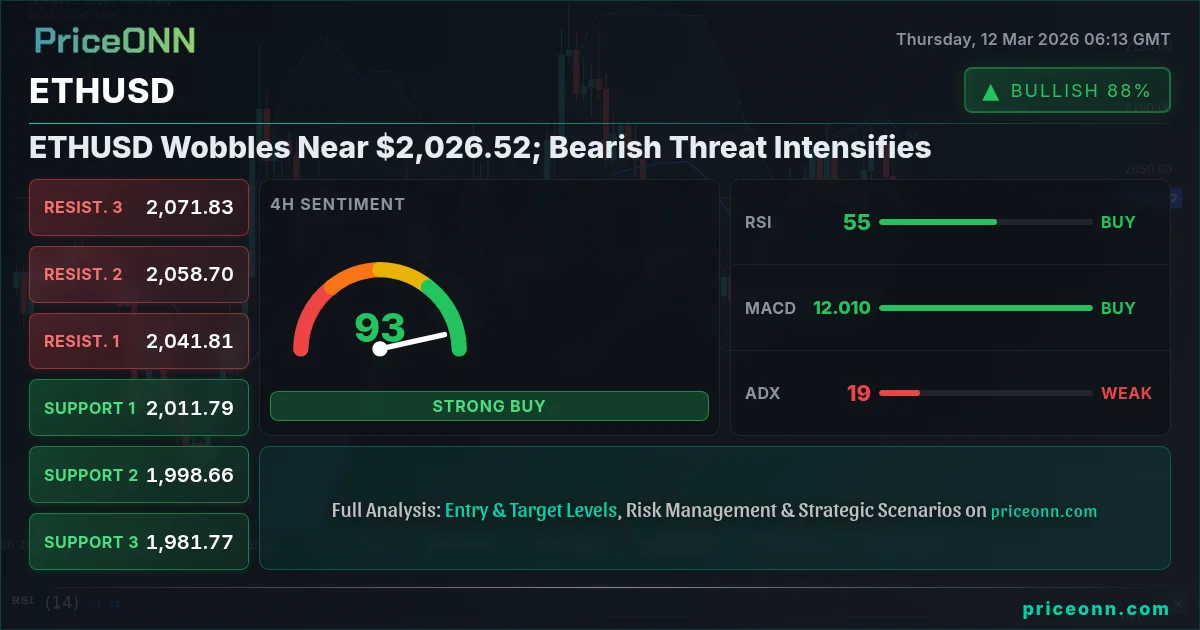
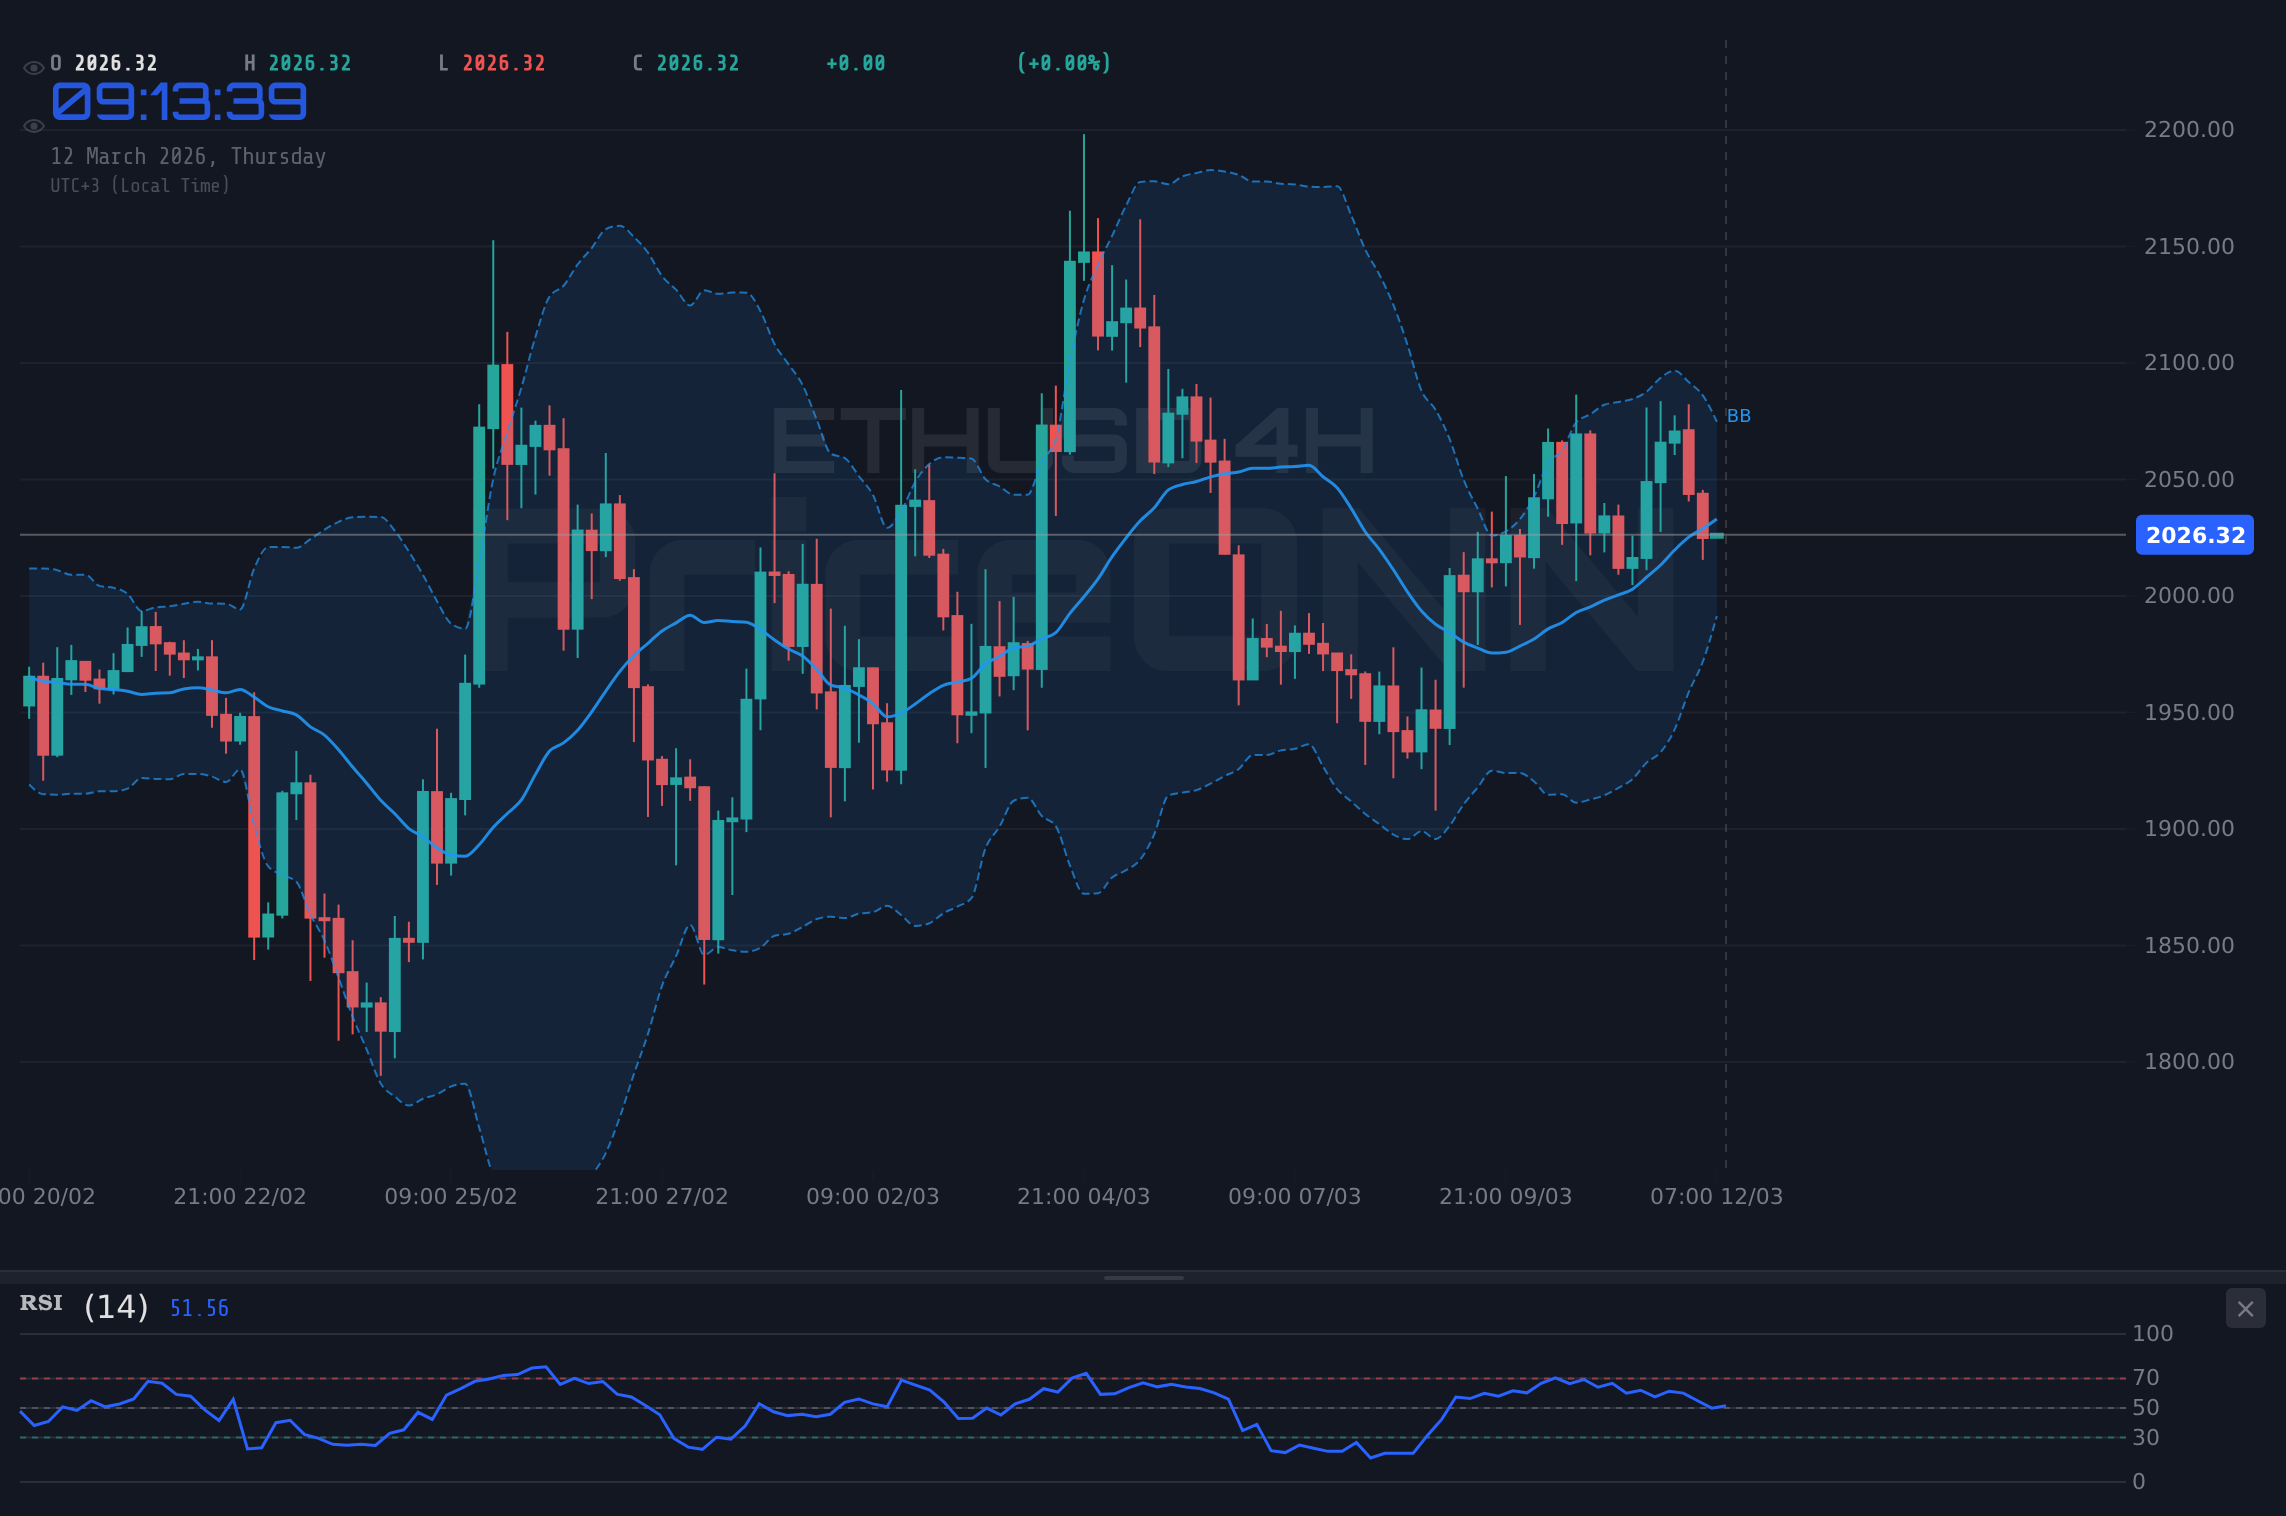
ETHUSD is currently trading near $2,026.52, a level that's acting as a critical pivot point. Will the bears break through, or can the bulls defend this key area?
- RSI at 43.54 signals weakening bullish momentum on the 1H chart.
- Immediate support lies at $2,017.54, a breach of which could accelerate losses.
- The MACD histogram indicates negative momentum, suggesting further downside potential.
- Geopolitical tensions and rising oil prices are adding to the risk-off sentiment, pressuring ETHUSD.
The cryptocurrency pair is navigating a tricky landscape, influenced by both technical indicators and broader market sentiment. A break below the immediate support could open the door for a significant decline, while a successful defense could pave the way for a bullish reversal. Let's explore the scenarios.
The Bull's Roadmap: A Reversal Above $2,035
For the bulls to regain control, ETHUSD needs to decisively break above the resistance level of $2,031.14, as indicated by the 1H timeframe data. This move would signal a shift in momentum and potentially trigger a rally towards higher targets. A sustained push above $2,035 could then open the door to testing the next resistance at $2,070.57, as seen on the 4H chart. This scenario hinges on a broader improvement in market sentiment and a weakening of the U.S. dollar.
With the DXY currently at 99.21, any signs of dollar weakness could provide a tailwind for ETHUSD. Traders should watch for a break below the DXY's immediate support at 99.11, which could signal a shift in dollar strength. Furthermore, a positive turn in the SP500, currently at 6713, could also boost risk appetite and support a rally in ETHUSD. A move above 6718.57 on the SP500 would be an encouraging sign for bullish ETHUSD traders. The time horizon for this scenario is within the next week, assuming market conditions cooperate.
Watch for a confluence of bullish signals - a DXY breakdown, SP500 recovery, and a decisive break above $2,035 on ETHUSD. These combined factors could signal a high-probability long setup.
Where Bears Take Control: A Fall Below $2,015
On the flip side, the bearish scenario unfolds if ETHUSD fails to hold the immediate support at $2,017.54. A decisive break below this level could trigger a cascade of selling pressure, pushing the price down to the next support at $2,014.12, as indicated by the 1H timeframe data. Further weakness could then target the $2,000 psychological level, followed by the stronger support at $1,974.03, as seen on the 1D chart. This bearish outlook is reinforced by the negative momentum on the MACD and the overall downward trend in the cryptocurrency market.
Given the current geopolitical tensions and rising oil prices, as highlighted by recent news reports, risk-off sentiment is prevalent. As oil prices test $100 amid Mideast tensions, inflation fears are fueled. A stronger DXY, currently at 99.21, adds further pressure. If the DXY breaks above its immediate resistance at 99.19, ETHUSD could face significant headwinds. This bearish scenario could play out within the next few days, especially if key economic data releases, such as the upcoming GBP data on March 13th, disappoint.
The Waiting Game: Range-Bound Consolidation
A third scenario involves ETHUSD remaining range-bound between the immediate support at $2,017.54 and the resistance at $2,031.14. This consolidation could occur if market participants remain indecisive, awaiting further catalysts or economic data releases. The ADX indicator, currently at 18.82 on the 1H chart, suggests a weak trend, supporting the possibility of a sideways movement. A neutral stance would involve monitoring price action within this range and waiting for a clear breakout or breakdown before committing to a directional trade.
This scenario is further supported by the mixed signals from the daily timeframe, where the RSI is at 48.12, indicating neutral conditions. The Stochastic oscillator, however, shows a bullish crossover, suggesting potential for upside. The key to this scenario is the lack of strong conviction from either bulls or bears, leading to a period of consolidation. The time horizon for this range-bound movement could extend throughout the week, as the market digests recent events and prepares for upcoming data.
Most Likely Scenario: Bearish Pressure Prevails (60%)
Considering the current market conditions, the bearish scenario appears to be the most likely outcome with an estimated probability of 60%. The combination of geopolitical tensions, rising oil prices, a strengthening dollar, and negative technical indicators suggests that ETHUSD is likely to face further downside pressure. The key trigger to watch is a decisive break below the $2,017.54 support level, which could accelerate the decline towards lower targets.
The bullish scenario is assigned a probability of 25%, contingent on a significant improvement in market sentiment and a weakening of the dollar. The range-bound scenario is given a probability of 15%, reflecting the possibility of consolidation before a more decisive move. These probabilities are based on the current data and market conditions, which are subject to change.
Key Triggers to Watch This Week
- Break below $2,017.54: A decisive break below this support level could trigger a sharp decline in ETHUSD.
- DXY break above 99.19: A sustained move above this resistance could put further pressure on ETHUSD.
- GBP data release on March 13th: Disappointing economic data from the UK could exacerbate risk-off sentiment and weigh on ETHUSD.
Technical Outlook Summary
| Indicator | Value | Signal |
|---|---|---|
| RSI (14) | 43.54 | Bearish |
| MACD Histogram | Negative | Bearish |
| Stochastic | 11.11/16.88 | Oversold |
| ADX | 18.82 | Weak Trend |
| Bollinger | Middle Band | Below |
Key Levels
Support Levels
Resistance Levels
Frequently Asked Questions: ETHUSD Analysis
What happens if ETHUSD breaks below $2,017.54 support?
A break below the $2,017.54 support level could trigger a sharp decline in ETHUSD, potentially leading to further losses towards the $2,014.12 and $2,000 levels. This scenario is supported by the negative momentum on the MACD and the overall bearish trend in the market.
Should I buy ETHUSD at current levels of $2,026.52 given RSI at 43.54?
With the RSI at 43.54, ETHUSD is not yet oversold, suggesting that there may be further downside potential. A buy signal would require a more oversold reading on the RSI, combined with other bullish confirmations, such as a break above the $2,031.14 resistance level.
Is the MACD signal a reliable indicator for ETHUSD trend analysis?
The MACD histogram currently indicates negative momentum, suggesting that the bearish trend is likely to continue. However, it's important to consider the MACD in conjunction with other indicators and price action to confirm the trend and identify potential reversal points.
How will the GBP data release on March 13th affect ETHUSD this week?
Disappointing economic data from the UK could exacerbate risk-off sentiment and weigh on ETHUSD, as investors seek safe-haven assets. This scenario is particularly relevant given the current geopolitical tensions and rising oil prices, which are already contributing to a bearish outlook for the cryptocurrency pair.
Track markets in real-time
AI-powered analysis, technical indicators and real-time price data.
Join Our Telegram Channel
Breaking market news, AI analysis and trading signals instantly.
Join Channel