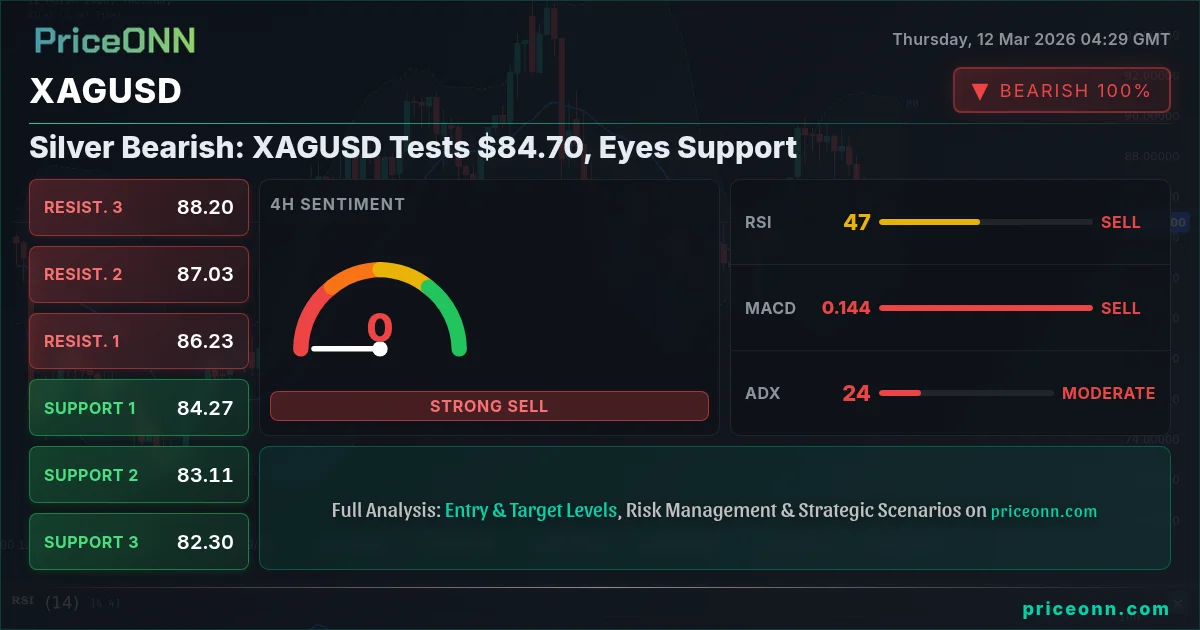
Silver (XAGUSD) is under pressure, testing the $84.70 level as bears attempt to seize control. Can the bulls defend key support amid a strengthening dollar and growing risk aversion?
- XAGUSD is testing the $84.70 level amid a strengthening dollar.
- Key support lies at $83.98, a break below which could trigger further declines.
- The 1-hour RSI at 38.83 suggests further downside potential in the near term.
- Rising geopolitical tensions in the Middle East could provide some safe-haven support.
We're seeing a battle play out between bulls and bears around the $84.70 mark. Several factors are weighing on silver, including a strengthening dollar index (DXY) currently at 99.23, and broader risk-off sentiment in the market as evidenced by the S&P 500 dropping by -0.77%. Let's dive into the arguments on both sides.
The Bull Case for Silver
Despite the current bearish pressure, there's still a case to be made for silver bulls. The primary argument rests on silver's dual nature as both a precious metal and an industrial commodity. While gold often benefits from safe-haven demand during times of economic uncertainty, silver's industrial applications can provide a floor during risk-off periods.
Specifically, the bullish argument focuses on the following points:
- Inflation Hedge: While gold is the traditional inflation hedge, silver can also play this role. With Brent crude oil surging by 7.09% to $100.31 amid geopolitical tensions, inflation expectations could rise, benefiting silver.
- Industrial Demand: Silver has significant industrial uses in electronics, solar panels, and other sectors. A rebound in global manufacturing activity could boost demand for silver, supporting prices. The current demand for silver is higher than gold due to its varied industrial applications.
- Oversold Conditions: On the daily chart, the Stochastic oscillator is showing a bullish signal with K=45.18 and D=39.05, suggesting that silver may be oversold and due for a bounce.
From a technical perspective, bulls will be watching to see if XAGUSD can hold above the immediate support at $83.98. A successful defense of this level could signal a potential reversal and a move back towards the resistance at $85.36.
The Bear Case for Silver
The bear case for silver is currently dominant, driven by a confluence of factors that are putting significant pressure on the metal. The key arguments for the bearish outlook include:
- Dollar Strength: The dollar index (DXY) is surging, currently trading at 99.23, up 0.34% on the day. A stronger dollar makes silver more expensive for holders of other currencies, dampening demand. According to recent activity, most of the demand is for USD and not for XAGUSD.
- Risk Aversion: The S&P 500 is down -0.77%, indicating a risk-off environment. Typically, this would benefit safe-haven assets like gold, but silver is being dragged down by its industrial commodity status.
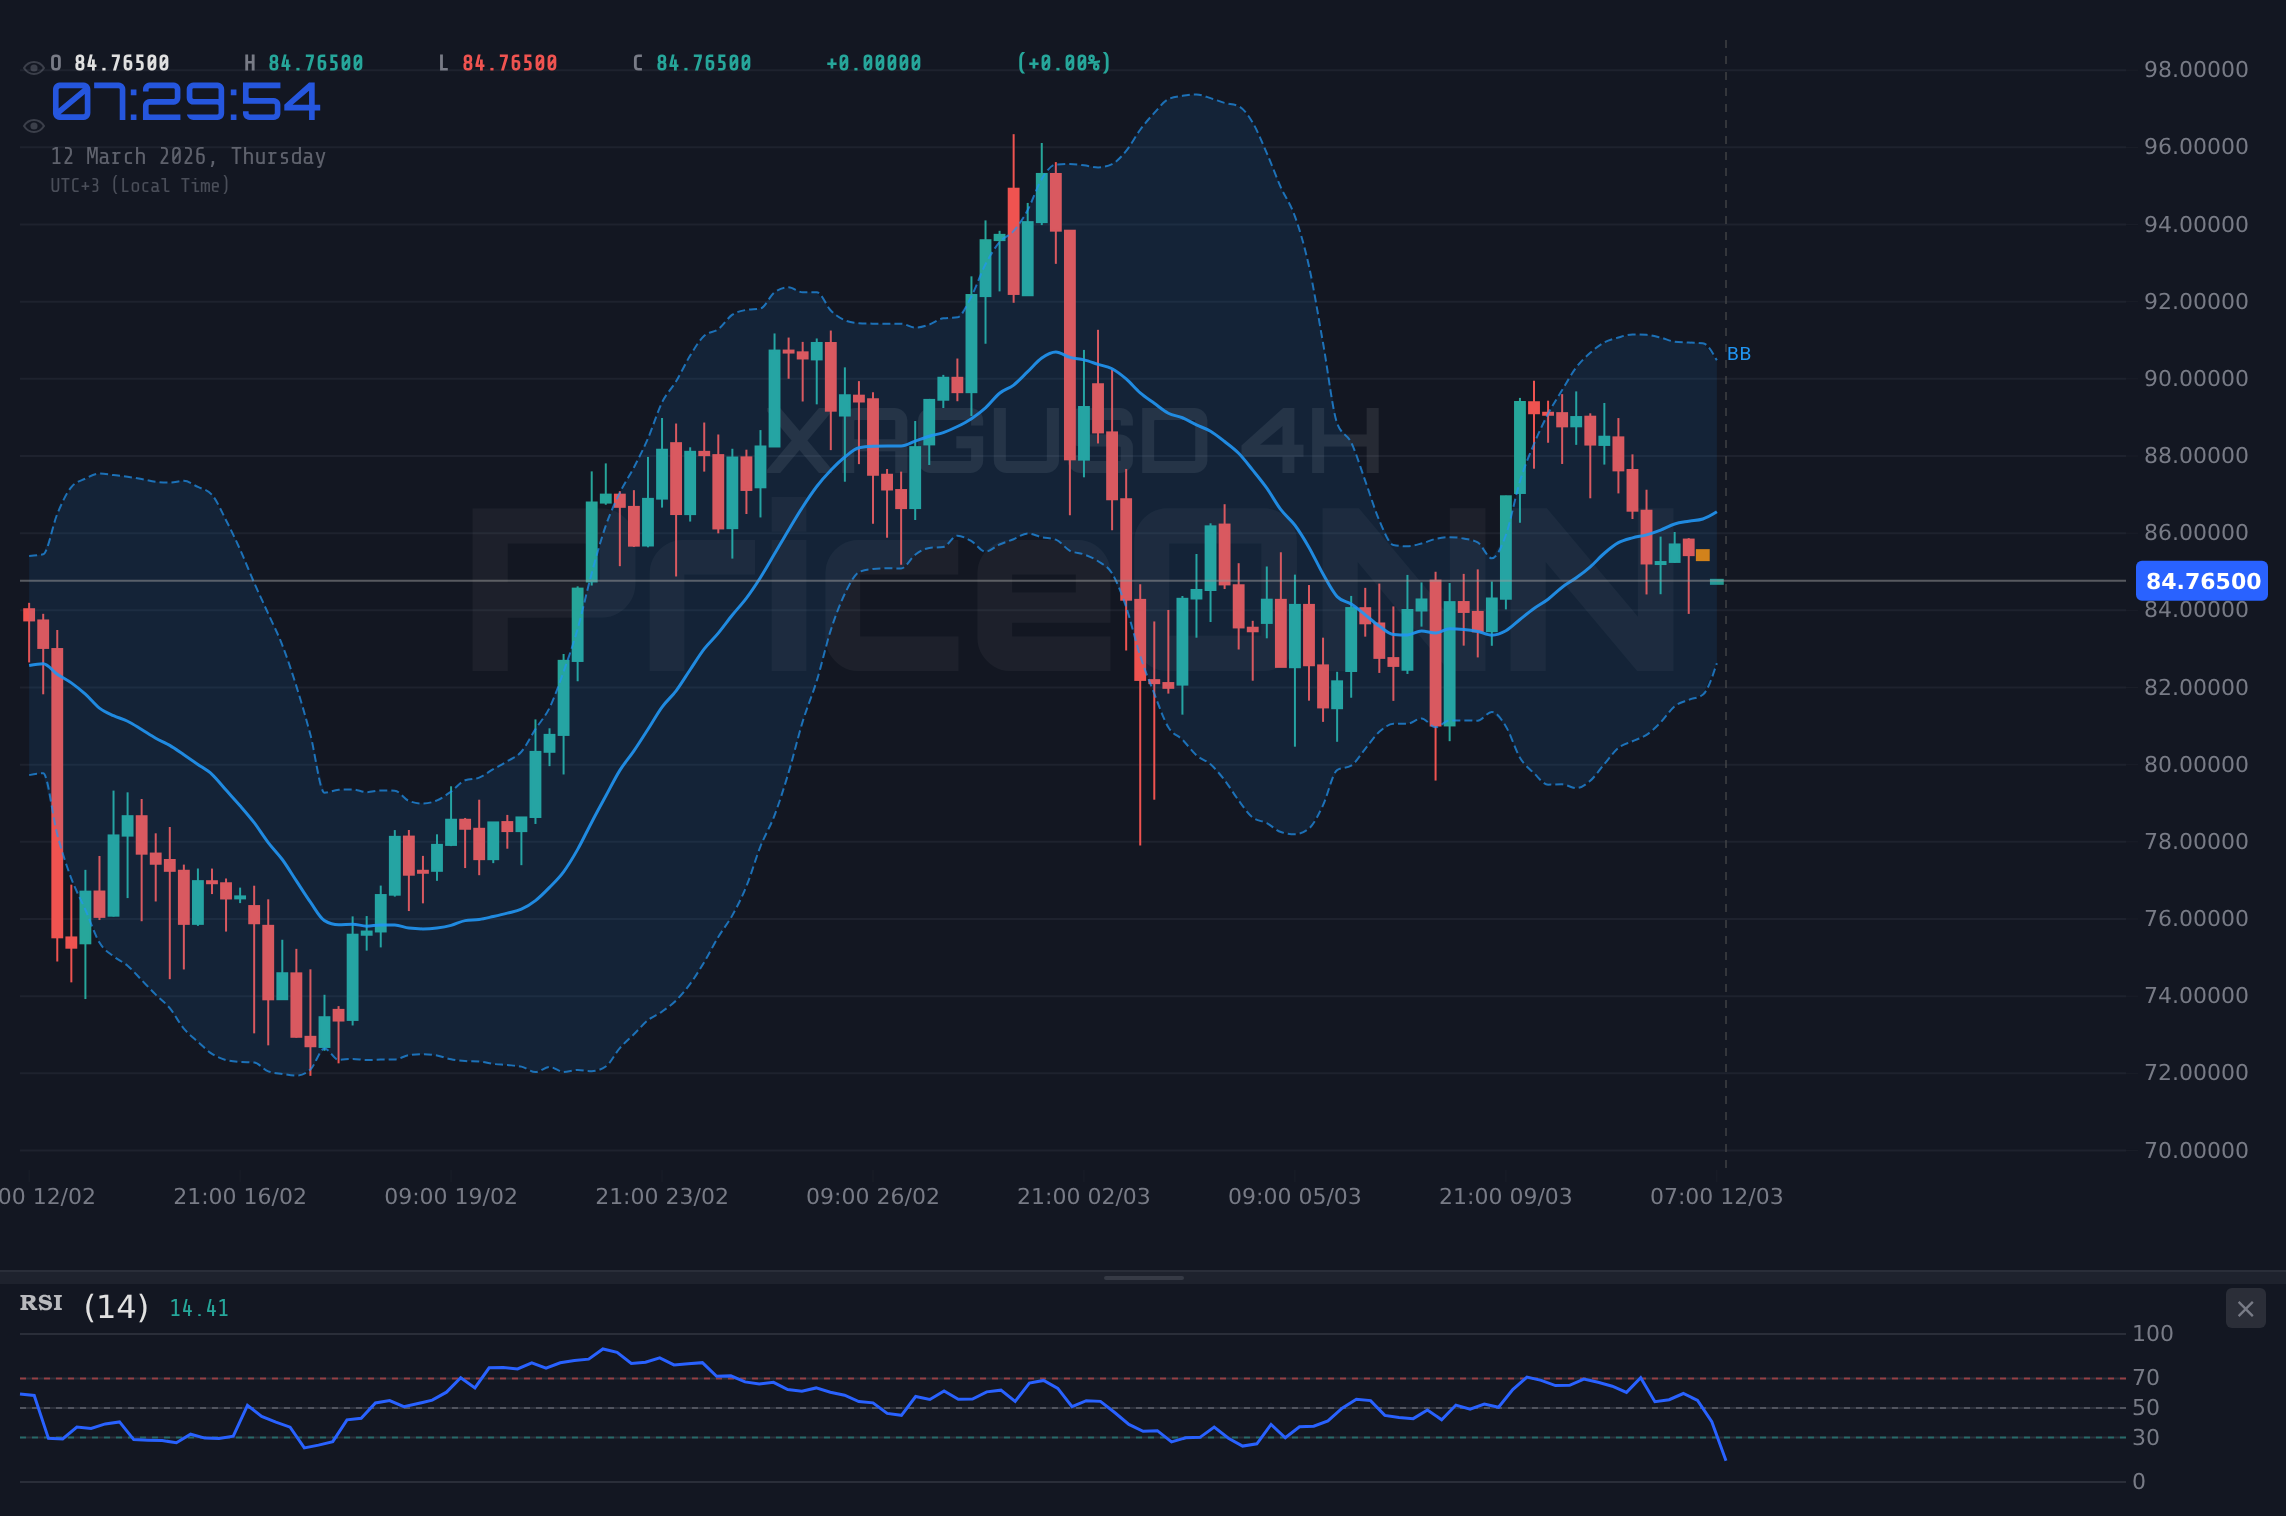
- Technical Breakdown: XAGUSD has broken below its 200-day moving average and is trading below the middle band of the Bollinger Bands on the 1-hour, 4-hour and daily charts, signaling a potential downtrend.
- Negative Momentum: The MACD on the 1-hour and 4-hour charts shows negative momentum, further supporting the bearish outlook. The 1-hour ADX at 40.2 indicates a strong downtrend.
Technically, bears are targeting a break below the $83.98 support level, which could open the door for a move towards the next support at $83.45, and potentially lower to $82.60. The 1-hour RSI at 38.83 suggests further downside potential in the near term.
Technicals as Tiebreaker: Which Way Will Silver Break?
Given the conflicting fundamental and technical signals, let's examine the technical picture across different timeframes to determine which side has the edge.
1-Hour Chart: The 1-hour chart paints a bearish picture. The price is below the middle band of the Bollinger Bands, the MACD shows negative momentum, and the ADX at 40.2 indicates a strong downtrend. The Stochastic oscillator (K=45.74, D=46.16) is also showing a bearish signal.
4-Hour Chart: The 4-hour chart is also bearish. The price is below the middle band of the Bollinger Bands, the MACD shows negative momentum, and the ADX at 23.22 indicates a moderate downtrend. The Stochastic oscillator (K=18.1, D=33.16) is showing a bearish signal.
Daily Chart: The daily chart presents a mixed picture. While the price is below the middle band of the Bollinger Bands, the MACD shows positive momentum. The Stochastic oscillator (K=45.18, D=39.05) is showing a bullish signal, suggesting a potential bounce. However, the overall trend remains bearish due to the strong downtrend.
Based on the multi-timeframe analysis, the bears appear to have the upper hand in the short to medium term. The 1-hour and 4-hour charts are both bearish, suggesting that the downtrend is likely to continue. However, the daily chart is showing some signs of a potential bounce, so traders should be cautious about getting too bearish.
The Verdict
Given the current market conditions, the bearish case for silver appears to be stronger. The strengthening dollar, risk aversion, and negative technical signals are all weighing on the metal. While the bullish arguments related to inflation and industrial demand are valid, they are not currently strong enough to overcome the bearish forces.
Therefore, the most likely scenario is a continuation of the downtrend, with a potential break below the $83.98 support level. Traders should watch for confirmation of the breakdown and consider short positions with targets at $83.45 and $82.60.
Frequently Asked Questions: XAGUSD Analysis
What happens if XAGUSD breaks below $83.98 support?
If XAGUSD breaks below the $83.98 support level, it could trigger a further decline towards the next support levels at $83.45 and $82.60. This breakdown would confirm the bearish outlook and open the door for short positions.
Should I sell XAGUSD at current levels of $84.70 given the DXY at 99.23?
With the DXY at 99.23, indicating a strengthening dollar, selling XAGUSD at current levels of $84.70 could be a viable strategy. However, traders should wait for confirmation of a breakdown below the $83.98 support before entering short positions to minimize risk.
Is the 1-hour RSI at 38.83 a sell signal for XAGUSD right now?
The 1-hour RSI at 38.83 suggests further downside potential for XAGUSD, but it is not a definitive sell signal. Traders should look for additional confirmation from other indicators and price action before entering short positions.
How will the upcoming GBP data on Friday affect XAGUSD this week?
The GBP data on Friday could indirectly affect XAGUSD by influencing the dollar index (DXY). Stronger-than-expected GBP data could weaken the dollar, providing some support for silver. However, the overall impact is likely to be limited due to the dominance of other factors such as risk aversion and the broader dollar trend.
Track markets in real-time
AI-powered analysis, technical indicators and real-time price data.
Join Our Telegram Channel
Breaking market news, AI analysis and trading signals instantly.
Join Channel