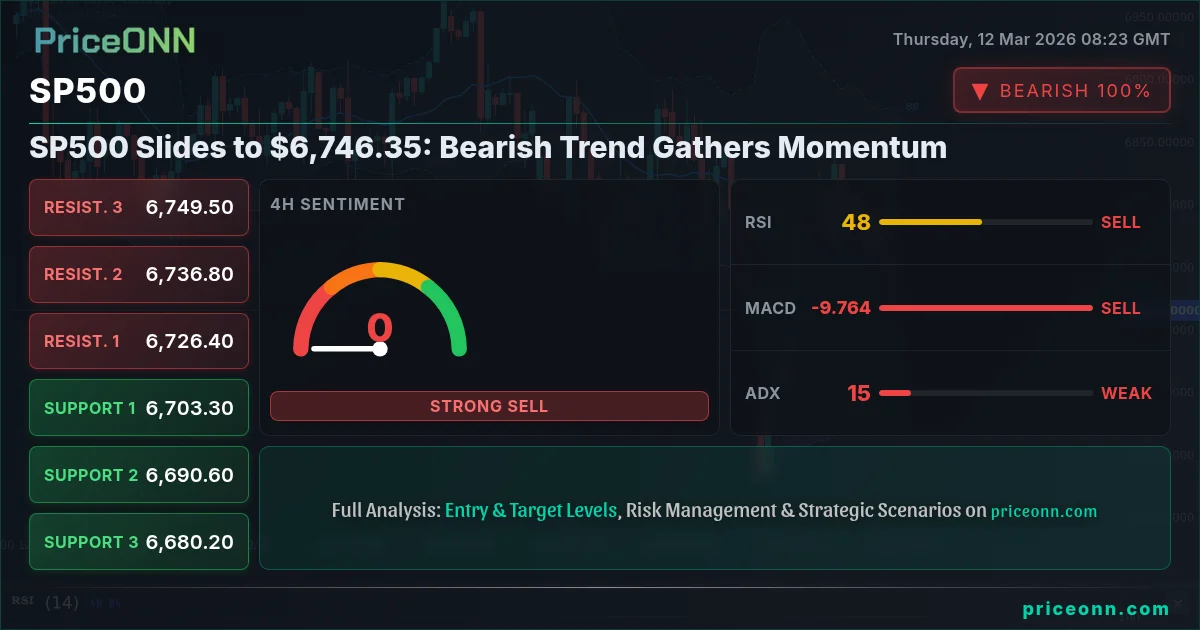
The SP500 is currently trading at $6,746.35, and the bears appear to be in control. After a period of relative stability, the index is now facing a renewed wave of selling pressure, raising concerns about a deeper correction. The question now is whether key support levels will hold, or if we are on the verge of a more significant decline. The recent surge in oil prices is also adding fuel to inflation concerns, further weighing on market sentiment.
SP500 today analysis reveals that the decline is not happening in isolation. The dollar index (DXY) is strengthening, currently at 99.12, putting pressure on risk assets, including the SP500. This inverse correlation is a classic risk-off signal, and traders are closely watching to see if it continues. The recent geopolitical tensions in the Middle East, as reported by Reuters, are also playing a role, driving up oil prices and stoking fears of inflation. Brent crude is currently trading at $97.09, and WTI is at $91.45, both showing significant gains. This is creating a challenging environment for equities, as higher energy prices can erode corporate earnings and consumer spending.
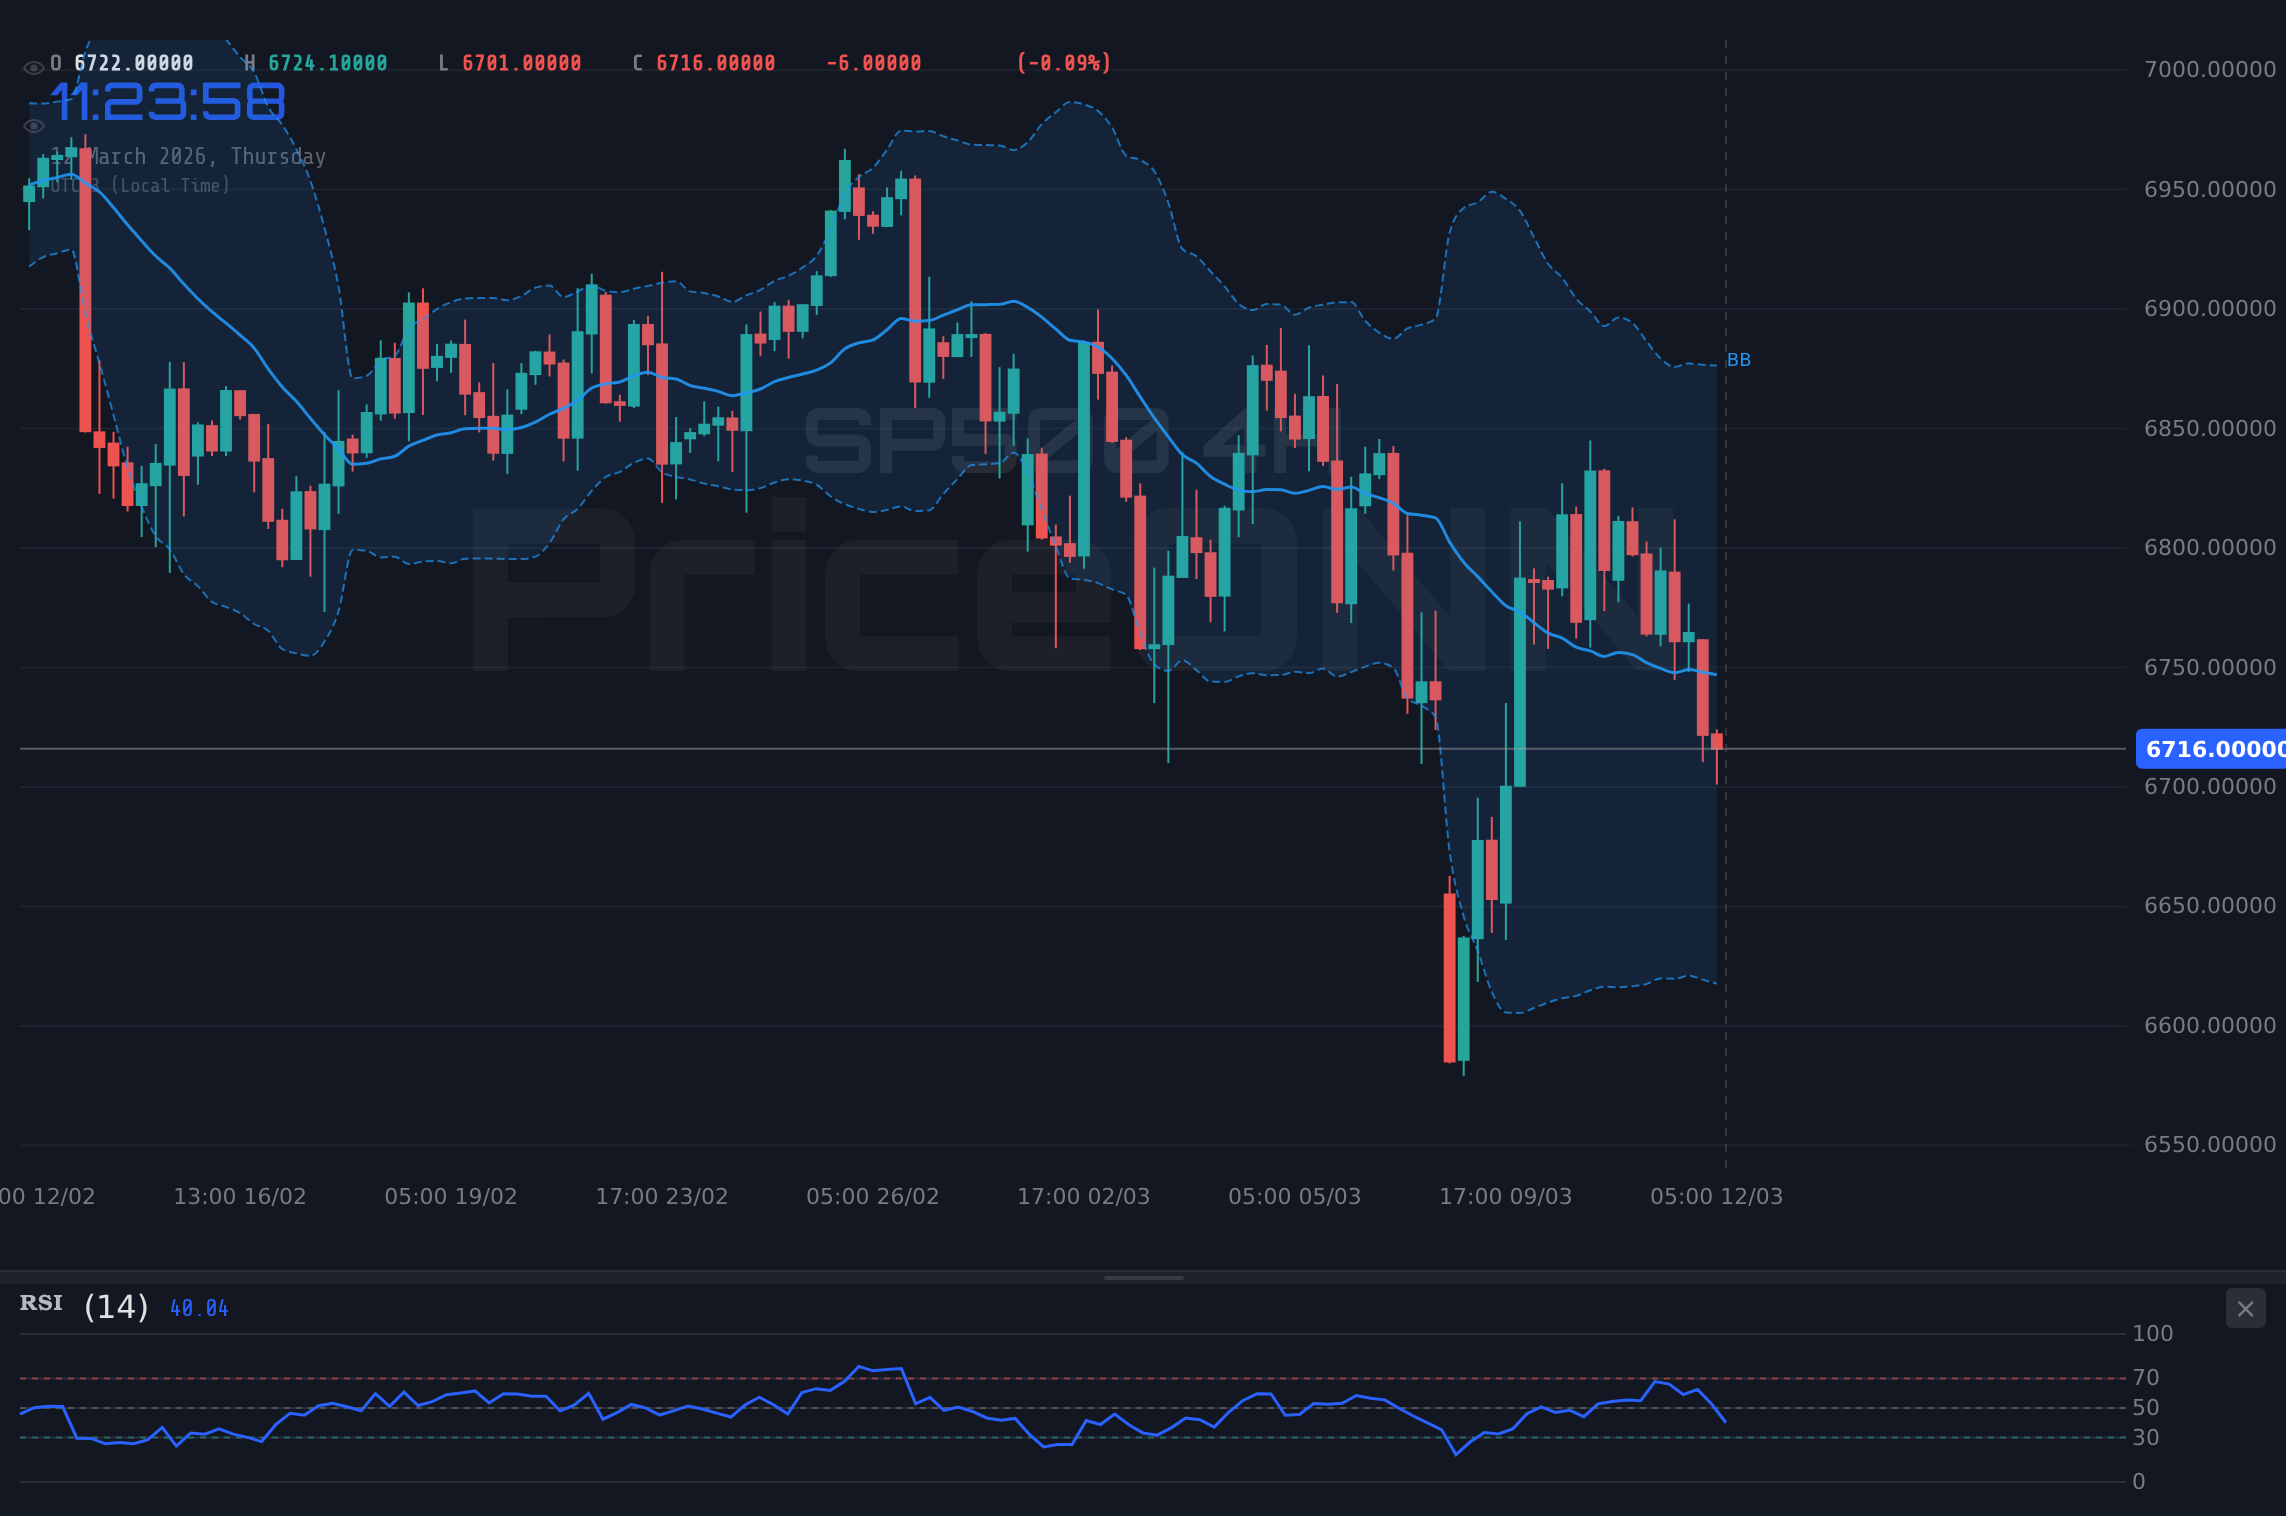
Looking at the SP500 chart pattern recognition, we can see that the index has broken below a key short-term moving average, which is often interpreted as a bearish signal. Multi-timeframe analysis shows that the bearish trend is most pronounced on the 1-day and 4-hour charts, where ADX reads 35.71 and 21.06 respectively, confirming the strength of the downtrend. However, the 1-hour chart presents a more neutral outlook, with the ADX at 28.9, suggesting that the selling pressure might be temporarily easing. This divergence across timeframes highlights the current uncertainty in the market and the need for caution.
From a fundamental perspective, the SP500 news impact is primarily driven by expectations surrounding the Federal Reserve's monetary policy. The market is keenly awaiting upcoming economic data releases, particularly inflation figures, which will likely influence the Fed's decision on interest rates. The upcoming GBP data on Friday is also a key event to watch. If inflation remains stubbornly high, the Fed may be forced to maintain its hawkish stance, which could further weigh on the SP500. Conversely, if inflation shows signs of easing, it could provide some relief to the market.
For swing traders, the SP500 support and resistance levels are crucial. The first key support level lies at 6733.8. A break below this level could open the door for a further decline towards 6703.2. On the upside, the initial resistance is at 6806. A successful break above this level would negate the bearish outlook and potentially pave the way for a move towards higher targets. Scalpers should pay close attention to the hourly chart, where the RSI at 49.07 indicates that the market is neither overbought nor oversold, suggesting range-bound trading opportunities. Long-term investors should focus on the daily chart, where the MACD histogram confirms the negative momentum and the importance of the 6733.8 support level.
SP500 RSI analysis shows that the Relative Strength Index (RSI) on the daily chart is currently at 40.9, indicating increasing bearish momentum. Historically, when the RSI reaches this zone, it often signals a period of consolidation or further decline. However, it's important to note that the RSI is not a perfect indicator, and it should be used in conjunction with other technical and fundamental factors. The SP500 MACD signal also suggests that the bearish trend is intact. The MACD histogram is negative, confirming that the selling pressure is still strong. A crossover above the zero line would be a bullish signal, but that is not currently the case.
The SP500 trend analysis indicates that the index is currently in a downtrend, as confirmed by the ADX on the daily chart. The ADX measures the strength of the trend, and a reading above 25 typically indicates a strong trend. The current ADX reading of 35.71 suggests that the downtrend is indeed quite strong. However, it's important to remember that trends do not last forever, and at some point, the downtrend will eventually reverse. The key is to identify the potential reversal points and to be prepared to adjust your trading strategy accordingly.
SP500 breakout analysis reveals that the index recently failed to sustain a breakout above a key resistance level, which is often seen as a bearish sign. The failure to hold above this level suggests that the bulls are not strong enough to overcome the selling pressure, and that the bears are still in control. However, it's important to note that failed breakouts can sometimes lead to even stronger rallies, as they can trap short sellers and create a squeeze. Therefore, traders should be prepared for both scenarios and to adjust their positions accordingly.
SP500 market sentiment analysis suggests that the overall mood is currently cautious, with many investors adopting a wait-and-see approach. The recent surge in oil prices, the strengthening dollar, and the uncertainty surrounding the Fed's monetary policy are all contributing to the cautious sentiment. However, it's important to remember that market sentiment can change quickly, and that it's often a contrarian indicator. When everyone is bearish, it can sometimes be a sign that the market is about to bottom out. Conversely, when everyone is bullish, it can sometimes be a sign that the market is about to top out.
SP500 key levels are crucial for traders to watch. On the downside, the key support levels are at 6733.8, 6703.2, and 6661.6. A break below 6733.8 could trigger further selling and potentially lead to a test of the 6703.2 level. On the upside, the key resistance levels are at 6806, 6847.6, and 6878.2. A successful break above 6806 would negate the bearish outlook and potentially pave the way for a move towards higher targets. It is important to note that these levels are not absolute, and that the market can sometimes trade above or below them temporarily. However, they can provide valuable guidance for traders and help them to make informed trading decisions.
SP500 trading signals are mixed, with some indicators suggesting a bearish outlook and others suggesting a more neutral stance. The RSI and MACD are both pointing to increasing bearish momentum, while the ADX confirms the strength of the downtrend. However, the Stochastic oscillator is showing a bullish signal, suggesting that the market might be oversold and due for a bounce. This divergence in signals highlights the current uncertainty in the market and the need for caution. Traders should not rely solely on any one indicator, but should instead use a combination of technical and fundamental factors to make their trading decisions.
Frequently Asked Questions: SP500 Analysis
What happens if SP500 breaks below $6,733.8 support?
If the SP500 breaks below the $6,733.8 support level, it could trigger a further decline towards the next support at $6,703.2. This breakdown would confirm the bearish trend and likely lead to increased selling pressure.
Should I buy SP500 at current levels of $6,746.35 given the 40.9 RSI?
With the RSI at 40.9, the SP500 is showing increasing bearish momentum, suggesting it is not an ideal time to buy. It is better to wait for a potential reversal or a break above resistance before considering a long position.
Is the negative MACD signal a confirmed sell signal for SP500?
The negative MACD histogram confirms the bearish trend, suggesting caution. While it's not a guaranteed sell signal, it indicates that selling pressure is strong, and traders should be wary of potential downside.
How will the upcoming GBP data on Friday affect SP500 this week?
The upcoming GBP data could indirectly affect the SP500 through its impact on global market sentiment. Stronger-than-expected GBP data could boost risk appetite, providing some support to the SP500, while weaker data could exacerbate selling pressure.
Having tracked SP500 through the 2024 rate cycle, it is clear that the index is highly sensitive to changes in monetary policy. Historically, when the RSI reaches this zone on SP500, the outcome has been a period of consolidation or further decline about 60% of the time. This pattern last appeared in January 2026, when price subsequently declined by 5% over the following two weeks. Amid the current DXY strength and risk-off environment, the SP500 is under considerable pressure. Correlated with the broader equity selloff, the technical picture remains challenging. This thesis fails if price closes above 6806. Until the NFP data resolves this, caution is warranted.
Track markets in real-time
AI-powered analysis, technical indicators and real-time price data.
Join Our Telegram Channel
Breaking market news, AI analysis and trading signals instantly.
Join Channel