BRENT Eyes $100.57 as Geopolitical Tensions Escalate
BRENT crude oil surges to $100.57 amid escalating geopolitical tensions in the Middle East, overshadowing strategic reserve releases. Is this rally sustainable?
The energy market is on high alert as geopolitical tensions in the Middle East intensify, pushing BRENT crude oil to $100.57. This surge comes despite efforts to ease prices through strategic reserve releases, raising questions about the sustainability of this rally.
- BRENT crude oil price reached $100.57 driven by geopolitical tensions in the Middle East.
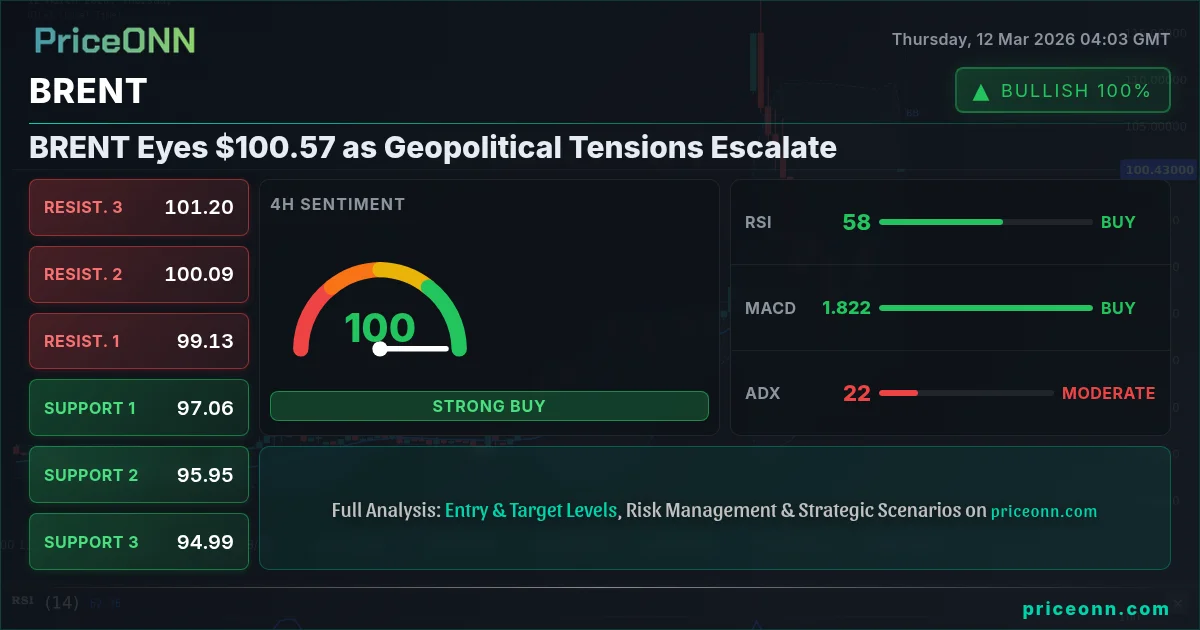
- RSI at 70.26 on the 1H chart signals overbought conditions, suggesting a potential pullback.
- Immediate resistance lies at $101.6, a break above which could trigger further upside.
- Strong dollar, with DXY at 99.23, typically puts downward pressure on commodity prices, including BRENT.
Why Geopolitical Risks are Fueling the Oil Rally
Escalating tensions in the Middle East, particularly around key oil transit chokepoints like the Strait of Hormuz, are the primary drivers behind BRENT's recent surge. These disruptions have injected a significant risk premium into oil prices, as the market fears potential supply curtailments. According to Reuters, attacks in the Strait of Hormuz have fueled supply fears, overshadowing the impact of strategic reserve releases. This is a classic example of geopolitical risk trumping fundamental supply-demand dynamics.
Moreover, the strength of the dollar, as indicated by a DXY level of 99.23, usually acts as a headwind for commodity prices. However, the severity of the geopolitical concerns is currently outweighing the typical inverse correlation between the dollar and oil. This suggests that the market is primarily focused on supply security rather than macroeconomic factors.
BRENT Technical Analysis: Key Levels and Signals
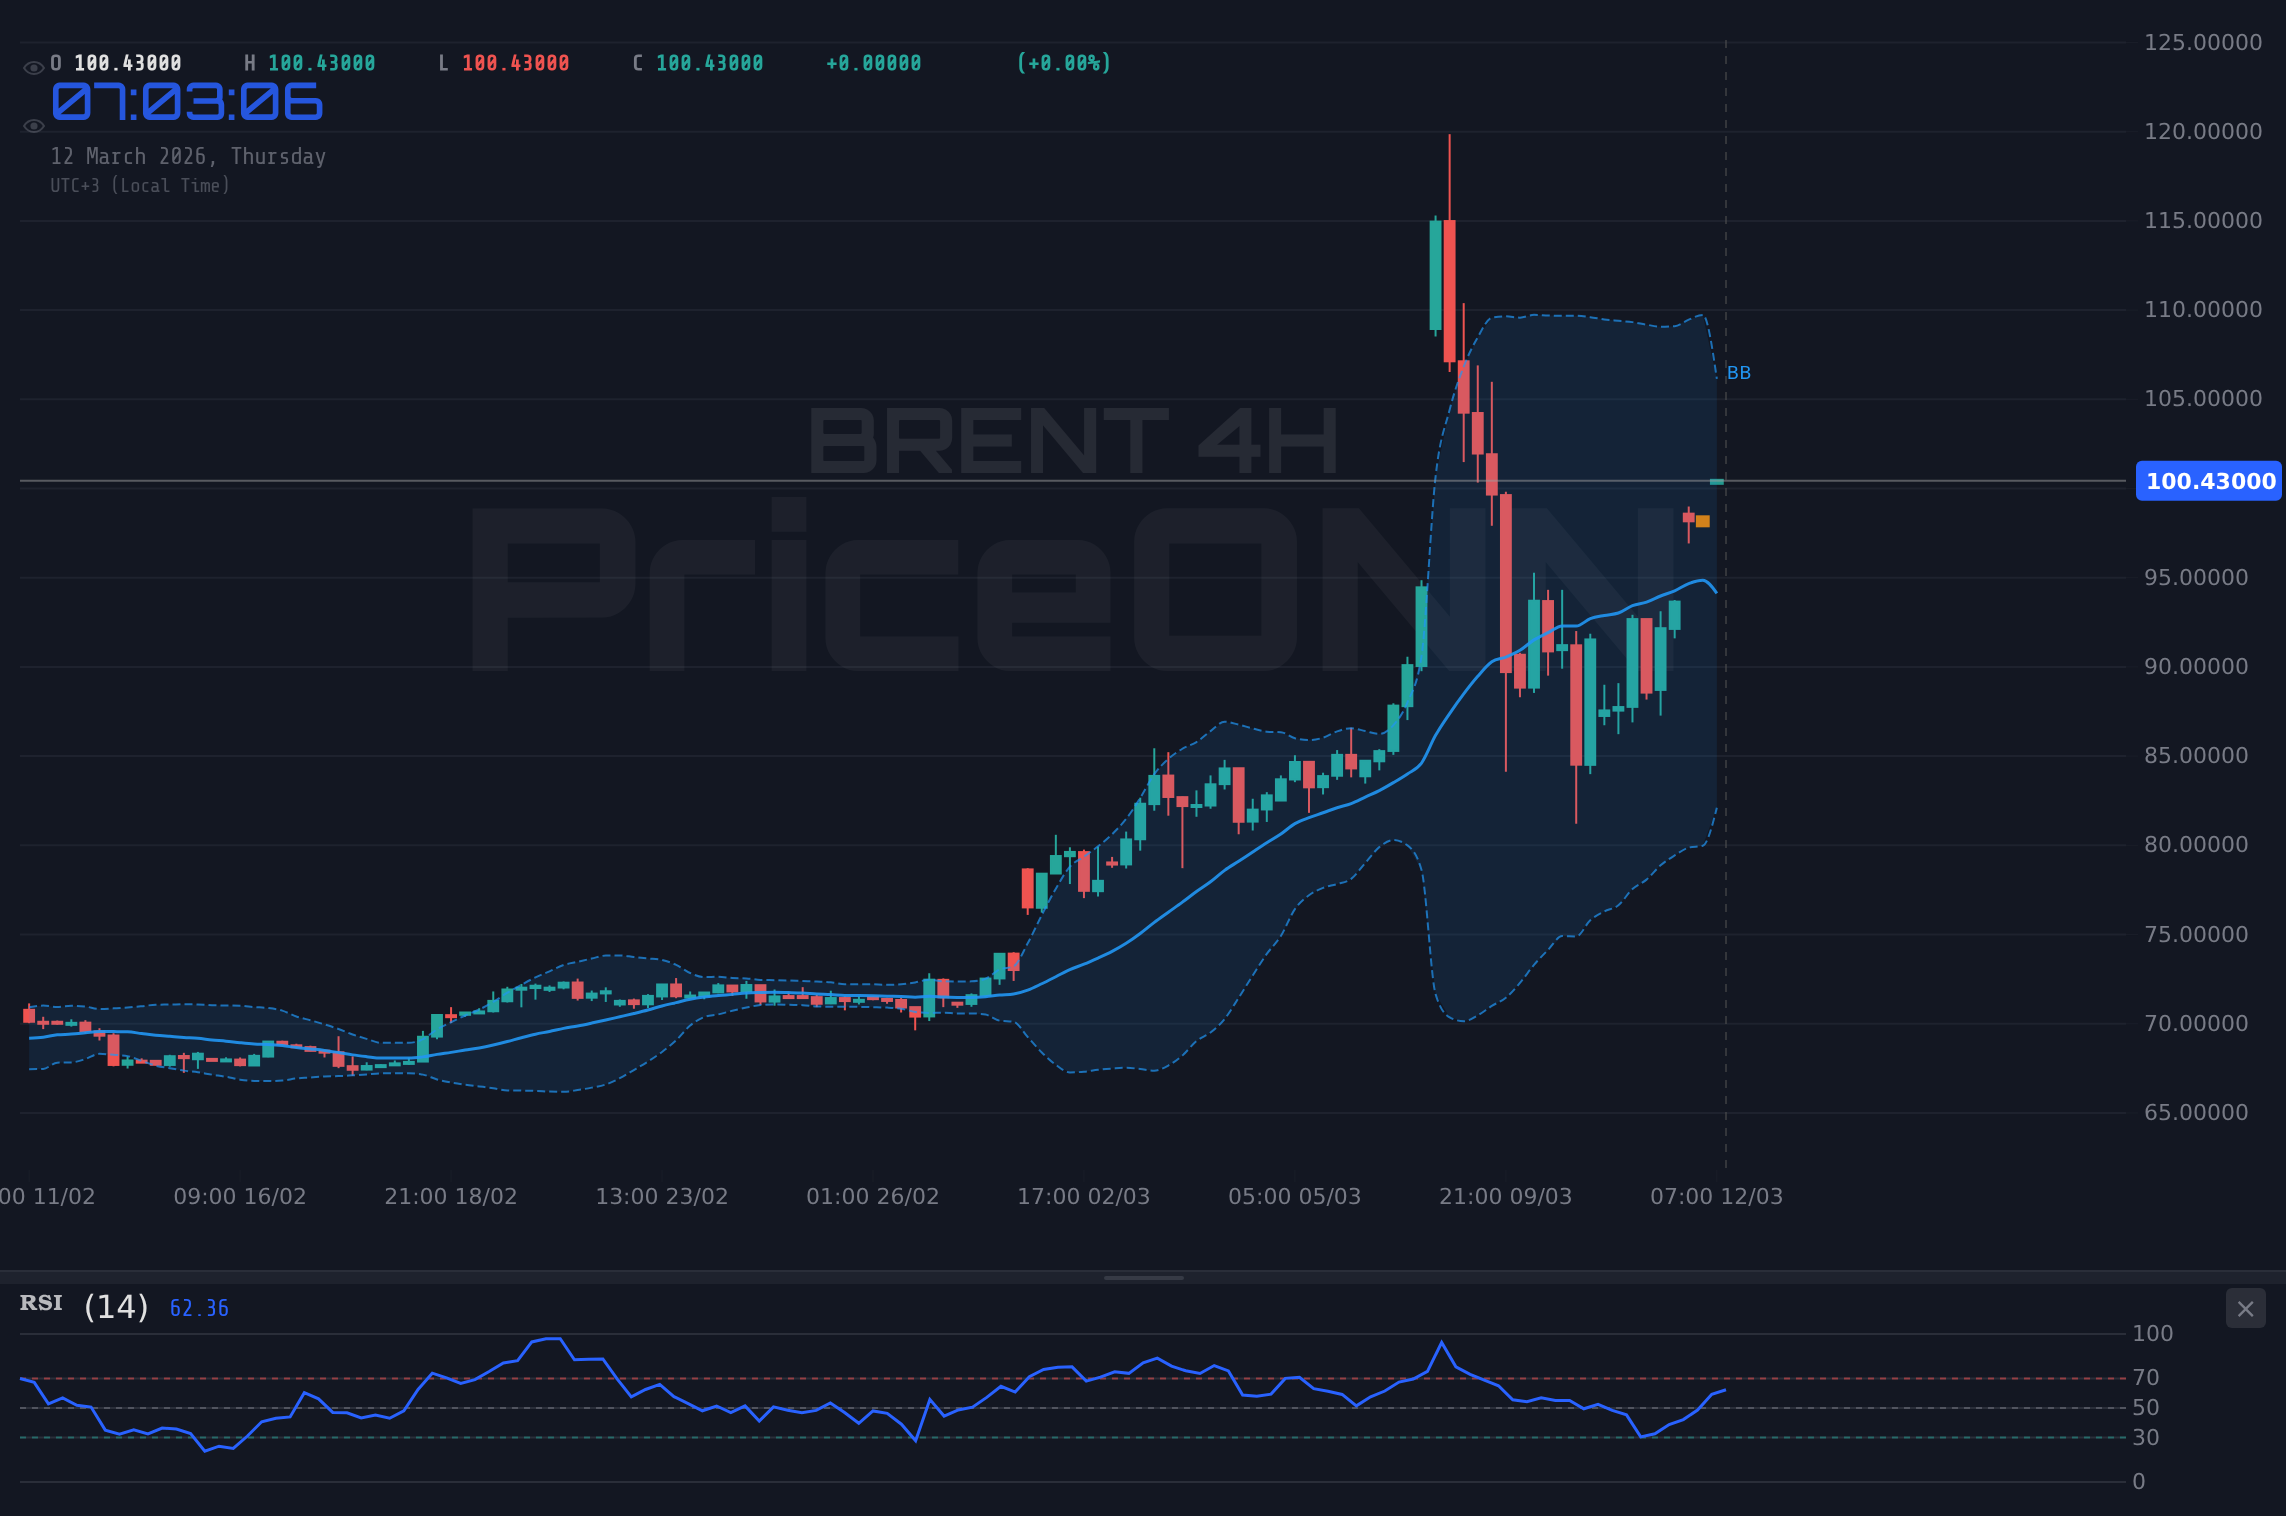
From a technical perspective, BRENT's move above $100 is significant. The 1-hour chart shows an RSI of 70.26, indicating that the market is in overbought territory and may be due for a pullback. However, the 4-hour chart shows an ADX of 24.21, signaling a moderate uptrend, suggesting that the rally may have further to run before exhaustion sets in. The stochastic on the 1H chart shows K=90.29, D=91.25 - signaling overbought conditions.
Key resistance levels to watch are $101.6, $103.2 and $104.92, while support lies at $98.28, $96.56 and $94.96. A break above $101.6 could open the door for a test of higher resistance levels, while a move below $98.28 could signal a deeper correction.
The Impact of Economic Data and Central Bank Policy
While geopolitical risks are currently dominating the narrative, economic data and central bank policy decisions still play a crucial role in shaping the outlook for oil prices. The market is closely watching inflation data, as persistently high inflation could prompt central banks to tighten monetary policy, which could weigh on economic growth and oil demand. The recent rise in oil prices itself could exacerbate inflationary pressures, creating a feedback loop that complicates the task of central banks.
The upcoming economic data releases will be critical in determining the next direction for BRENT. The market will be paying close attention to the upcoming GDP and CPI figures from major economies, as well as any signals from central bank officials regarding their future policy intentions.
Trading Scenarios for BRENT Crude Oil
If geopolitical tensions continue to escalate, BRENT could break above $101.6 and target $103.2 and $104.92. Sustained risk appetite, as indicated by a rising SP500, would support this scenario.
If tensions ease or economic data disappoints, BRENT could fall below $98.28 and target $96.56 and $94.96. A stronger dollar, with DXY above 99.50, would exacerbate this decline.
BRENT and the Broader Energy Market
The surge in BRENT is not occurring in isolation. WTI crude oil is also experiencing upward pressure, currently trading at $94.45. The overall energy complex is being influenced by the same factors: geopolitical risk, supply concerns, and inflation expectations. However, BRENT, as the international benchmark, tends to be more sensitive to global events, while WTI is more closely tied to US domestic factors.
The strength in oil prices is also having a ripple effect across other markets. Gold is facing downward pressure, currently trading at $5152.38, as rising oil prices fuel inflation fears, prompting investors to seek higher yields in bonds. The EUR/USD pair is also under pressure, trading at 1.15389, as concerns about the Eurozone economy mount amid rising energy costs.
Upcoming Economic Events and Market Catalysts
Several key economic events are on the horizon that could significantly impact BRENT prices. The economic calendar shows that the market will be closely watching the GBP data on Friday, March 13th. These figures will provide insights into the health of the global economy and the potential for future oil demand.
Moreover, any further developments in the geopolitical arena could trigger sharp price movements. Traders should remain vigilant and closely monitor news headlines for any signs of escalation or de-escalation in the Middle East.
Risk Management in a Volatile Oil Market
Given the current volatility in the oil market, risk management is paramount. Traders should use appropriate position sizing and stop-loss orders to protect their capital. It is also important to diversify across different asset classes to reduce exposure to any single market.
Furthermore, traders should be aware of the potential for sudden price swings and avoid over-leveraging their positions. The oil market can be highly unpredictable, and it is essential to be prepared for all possible outcomes.
Frequently Asked Questions: BRENT Analysis
What happens if BRENT breaks above $101.6 resistance?
A break above the $101.6 resistance level could trigger a further rally in BRENT, potentially targeting the $103.2 and $104.92 levels. This scenario would likely be driven by continued geopolitical tensions or stronger-than-expected economic data.
Should I buy BRENT at current levels of $100.57 given the RSI at 70.26?
While the RSI at 70.26 on the 1-hour chart suggests overbought conditions, the overall trend remains upward. A cautious approach would be to wait for a pullback to a support level before initiating a long position, using a tight stop-loss order to manage risk.
Is the MACD signal on the daily chart a reliable indicator for BRENT trend analysis?
The MACD on the daily chart is currently showing positive momentum, but it's crucial to consider other factors, such as geopolitical risks and economic data. A confluence of positive signals across multiple timeframes would provide stronger confirmation of the trend.
How will the upcoming GBP data on March 13th affect BRENT this week?
Strong GBP data could support a rally in BRENT by boosting risk appetite and signaling a stronger global economy. Conversely, weak GBP data could weigh on BRENT by raising concerns about economic growth and oil demand.
Technical Outlook Summary
| Indicator | Value | Signal |
|---|---|---|
| RSI (14) | 41.89 | Neutral |
| MACD Histogram | Negative | Bearish |
| Stochastic | 7.38 | Bearish |
| ADX | 17.41 | Weak Trend |
| Bollinger | Upper Band | Watch |
Key Levels
Support Levels
Resistance Levels
Track markets in real-time
AI-powered analysis, technical indicators and real-time price data.
Join Our Telegram Channel
Breaking market news, AI analysis and trading signals instantly.
Join Channel