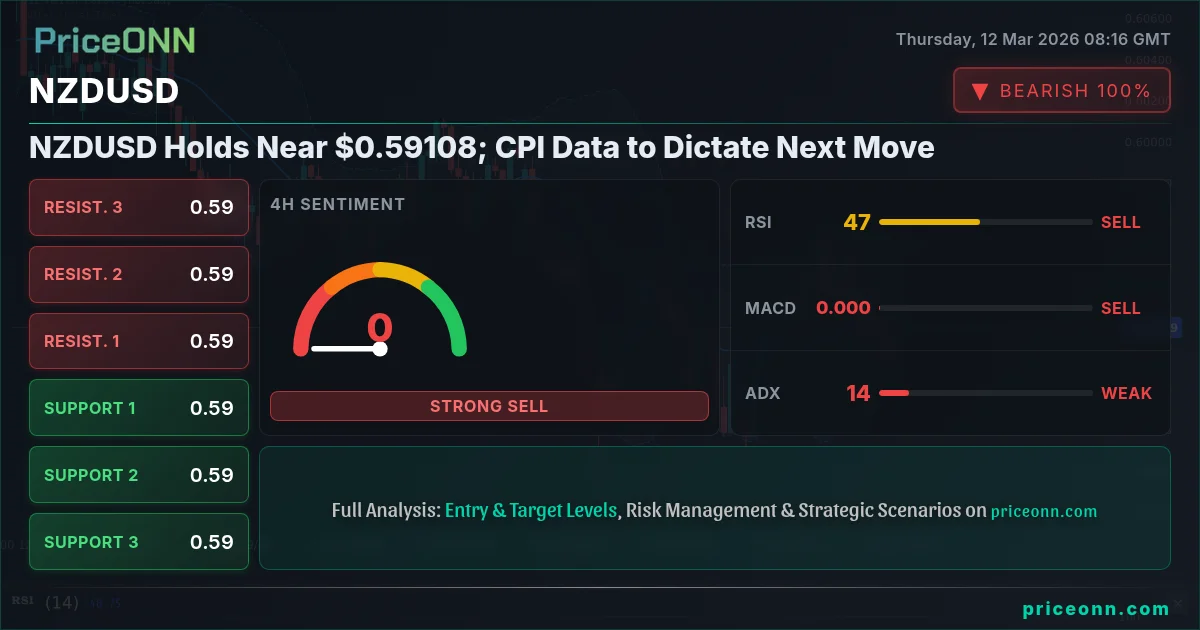
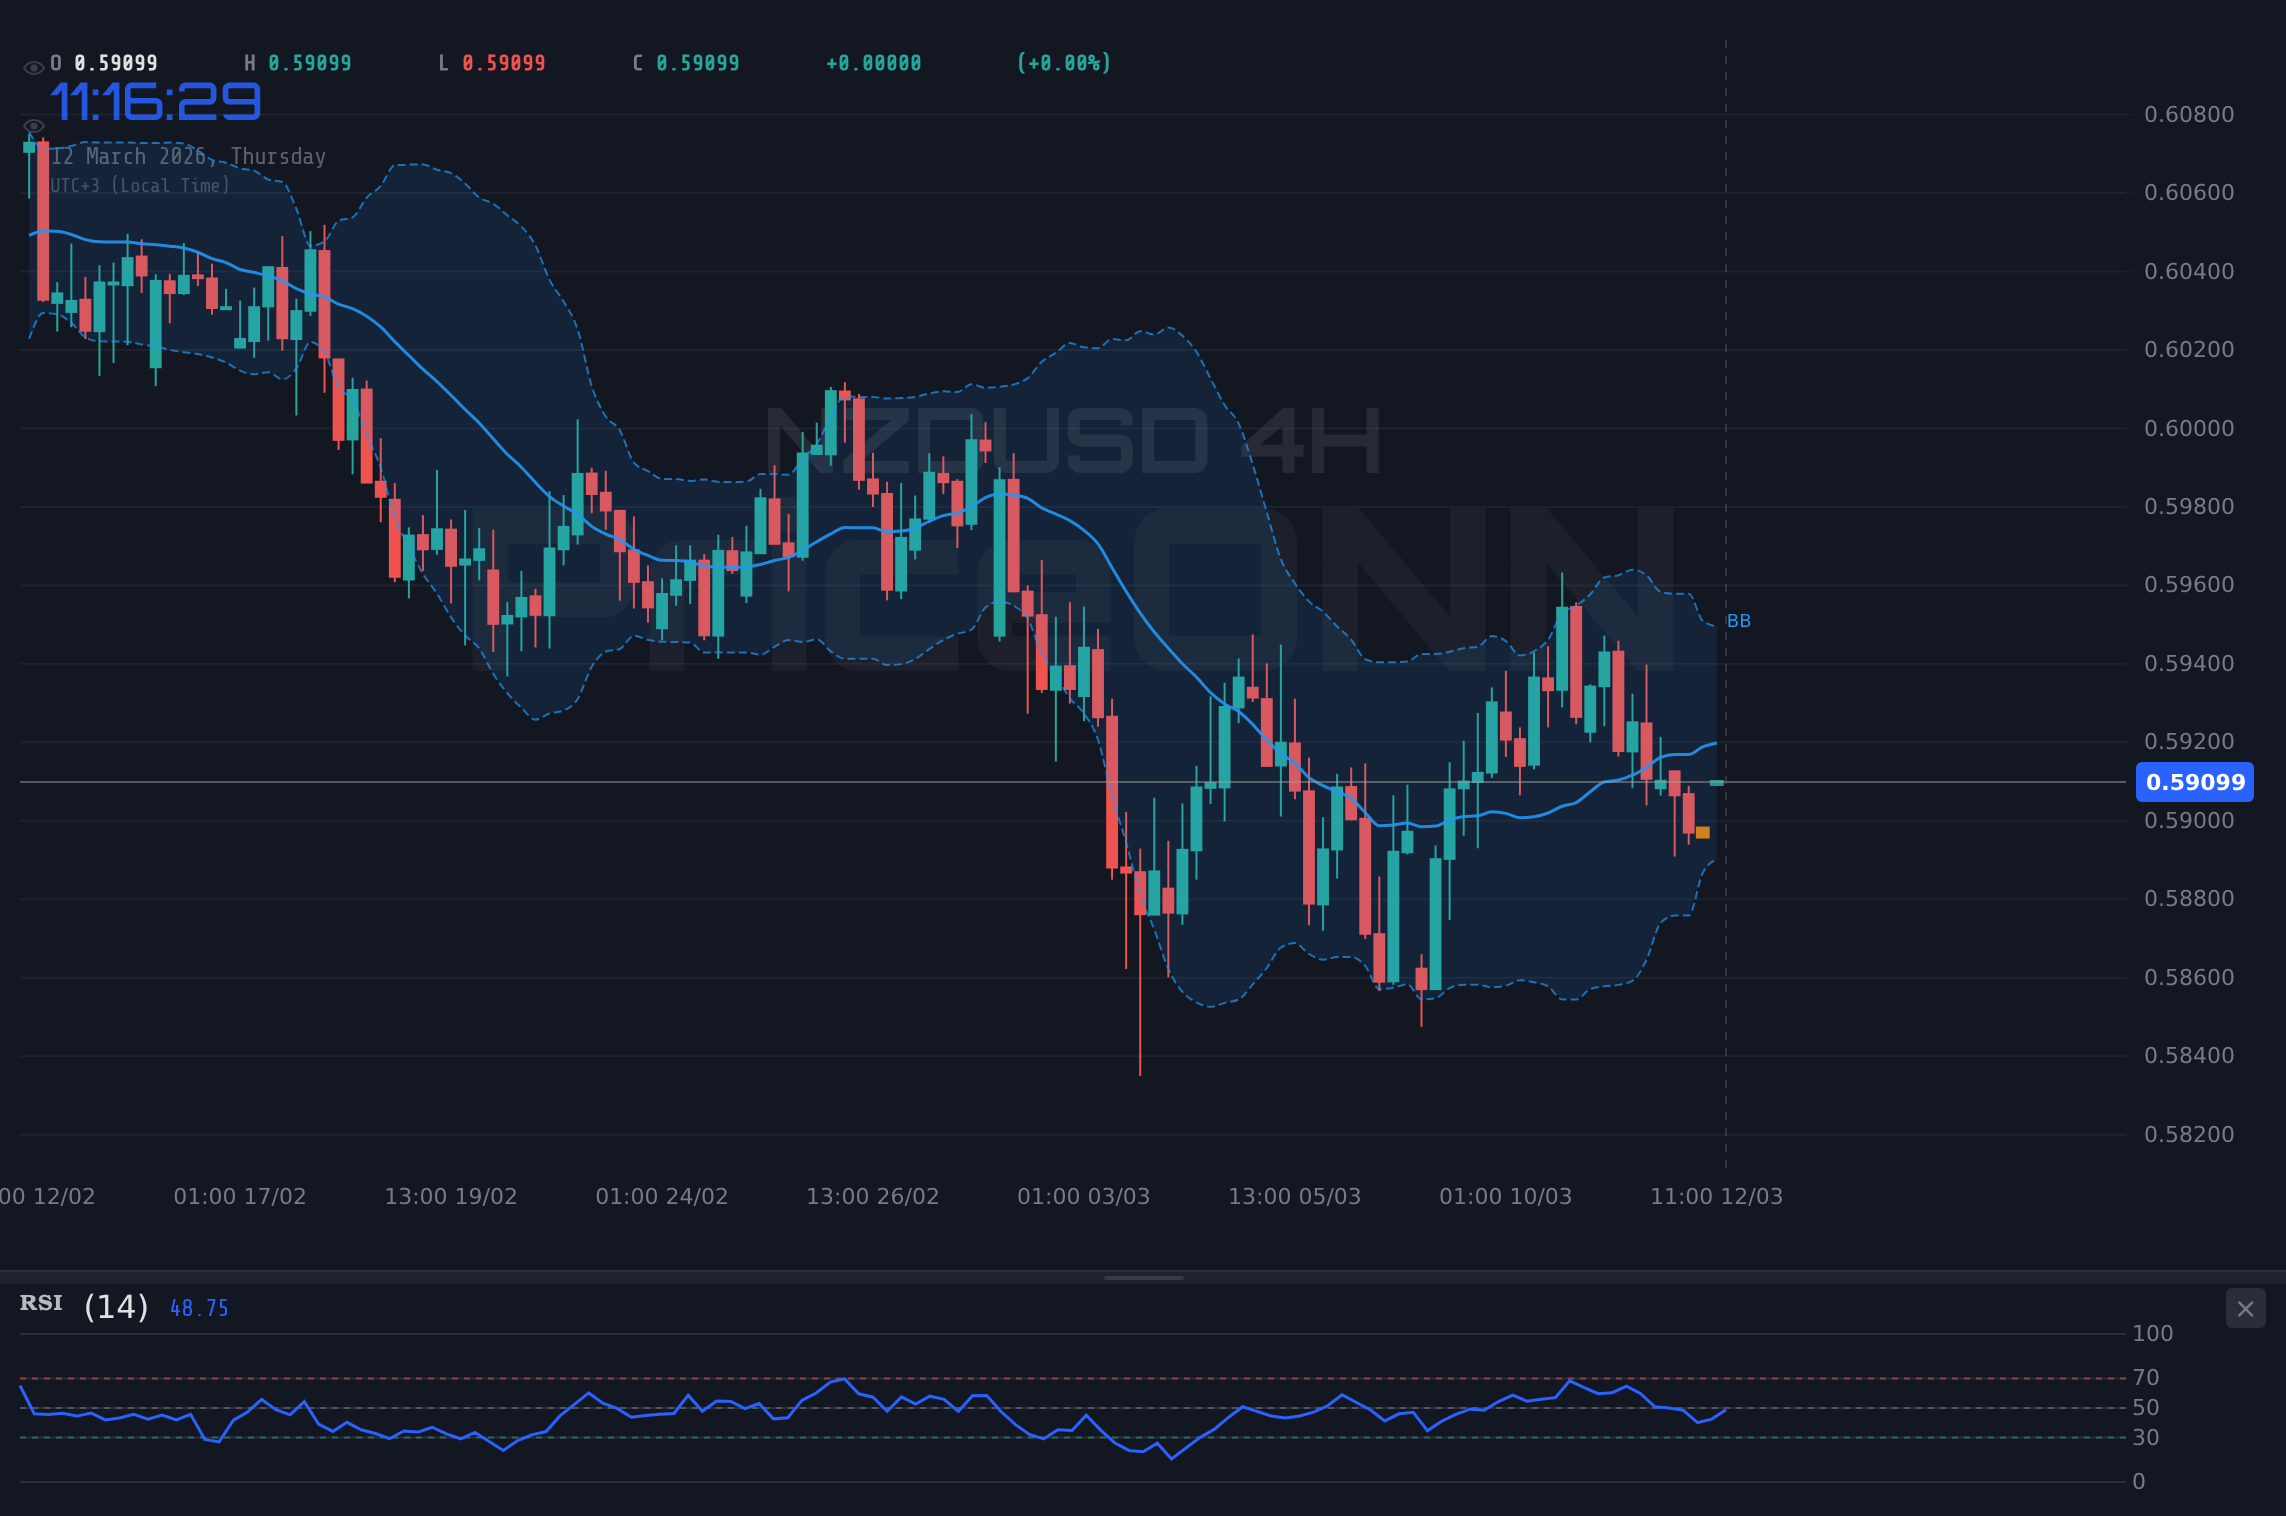
NZDUSD is currently trading near $0.59108, a level that could prove critical as markets brace for upcoming CPI data releases. The pair's direction hinges on whether the CPI data confirms the existing downtrend or triggers a reversal. Traders are closely watching key indicators and support/resistance levels to gauge potential moves.
- RSI currently sits at 45 on the 1H chart, suggesting neutral momentum with a slight bearish lean.
- Key resistance level to watch is $0.59081, while immediate support lies at $0.58966.
- MACD showing momentum is balancing, indicating a potential turning point in the short term.
- Upcoming CPI data is expected to drive NZDUSD correlation with the DXY, impacting overall direction.
Technical Analysis: A Multi-Timeframe Perspective
From a technical standpoint, the 1-hour chart for NZDUSD paints a mixed picture. While the overall trend is bearish, with the ADX at 19.96 indicating a weak trend, the Stochastic oscillator shows a potential bullish signal as %K is greater than %D (45.18 vs 39.76). This divergence suggests that the downtrend might be losing steam, at least in the short term. However, the RSI at 45 remains neutral, offering no clear directional bias. It is hovering near the 50 level, implying that neither bulls nor bears have a firm grip on the market.
Stepping up to the 4-hour timeframe, the bearish sentiment strengthens. The ADX is at 15.26, still indicating a weak trend, but the RSI at 44.22 leans bearish. The Stochastic oscillator also supports a bearish outlook, with %K lower than %D (13.86 vs 25.74), signaling oversold conditions but not necessarily a reversal. The key level to watch here is the resistance at $0.59159, which, if broken, could negate the bearish outlook. Support lies at $0.5894, a break below which would confirm the downtrend.
On the daily chart, the picture remains largely bearish, with the pair trending downwards. The ADX is at 21.38, indicating moderate trend strength. The RSI at 45.05 reinforces the bearish sentiment. Although the Stochastic oscillator shows a potential bullish signal with %K greater than %D (47.76 vs 44.48), the overall technical indicators suggest that bears are still in control. A critical support level to watch is $0.58937. A break below this level could lead to further declines.
Correlation Analysis: DXY's Influence
The DXY (Dollar Index) is currently trading at 99.09, showing a bullish trend with an ADX of 28.68 on the 1-hour chart. This strength in the dollar is putting downward pressure on NZDUSD. Historically, a rising DXY often correlates with a weaker NZDUSD, as the New Zealand dollar is often seen as a risk-on currency, while the US dollar is perceived as a safe haven. Traders should closely monitor the DXY's movement, as further strength in the dollar could exacerbate the bearish sentiment in NZDUSD.
The SP500 is currently at 6746.9, showing a bearish trend with an ADX of 35.71 on the daily chart. This risk-off sentiment in the equity markets could further weigh on NZDUSD, as investors seek safer assets. The correlation between NZDUSD and the SP500 is not always consistent, but during periods of heightened risk aversion, both tend to move in tandem.
Oil prices, with Brent Crude at $96.74 and WTI at $91.18, are showing bullish trends on the daily charts. Rising oil prices can contribute to inflationary pressures, which could influence central bank policies and, in turn, impact currency valuations. For NZDUSD, higher oil prices could indirectly support the New Zealand dollar, as New Zealand is a commodity-exporting nation. However, the overall impact is likely to be overshadowed by the strength of the US dollar and risk aversion in the markets.
The Looming CPI Data: A Potential Game-Changer
The market's focus is squarely on the upcoming CPI data releases. These data points are crucial as they will influence central bank policies, particularly the Federal Reserve's interest rate decisions. Higher-than-expected CPI numbers could lead to a more hawkish stance from the Fed, further strengthening the dollar and putting downward pressure on NZDUSD. Conversely, weaker-than-expected CPI numbers could lead to a more dovish stance, weakening the dollar and potentially supporting NZDUSD.
Specifically, the USD data released on March 10 (Tuesday) and March 11 (Wednesday) will provide insights into the current state of the US economy. Any surprises in these data points could trigger significant volatility in the currency markets. Traders should be prepared for potential whipsaw movements as the market digests the CPI data and its implications for monetary policy.
Trading Strategy: Patience is Key
Given the mixed technical signals and the looming CPI data, a cautious approach is warranted. Scalpers might look for short-term opportunities based on intraday price action, focusing on key support and resistance levels. Swing traders should wait for a clearer directional bias to emerge after the CPI data is released, looking for potential breakout or breakdown patterns. Long-term investors should monitor the overall macroeconomic environment, including central bank policies and economic growth indicators, before making any significant investment decisions.
Trading forex involves significant risk of loss and is not suitable for all investors. The use of leverage can magnify both gains and losses. Past performance is not indicative of future results. Traders should carefully consider their financial situation and risk tolerance before engaging in any trading activity.
Bearish Scenario: Downtrend Continuation
If the CPI data confirms the existing downtrend, NZDUSD could break below the immediate support level of $0.58966 and head towards the next support at $0.58901. A break below this level could trigger a further decline towards $0.58851. This scenario is supported by the bearish sentiment in the equity markets and the strength of the US dollar.
Bullish Scenario: Potential Reversal
If the CPI data surprises to the downside, NZDUSD could break above the immediate resistance level of $0.59081 and head towards the next resistance at $0.59131. A break above this level could signal a potential reversal of the downtrend, with the pair targeting higher levels. This scenario is contingent on a weaker US dollar and a risk-on sentiment in the markets.
Frequently Asked Questions: NZDUSD Analysis
What happens if NZDUSD breaks below $0.58966 support?
If NZDUSD breaks below $0.58966, it could signal further downside momentum. The next support level to watch would be $0.58901, and a break below that could lead to a test of $0.58851. This scenario is most likely if the upcoming CPI data strengthens the US dollar.
Should I buy NZDUSD at current levels of $0.59108 given the RSI at 45?
With the RSI at 45, the market is in a neutral zone, so buying at the current level of $0.59108 is risky. It's better to wait for a clearer signal, either a break above resistance or a confirmed bounce off support, before making a decision. Monitor the CPI data for further clues.
Is the Stochastic oscillator's bullish signal reliable given the overall bearish trend?
While the Stochastic oscillator is showing a potential bullish signal, it's important to consider the overall bearish trend. The Stochastic signal should be viewed with caution, as it could be a false signal. Look for confirmation from other indicators before acting on the Stochastic signal.
How will the upcoming CPI data affect NZDUSD this week?
The upcoming CPI data is likely to have a significant impact on NZDUSD this week. Stronger-than-expected CPI data could strengthen the US dollar, putting downward pressure on NZDUSD. Weaker-than-expected CPI data could weaken the US dollar, potentially supporting NZDUSD. Keep an eye on the DXY for immediate correlation.
Track markets in real-time
AI-powered analysis, technical indicators and real-time price data.
Join Our Telegram Channel
Breaking market news, AI analysis and trading signals instantly.
Join Channel