The Dollar Index (DXY) is currently testing a key resistance level at $99.11, a level that could determine the short-term direction of the dollar. The DXY, which measures the dollar's strength against a basket of six major currencies, has been trending upward, fueled by expectations of continued hawkish monetary policy from the Federal Reserve and as geopolitical tensions escalate.
- RSI at 64.59 on the 1H chart suggests increasing bullish momentum for DXY
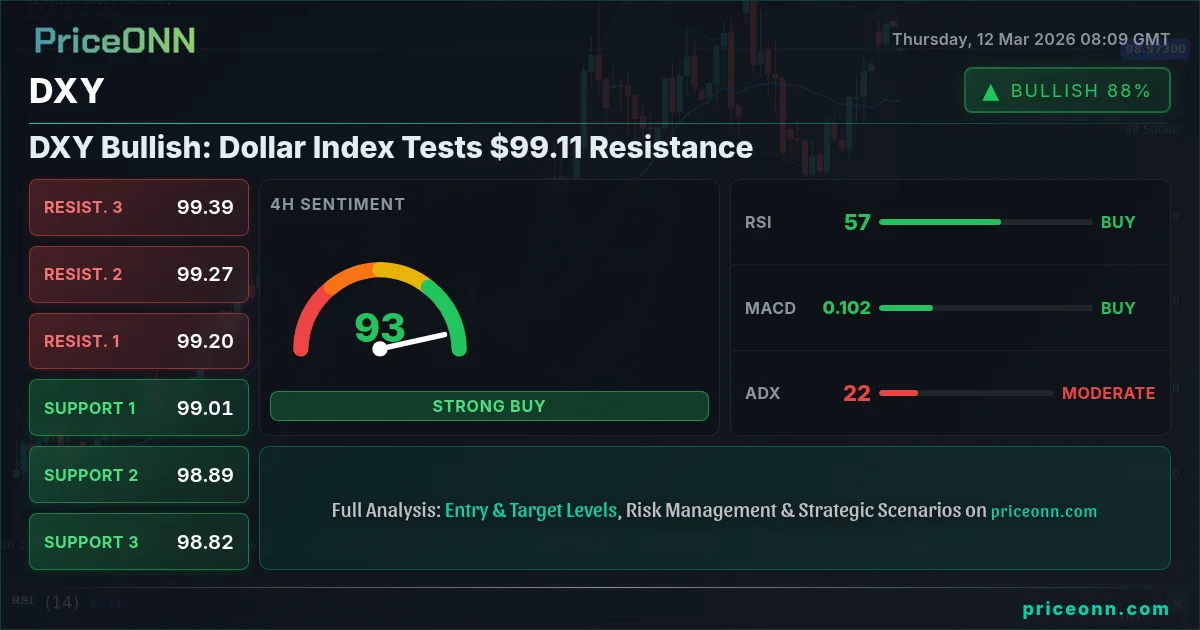
- Key resistance at $99.11 could trigger a breakout if broken decisively
- The ADX at 27.38 on the daily chart indicates a strong upward trend for the Dollar Index
- Rising oil prices due to geopolitical tensions are fueling inflation fears, supporting the DXY
The dollar's strength is being further supported by rising oil prices, which are stoking fears of inflation. Brent crude, for example, is currently trading at $95.94, up 2.43% on the day. According to recent news, geopolitical tensions in the Middle East are adding to supply concerns, pushing oil prices higher and, consequently, fueling inflation expectations. With inflation remaining a key concern for the Fed, the central bank is likely to maintain its hawkish stance, further bolstering the dollar.
Looking at the technical indicators, the 1-hour chart shows the RSI at 64.59, indicating increasing bullish momentum. The 4-hour RSI is at 61.93, also suggesting a continued upward trend. However, the Stochastic on the 1-hour chart presents a potential bearish signal, with K at 77.73 and D at 85.21, hinting at a possible pullback in the short term. The daily chart's RSI at 66.72 further supports the bullish outlook, with the ADX at 27.38 indicating a strong upward trend.
Key support levels to watch are at 98.99, 98.94 and 98.87 on the 1-hour timeframe. These levels could act as potential bounce-back points should the DXY experience a short-term retracement. On the upside, immediate resistance lies at $99.11, followed by 99.17 and 99.22. A decisive break above $99.11 could open the door for further gains, potentially targeting the 99.33 level on the daily timeframe.
The EUR/USD pair, which has an inverse relationship with the DXY, is currently trading at 1.15539, down 0.17% on the day. The strong DXY is putting downward pressure on the EUR/USD. Similarly, GBP/USD is trading at 1.33929, also experiencing a slight decline. Gold, often seen as a safe-haven asset, is currently trading at $5,183.99, up slightly by 0.16%. However, gold's gains are being capped by the stronger dollar. With the SP500 down 0.24%, risk appetite is declining, which could support safe-haven currencies, but the dollar is benefiting more from its strength.
According to Reuters, Fed officials have emphasized that inflation remains 'stubborn,' reinforcing expectations of continued rate hikes. Market participants will be closely watching upcoming economic data releases, particularly the GBP data on Friday, to gauge the strength of the UK economy and its potential impact on the pound. Stronger-than-expected data could provide some support to the pound, but the overall trend is likely to remain downward as long as the dollar maintains its strength. The USD data on Friday will also be crucial, as it will provide further insights into the health of the US economy and the Fed's likely policy path.
The oil market is experiencing significant volatility, with Brent crude trading at $95.94 and WTI crude at $90.51. The surge in oil prices is being driven by geopolitical tensions, particularly in the Middle East, which are raising concerns about potential supply disruptions. This is further contributing to inflation fears, which are supporting the dollar. However, the US government's announcement of a massive SPR release could potentially dampen oil prices, providing some relief to inflation concerns and potentially easing pressure on the Fed to raise rates aggressively. According to recent news, WTI oil plunged below $78 after the US announced a massive SPR release, but this effect may be temporary if geopolitical tensions continue to escalate.
The economic calendar is relatively light today, but Friday's GBP and USD data releases will be closely watched. Investors will be paying particular attention to the USD data, including the unemployment rate and average hourly earnings, for further clues about the health of the US economy and the Fed's likely policy path. A strong jobs report could reinforce expectations of continued rate hikes, further boosting the dollar. Conversely, a weaker-than-expected report could prompt the Fed to reconsider its hawkish stance, potentially leading to a pullback in the dollar.
Despite the strong upward trend, there are some potential risks to the dollar's rally. A significant escalation of geopolitical tensions could lead to a flight to safety, benefiting other safe-haven currencies such as the Swiss franc and the Japanese yen. Additionally, a sharp correction in the equity markets could trigger a broad-based risk-off move, potentially leading to a decline in the dollar. However, for now, the prevailing trend is upward, supported by hawkish Fed expectations and rising oil prices.
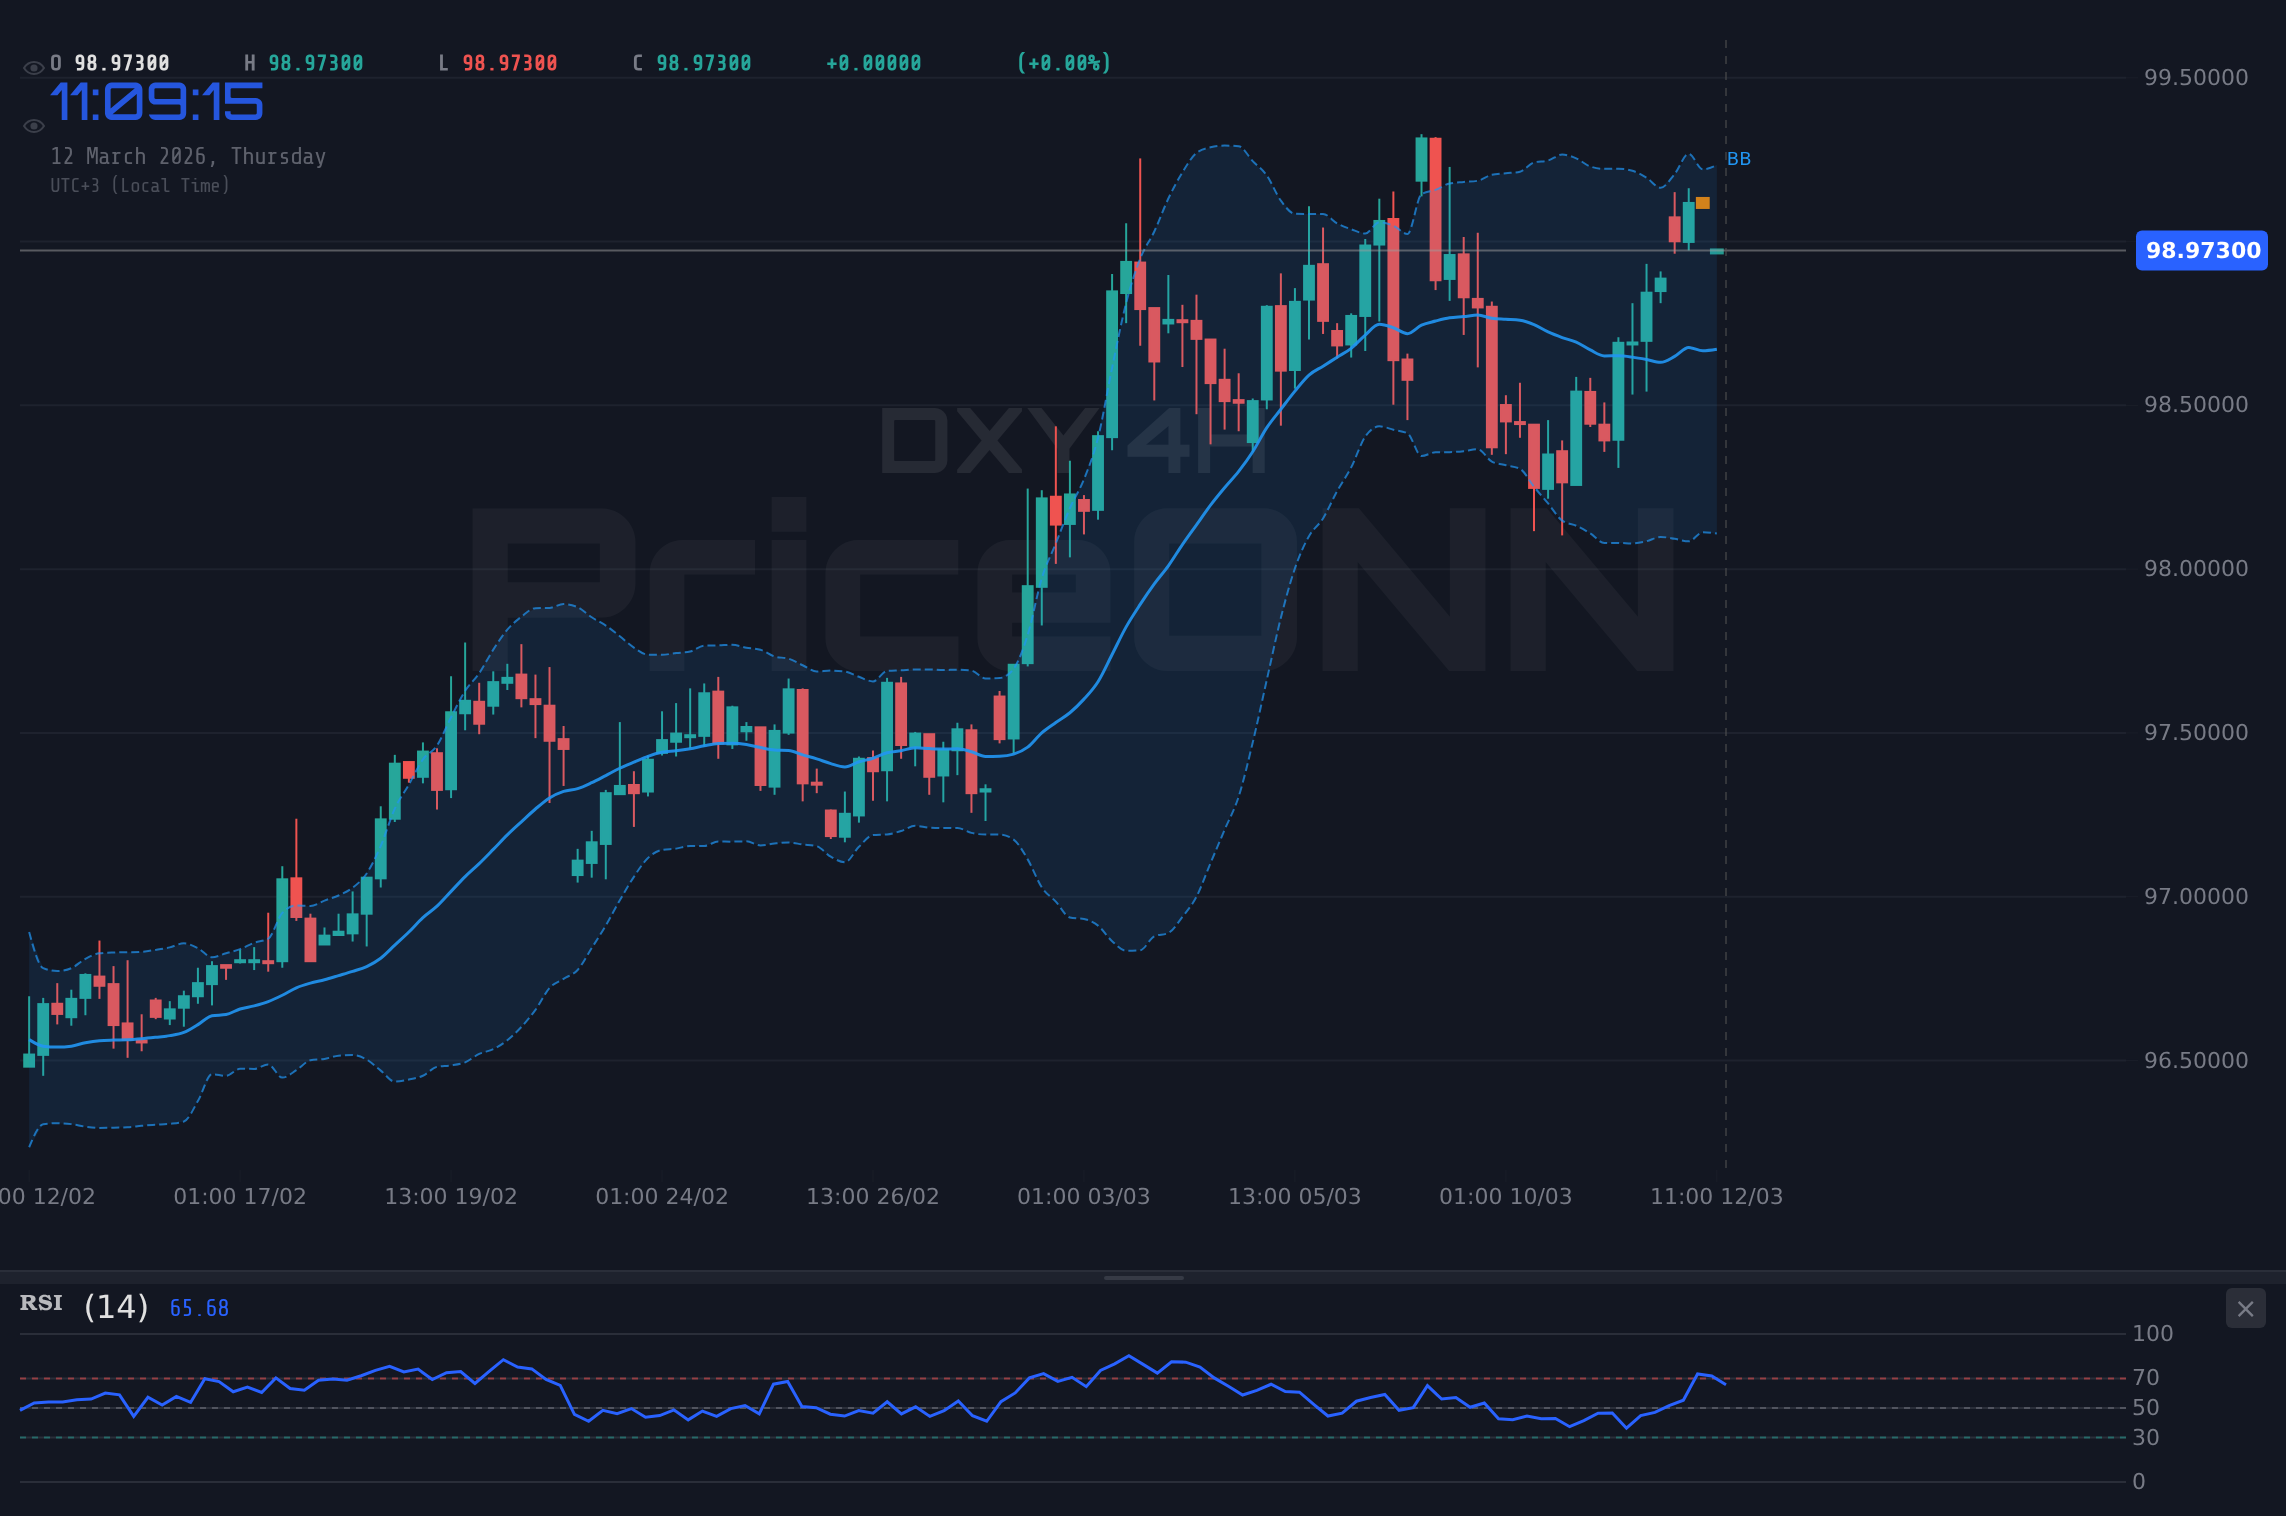
The 4-hour chart shows that DXY is in an uptrend. Support is at 98.93, 98.85, and 98.74, while resistance is at $99.11, 99.23, and 99.3. ADX is at 21.59, suggesting a moderate uptrend, and Stochastic is in overbought territory at 91.29 and 81.99, suggesting caution. The 1-day chart shows similar signals. Support sits at 98.49, 98.09, and 97.86, while resistance is at $99.11, 99.33, and 99.73. The RSI is at 66.72, which is still in neutral territory, with ADX at 27.38 suggesting a strong uptrend and Stochastic at 76.94 and 69.14 reinforcing the uptrend.
Fundamentally, the strength in the dollar is being driven by expectations of continued hawkish monetary policy from the Federal Reserve. The central bank is widely expected to raise interest rates further in the coming months in order to combat inflation. According to recent news, Fed officials have emphasized that inflation remains 'stubborn,' reinforcing expectations of continued rate hikes. The strong dollar is also being supported by rising oil prices, which are stoking fears of inflation. Geopolitical tensions in the Middle East are adding to supply concerns, pushing oil prices higher and, consequently, fueling inflation expectations.
DXY is currently at $99.11, testing resistance. The short-term outlook is bullish, with the potential for further gains if the index can break above this level. However, traders should be aware of the potential for a pullback, particularly if upcoming economic data releases disappoint or if geopolitical tensions ease. Key support levels to watch are at 98.99, 98.94 and 98.87 on the 1-hour timeframe. A decisive break above $99.11 could open the door for further gains, potentially targeting the 99.33 level on the daily timeframe.
Frequently Asked Questions: DXY Analysis
What happens if DXY breaks above $99.11 resistance?
A decisive break above the $99.11 resistance level could open the door for further gains, potentially targeting the 99.33 level on the daily timeframe. This would likely be driven by continued hawkish monetary policy expectations from the Federal Reserve and sustained high oil prices.
Should I buy DXY at current levels of $99.11 given RSI at 64.59?
With the RSI at 64.59 on the 1-hour chart, the DXY is showing increasing bullish momentum, but it is not yet in overbought territory. A cautious approach would be to wait for a confirmed break above the $99.11 resistance level before considering a long position, with a stop-loss order placed below the nearest support level.
Is ADX at 27.38 a strong buy signal for DXY?
The ADX at 27.38 on the daily chart indicates a strong upward trend for the Dollar Index, which supports the bullish outlook. However, it is important to consider other factors, such as upcoming economic data releases and geopolitical risks, before making a trading decision.
How will the Friday USD data affect DXY this week?
The Friday USD data, including the unemployment rate and average hourly earnings, will be crucial in determining the DXY's direction this week. A strong jobs report could reinforce expectations of continued rate hikes, further boosting the dollar, while a weaker-than-expected report could prompt the Fed to reconsider its hawkish stance, potentially leading to a pullback in the dollar.
The market is dynamic and ever-changing. Stay informed and adapt your strategies accordingly.
Technical Outlook Summary
| Indicator | Value | Signal |
|---|---|---|
| RSI (14) | 66.72 | Neutral |
| MACD Histogram | Positive | Bullish |
| Stochastic | 76.94/69.14 | Bullish |
| ADX | 27.38 | Strong Trend |
| Bollinger | Upper Band | Watch |
Key Levels
Support Levels
Resistance Levels
Track markets in real-time
AI-powered analysis, technical indicators and real-time price data.
Join Our Telegram Channel
Breaking market news, AI analysis and trading signals instantly.
Join Channel