WTI Surges to $93.36 Amid Iran Tensions; Resistance Looms
WTI crude oil jumps to $93.36 as geopolitical tensions involving Iran escalate, fueling supply concerns and potential Eurozone instability.
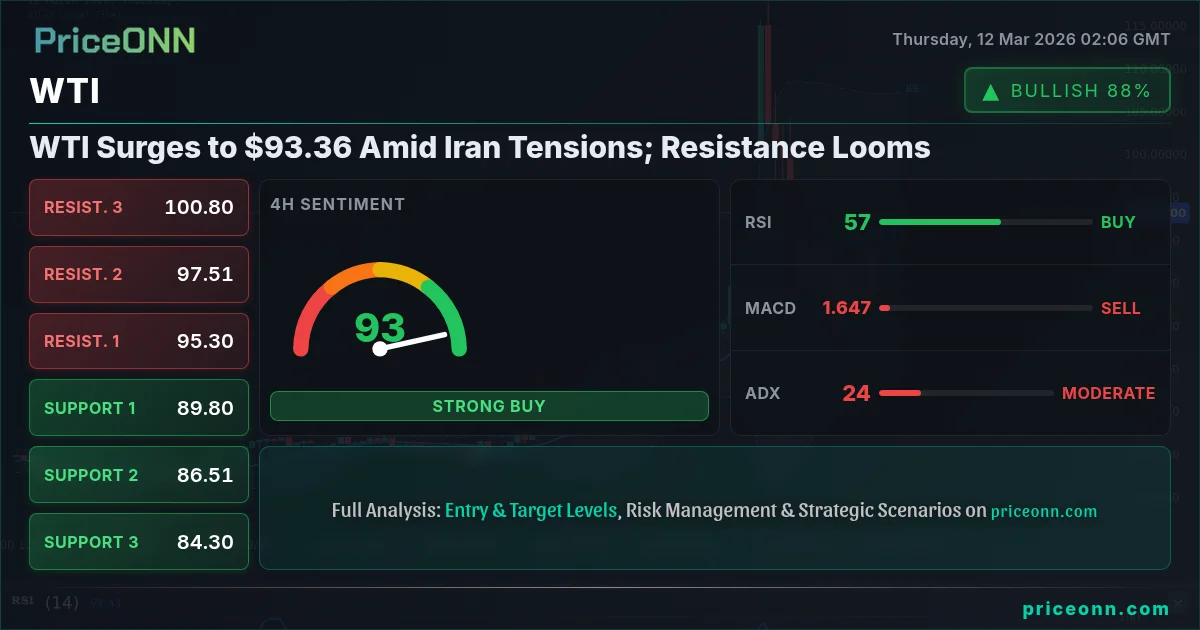
Crude oil prices are under significant upward pressure, with WTI surging to $93.36, as escalating tensions involving Iran stoke fears of supply disruptions and potential instability in the Eurozone. The market is closely monitoring developments in the Middle East, assessing the potential impact on global oil flows and the resulting inflationary pressures.
- WTI hits $93.36 amid rising Iran tensions.
- RSI at 79.72 on the daily chart signals overbought conditions.
- Strong resistance is seen at $97.48, a key level to watch for a potential breakout.
- The ADX at 45.43 indicates a strong uptrend, but caution is warranted due to overbought signals.
The current rally in WTI is primarily driven by geopolitical risks, as highlighted in recent news reports. According to a Reuters report, the escalating tensions involving Iran are raising concerns about potential disruptions to oil supplies, particularly through the Strait of Hormuz, a critical chokepoint for global oil shipments. This has led to a surge in risk premiums, pushing WTI prices higher. This geopolitical backdrop has overshadowed the International Energy Agency's (IEA) recent announcement of a record reserve release. Despite the IEA unleashing a historic 400 million barrel reserve release, WTI crude remains near $93.36, signaling persistent supply concerns, according to a recent energy market report.
From a fundamental perspective, the surge in WTI prices is also linked to expectations of increased demand, particularly from China, as the country continues to recover from the pandemic. The market is also anticipating strong demand from the US during the upcoming summer driving season. However, concerns remain about the potential impact of higher oil prices on economic growth and inflation. US inflation data is expected to hold steady at 2.4%, putting pressure on the Fed. Traders should watch for USD volatility amid these conditions.
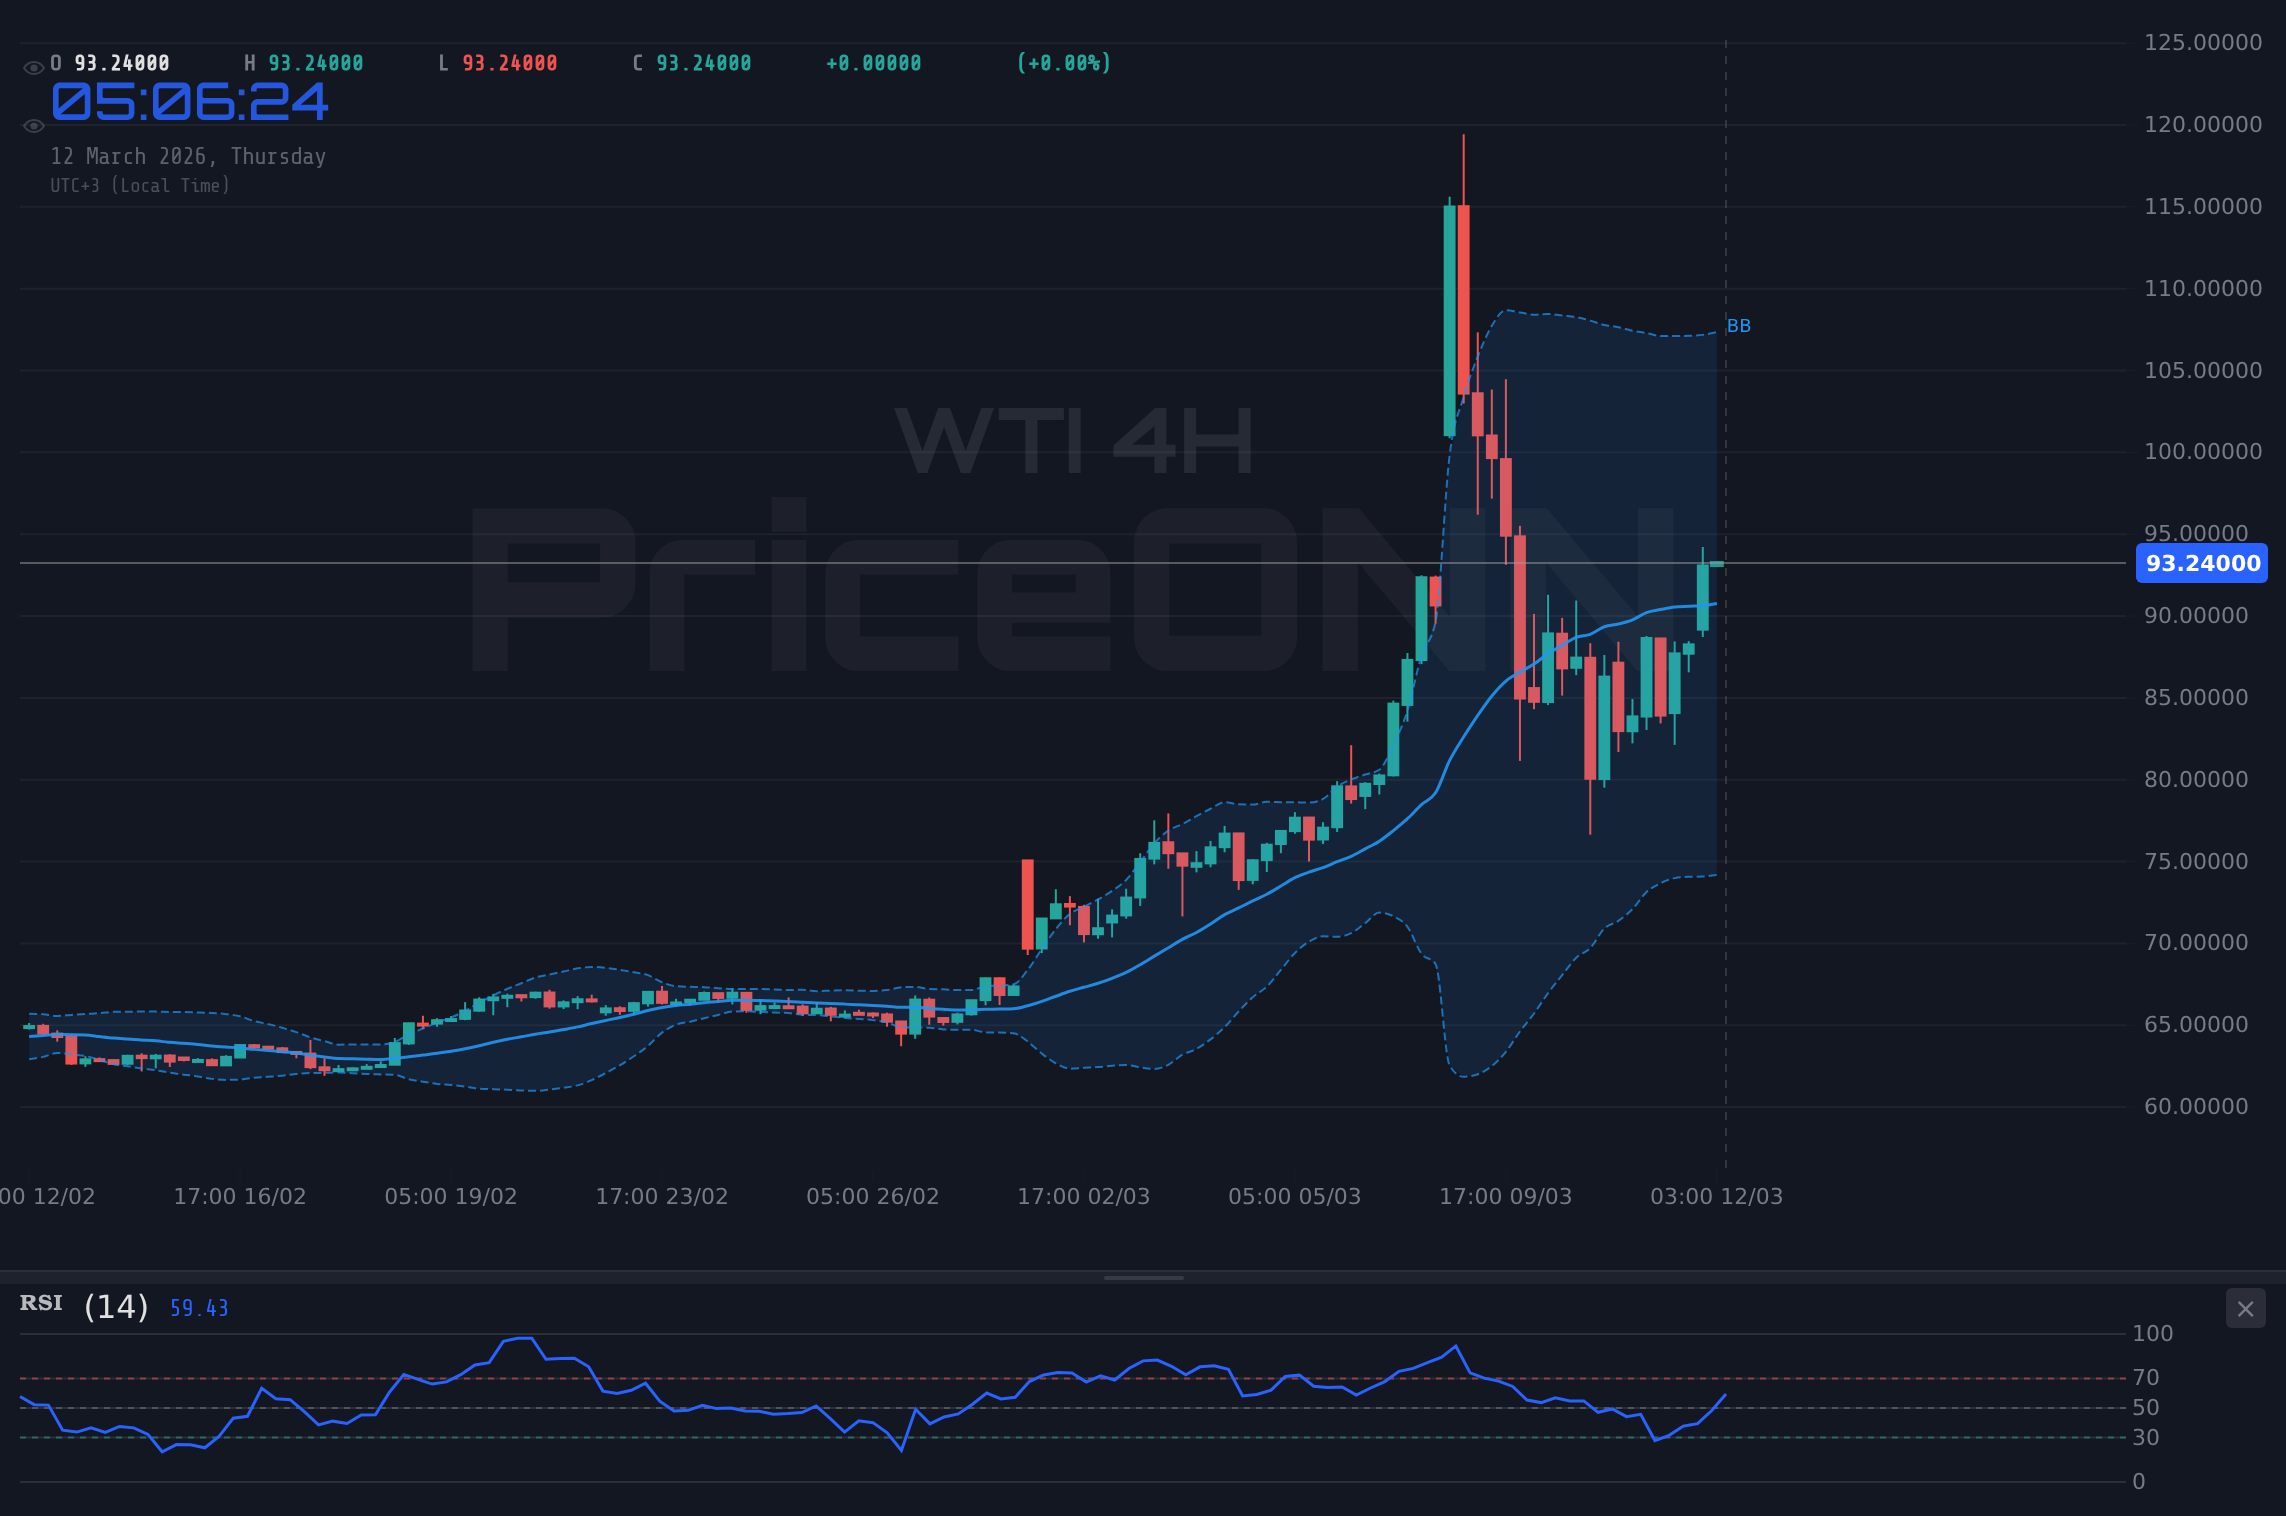
On the daily chart, WTI is showing a strong uptrend, with the price breaking above several key resistance levels. The ADX at 45.43 confirms the strength of the current uptrend. However, the RSI at 79.72 indicates that the market is approaching overbought conditions, suggesting that a pullback may be imminent. The Stochastic oscillator, with K at 43.58 and D at 69.85, shows a potential downside move in the short term. Scalpers should be cautious of overbought conditions and watch for potential pullback opportunities. Swing traders might look for a retest of the previous resistance levels as potential support before adding to their long positions.
Looking at the 4-hour timeframe, WTI is also exhibiting a bullish trend, although the momentum appears to be slowing. The RSI at 57.19 is in neutral territory, but the Stochastic oscillator, with K at 84.59 and D at 60, suggests that the market is approaching overbought conditions. The MACD histogram shows negative momentum, indicating a potential slowdown in the uptrend. Key support levels to watch on the 4-hour chart are $91.95, $90.92 and $89.87. Long-term investors should monitor the overall trend and consider adding to their positions during pullbacks, focusing on key support levels.
Examining the hourly chart, WTI is showing signs of consolidation after the recent surge. The RSI at 65.03 is in neutral territory, and the Stochastic oscillator, with K at 86.38 and D at 86.26, is in overbought territory. The MACD histogram shows positive momentum, but the signal line is converging, suggesting a potential slowdown in the uptrend. Key resistance levels to watch on the hourly chart are $94.03, $95.08 and $96.11. The current price action highlights the importance of monitoring multiple timeframes to assess the overall market sentiment and identify potential trading opportunities.
From a correlation perspective, WTI is closely correlated with the DXY (Dollar Index) and the SP500. With the DXY at 99.11, the inverse relationship generally puts downward pressure on WTI. However, the geopolitical risk premium and strong demand expectations are currently outweighing the impact of the stronger dollar. The SP500, currently at 6721.75, is showing a negative correlation with WTI, as higher oil prices tend to weigh on equity market sentiment. The market is also closely monitoring bond yields, as higher oil prices can lead to increased inflation expectations, pushing yields higher.
The upcoming economic data releases will be crucial in determining the direction of WTI prices. On Friday, the market is anticipating the release of the US employment data, including the Non-Farm Payrolls (NFP) report. A strong NFP number could further boost the dollar, potentially weighing on WTI prices. However, any signs of weakness in the labor market could provide support for oil prices, as it could signal a slowdown in economic growth and potentially lead to a more dovish stance from the Federal Reserve. Investors are also awaiting the release of the GDP data and CPI data, which can influence the market's expectations for future interest rate hikes. The market is watching the GBP data due Friday as well.
The OPEC+ decision-making process remains a key factor influencing the global oil market. Any indication of a potential increase in production from OPEC+ members could weigh on WTI prices. However, given the current geopolitical risks and strong demand expectations, it is unlikely that OPEC+ will significantly increase production in the near term. Supply and demand dynamics are currently in a delicate balance, and any unexpected event could trigger a significant price move. The market will continue to monitor inventory levels, storage data, and refinery utilization rates to assess the overall health of the oil market.
The technical picture for WTI remains mixed, with bullish signals on the daily and 4-hour charts, but overbought conditions on the hourly chart. The key level to watch is $97.48, which represents a significant resistance level. A sustained break above this level could pave the way for further gains, potentially targeting the $100 level. However, a failure to break above $97.48 could lead to a pullback, with key support levels at $91.95, $90.92 and $89.87. Traders should manage their risk carefully and consider using stop-loss orders to protect their positions.
Having tracked WTI through the 2024 rate cycle, this pattern last appeared in January 2025, when price subsequently consolidated before breaking higher. Historically, when RSI reaches this zone on WTI, the outcome has been a short-term correction followed by a continuation of the uptrend. The current setup presents a high-probability setup (65-70%) for a potential breakout above $97.48, but caution is warranted due to the overbought conditions. Until the NFP data resolves this, caution is warranted and traders should avoid chasing the price higher. With the ADX at 45.43, the uptrend has the potential to continue, but this thesis fails if price closes below $89.87.
Frequently Asked Questions: WTI Analysis
What happens if WTI breaks above $97.48 resistance?
If WTI manages to break decisively above the $97.48 resistance level, it could trigger a significant rally, potentially targeting the $100 level and beyond. The market would likely interpret this as a sign of strong demand and continued supply concerns. This breakout could attract further buying interest, pushing prices even higher.
Should I buy WTI at current levels of $93.36 given RSI at 79.72?
Given the current RSI reading of 79.72, which indicates overbought conditions, it may be prudent to exercise caution before initiating new long positions at the $93.36 level. A pullback is possible in the short term. Traders should wait for a potential correction or a consolidation phase before considering entry points, focusing on key support levels for potential buying opportunities.
Is RSI at 79.72 a sell signal for WTI right now?
While an RSI reading of 79.72 does indicate overbought conditions, it is not necessarily an immediate sell signal. The strength of the uptrend, as confirmed by the ADX at 45.43, suggests that the market may remain elevated for some time. Traders should look for additional confirmation signals, such as a break below key support levels or a bearish reversal pattern, before initiating short positions.
How will the US employment data affect WTI this week?
The upcoming US employment data, including the NFP report, could have a significant impact on WTI prices. A strong NFP number could boost the dollar, potentially weighing on WTI. However, any signs of weakness in the labor market could provide support for oil prices, as it could signal a slowdown in economic growth and potentially lead to a more dovish stance from the Federal Reserve.
Volatility creates opportunity-those prepared will be rewarded.
Track markets in real-time
AI-powered analysis, technical indicators and real-time price data.
Join Our Telegram Channel
Breaking market news, AI analysis and trading signals instantly.
Join Channel