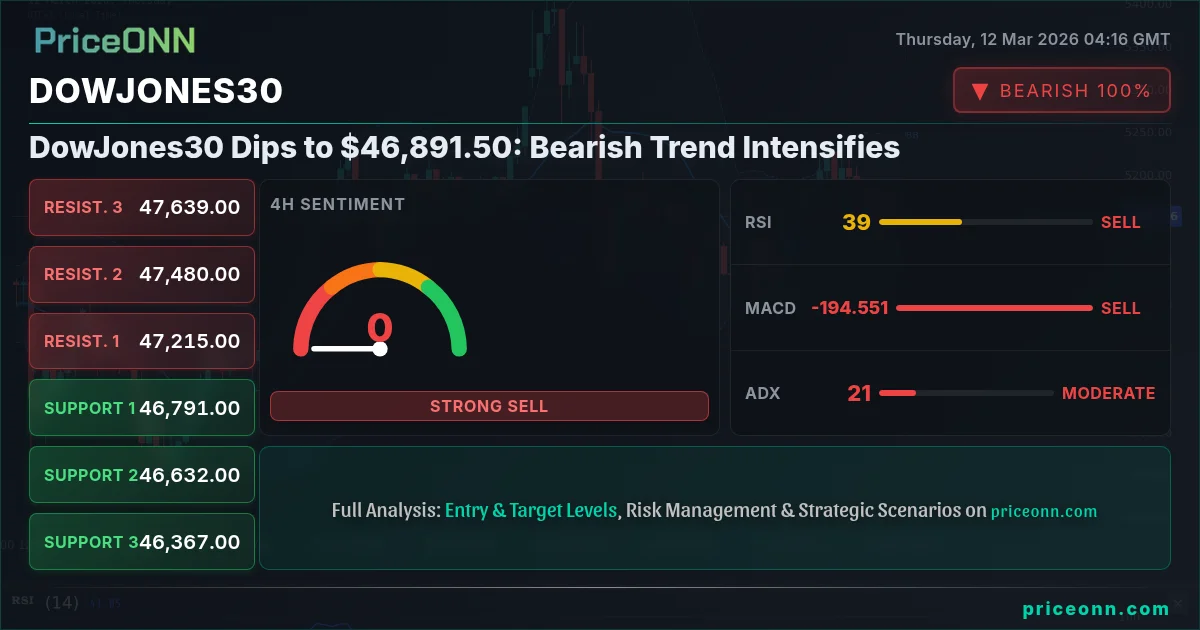
The DowJones30 is facing significant headwinds, currently trading at $46,891.50, as bulls and bears battle for control amidst a backdrop of escalating geopolitical risks and rising oil prices. The index is testing lower levels, prompting a critical examination of its near-term trajectory.
- RSI at 32.12 on the 1H chart suggests oversold conditions, but the overall trend remains bearish.
- Critical support lies at 46,772.67, a break below which could trigger further downside.
- The ADX at 27.37 indicates a strong bearish trend in the short term.
- Geopolitical tensions and rising oil prices are driving DowJones30’s correlation with broader market anxieties.
The Bull Case: Is a Reversal on the Horizon?
Despite the current bearish sentiment, there are arguments to be made for a potential bullish reversal. One key factor is the oversold condition indicated by the RSI on the 1-hour chart, which sits at 32.12. Historically, such oversold levels have preceded short-term bounces as buyers step in to take advantage of lower prices. Additionally, while the ADX indicates a strong downtrend, the Stochastic Oscillator shows the index in overbought territory. This divergence can often signal a potential weakening of the downward momentum.
From a fundamental perspective, a potential easing of geopolitical tensions or a slowdown in the rise of oil prices could provide some relief to the DowJones30. Furthermore, any positive surprises in upcoming economic data, particularly regarding inflation or employment, could boost market sentiment and trigger a rally. It's crucial to monitor the market's reaction to these potential catalysts to gauge the strength of any potential bullish reversal.
The Bear Case: Downward Momentum Continues
On the other hand, the bearish case for the DowJones30 remains compelling. The index is currently trading below its key moving averages, and the MACD histogram indicates negative momentum on multiple timeframes. The 4H chart shows the MACD still well below the signal line, indicating that sellers are not only strong, but actively interested in pressing the issue. The daily chart also shows the index below its 200-day moving average, a significant level that often acts as a key support. A break below this level could open the door for further downside.
Fundamentally, the escalating geopolitical tensions in the Middle East and the surge in oil prices are creating a risk-off environment, which tends to weigh on equity markets. According to recent reports, oil prices are testing the $100 mark, exacerbating inflation fears and fueling concerns about the impact on corporate earnings. The DXY is currently at 99.23, further pressuring the index. Moreover, the upcoming economic data releases, including GBP data on Friday, could further exacerbate the bearish sentiment if they disappoint expectations.
Technicals as a Tiebreaker: Analyzing Key Levels and Indicators
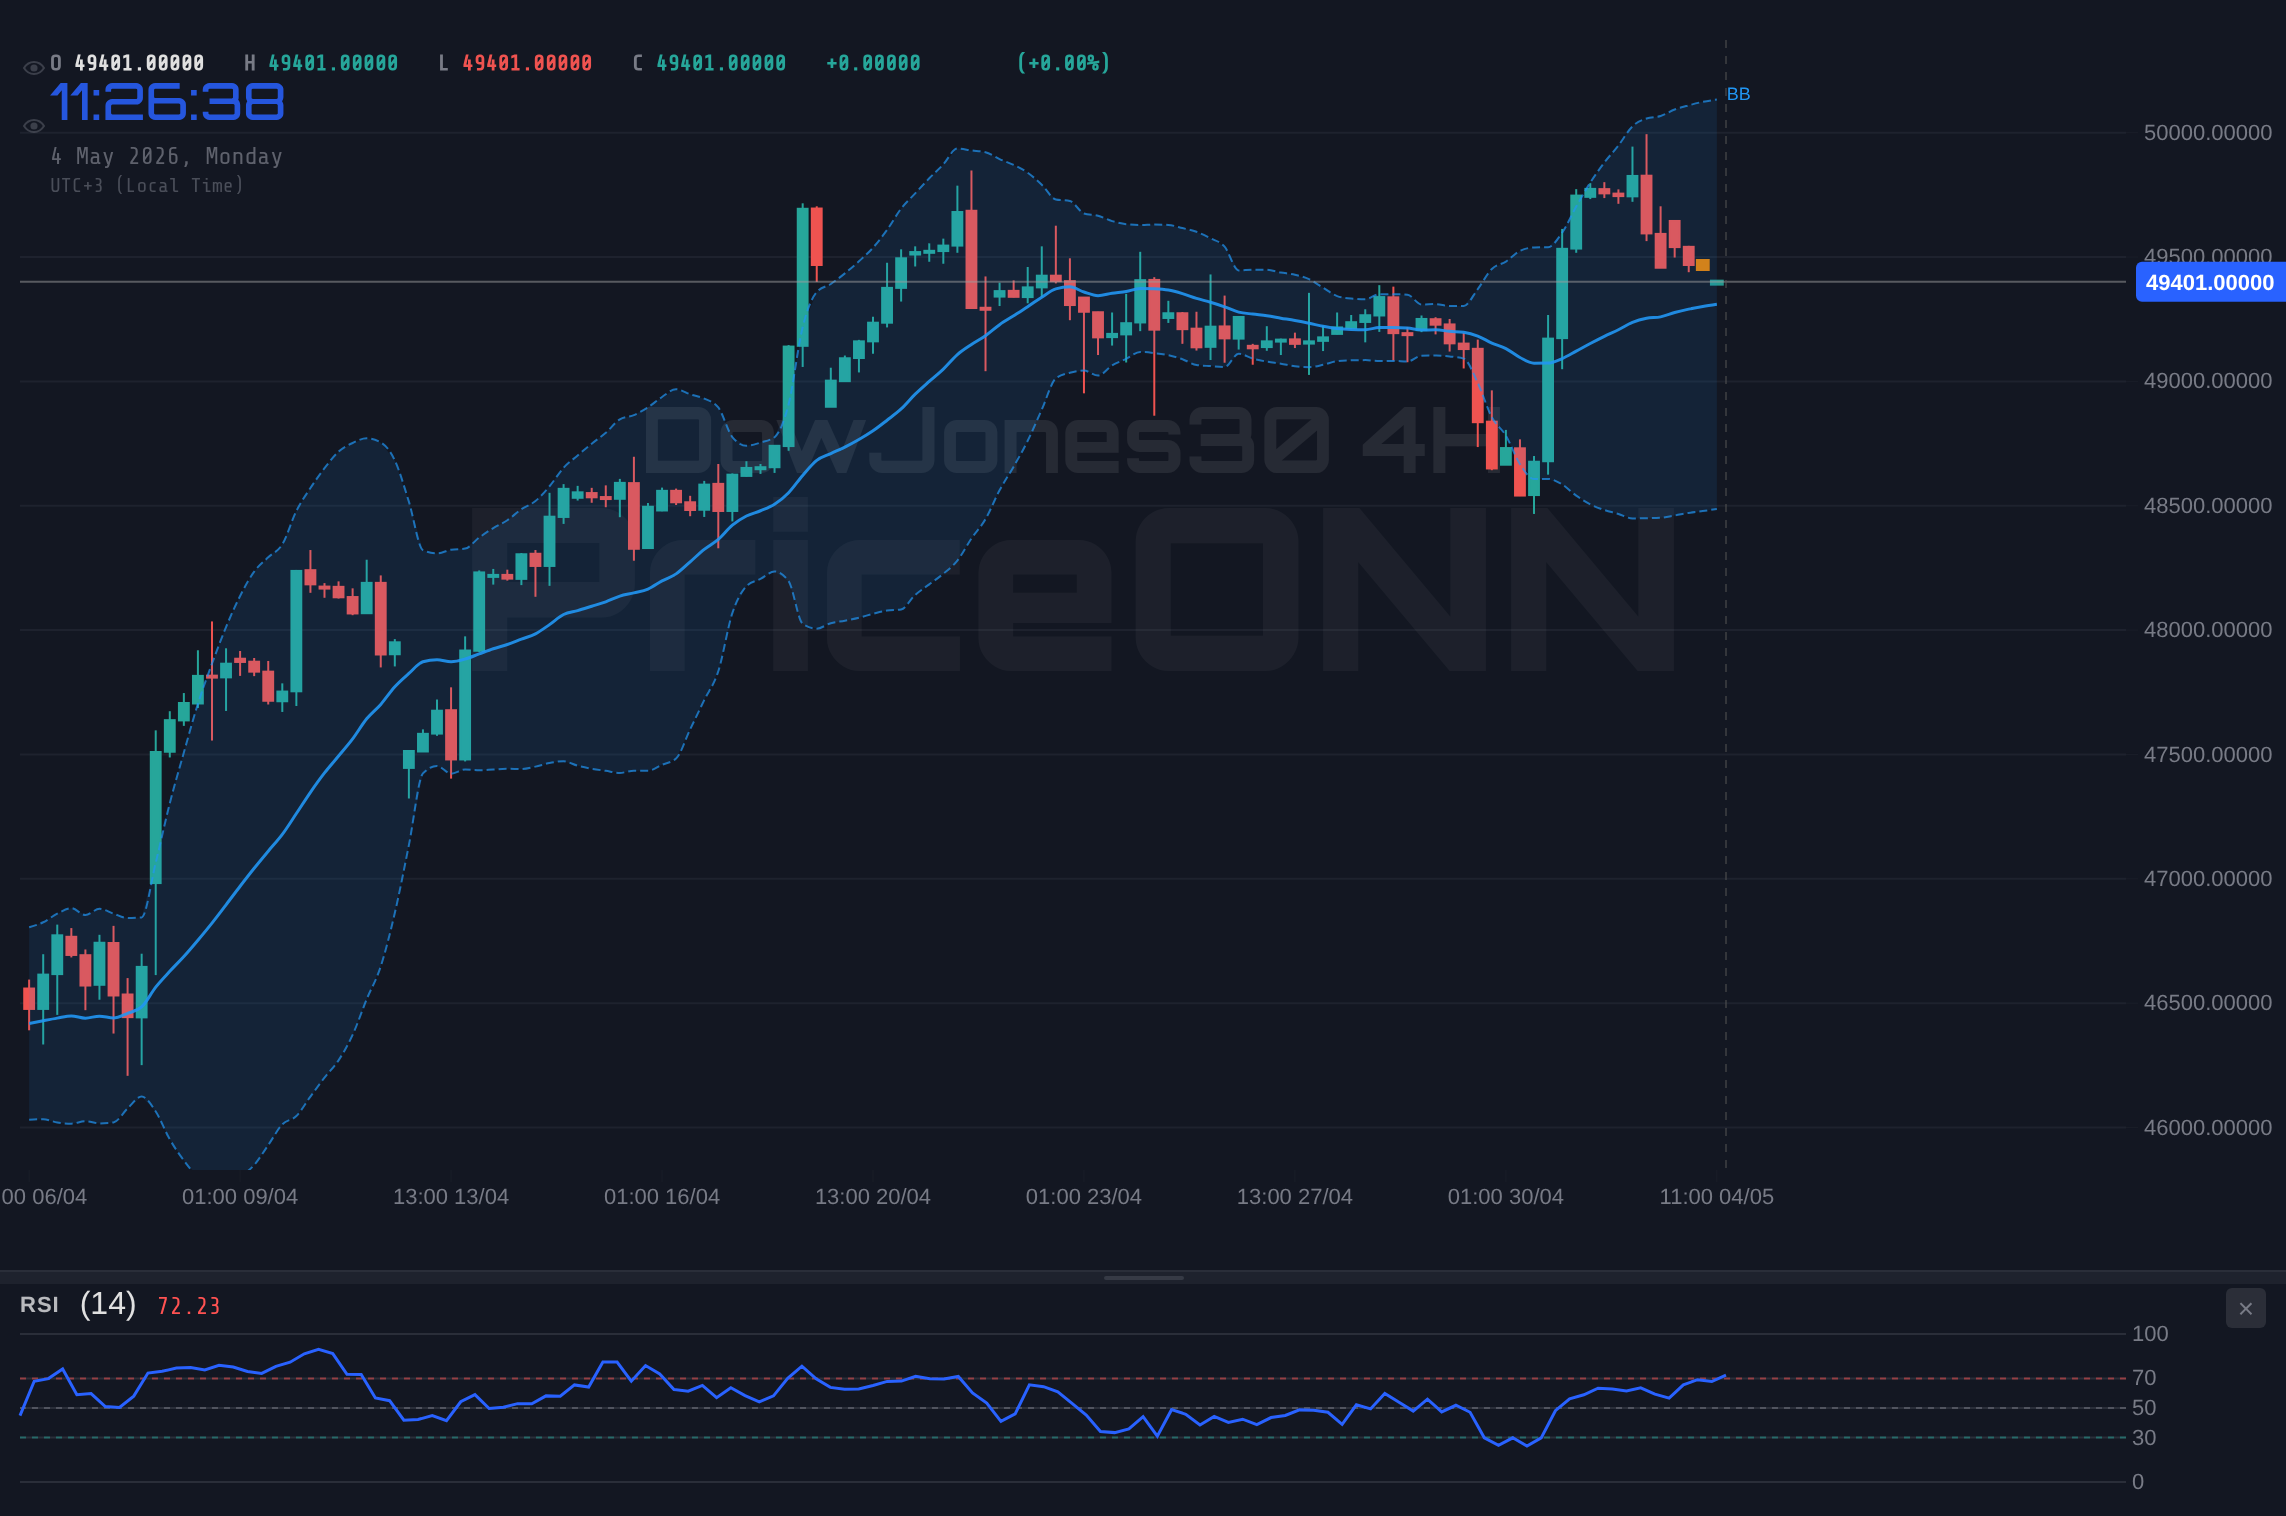
The 1-hour chart for the DowJones30 paints a bearish picture. The price is trading below the middle band of the Bollinger Bands, and the RSI, while oversold, has not yet shown any signs of a sustained reversal. Key support levels to watch include 46,772.67, followed by 46,697.33 and 46,596.67. A break below 46,772.67 could trigger a further sell-off towards the lower support levels.
On the 4-hour timeframe, the technical indicators also favor the bears. The RSI is at 38.55, indicating that there is still room for further downside before the index reaches oversold territory. The MACD histogram is negative, confirming the bearish momentum. Resistance levels to watch include 46,948.67, followed by 47,049.33 and 47,124.67. A failure to break above 46,948.67 could reinforce the bearish bias.
The daily chart provides a longer-term perspective. While the RSI is approaching oversold territory at 29.93, the overall trend remains bearish. The MACD histogram is negative, and the price is trading below its 200-day moving average. Key support levels to watch include 47,030, followed by 46,722 and 46,272. Resistance levels to watch include 47,788, followed by 48,238 and 48,546.
The Verdict: Bears Maintain Control
Considering the technical and fundamental factors, the bears appear to be in control of the DowJones30 at the moment. The escalating geopolitical tensions, rising oil prices, and negative economic data are creating a risk-off environment that is weighing on equity markets. The technical indicators also favor the bears, with negative momentum and the price trading below key moving averages. The ADX on the 1D timeframe is at 32.59, confirming the strength of the downward trend. While oversold conditions on shorter timeframes could lead to temporary bounces, the overall outlook remains bearish.
For traders, it's crucial to monitor the key support levels mentioned above. A break below 46,772.67 could trigger a further sell-off towards the lower support levels. On the upside, a sustained break above 46,948.67 would be needed to negate the bearish bias. Until then, caution is warranted, and traders should prioritize risk management and wait for clear confirmation signals before entering any new positions. The DowJones30 today analysis shows that the index will be subject to high volatility in the coming days. Those prepared to take advantage of this will be rewarded.
Frequently Asked Questions: DowJones30 Analysis
What happens if DowJones30 breaks below $46,772.67 support?
If DowJones30 breaks below the $46,772.67 support level, it could trigger a further sell-off towards the next support levels at $46,697.33 and $46,596.67. This breakdown would confirm the bearish momentum and increase the likelihood of further downside.
Should I buy DowJones30 at current levels of $46,891.50 given the RSI at 32.12?
While the RSI at 32.12 indicates oversold conditions, it's important to consider the overall bearish trend. A buy position at current levels would be risky without further confirmation of a reversal. It's advisable to wait for a sustained break above $46,948.67 before considering a long entry.
Is the negative MACD histogram a strong sell signal for DowJones30?
The negative MACD histogram confirms the bearish momentum, but it's not a standalone sell signal. It should be used in conjunction with other technical indicators and fundamental analysis to make informed trading decisions. The MACD's position below its signal line is a further indication of selling pressure.
How will the upcoming GBP data on Friday affect DowJones30 this week?
The upcoming GBP data on Friday could indirectly affect DowJones30 by influencing global market sentiment. Stronger-than-expected data could boost risk appetite and provide some relief to the index, while weaker-than-expected data could exacerbate the bearish sentiment and trigger further downside.
Track markets in real-time
AI-powered analysis, technical indicators and real-time price data.
Join Our Telegram Channel
Breaking market news, AI analysis and trading signals instantly.
Join Channel