纳斯达克100指数跌破23455美元:美元强势下,空头测试关键支撑
纳斯达克100指数在23455.54美元处面临抛压,美元指数(DXY)飙升及避险情绪拖累科技股。空头关注23300美元支撑。
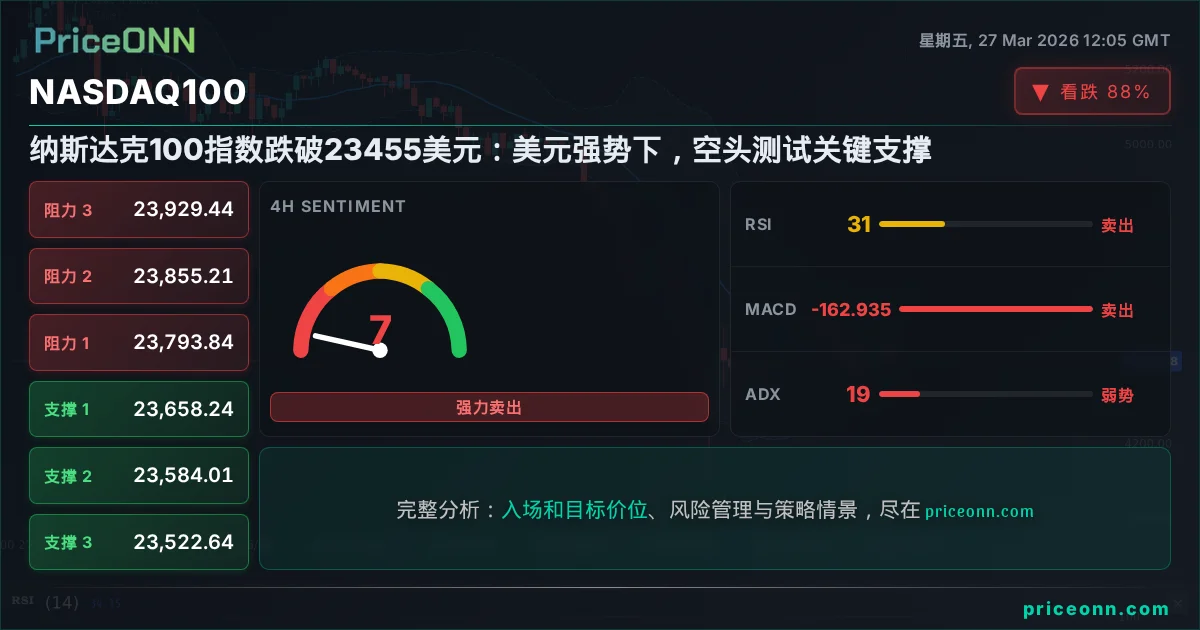
纳斯达克100指数目前交投于23455.54美元,该价位正受到空头试图控制的显著关注,此前出现了一系列看跌的技术信号和美元指数(DXY)的走强。今天的分析深入探讨了复杂的技术图景,分析了关键指标读数及其对交易者密切关注的关键支撑位的影响。随着美元指数逼近99.90关口,纳斯达克100等风险资产的压力显而易见,引发了对其当前趋势可持续性以及进一步下跌潜力的疑问。纳斯达克100分析今天的走势正处于关键时刻。
⚡ 关键要点
技术上的走钢丝:驾驭纳斯达克100指数的当前困境
日线图动态:变化的格局
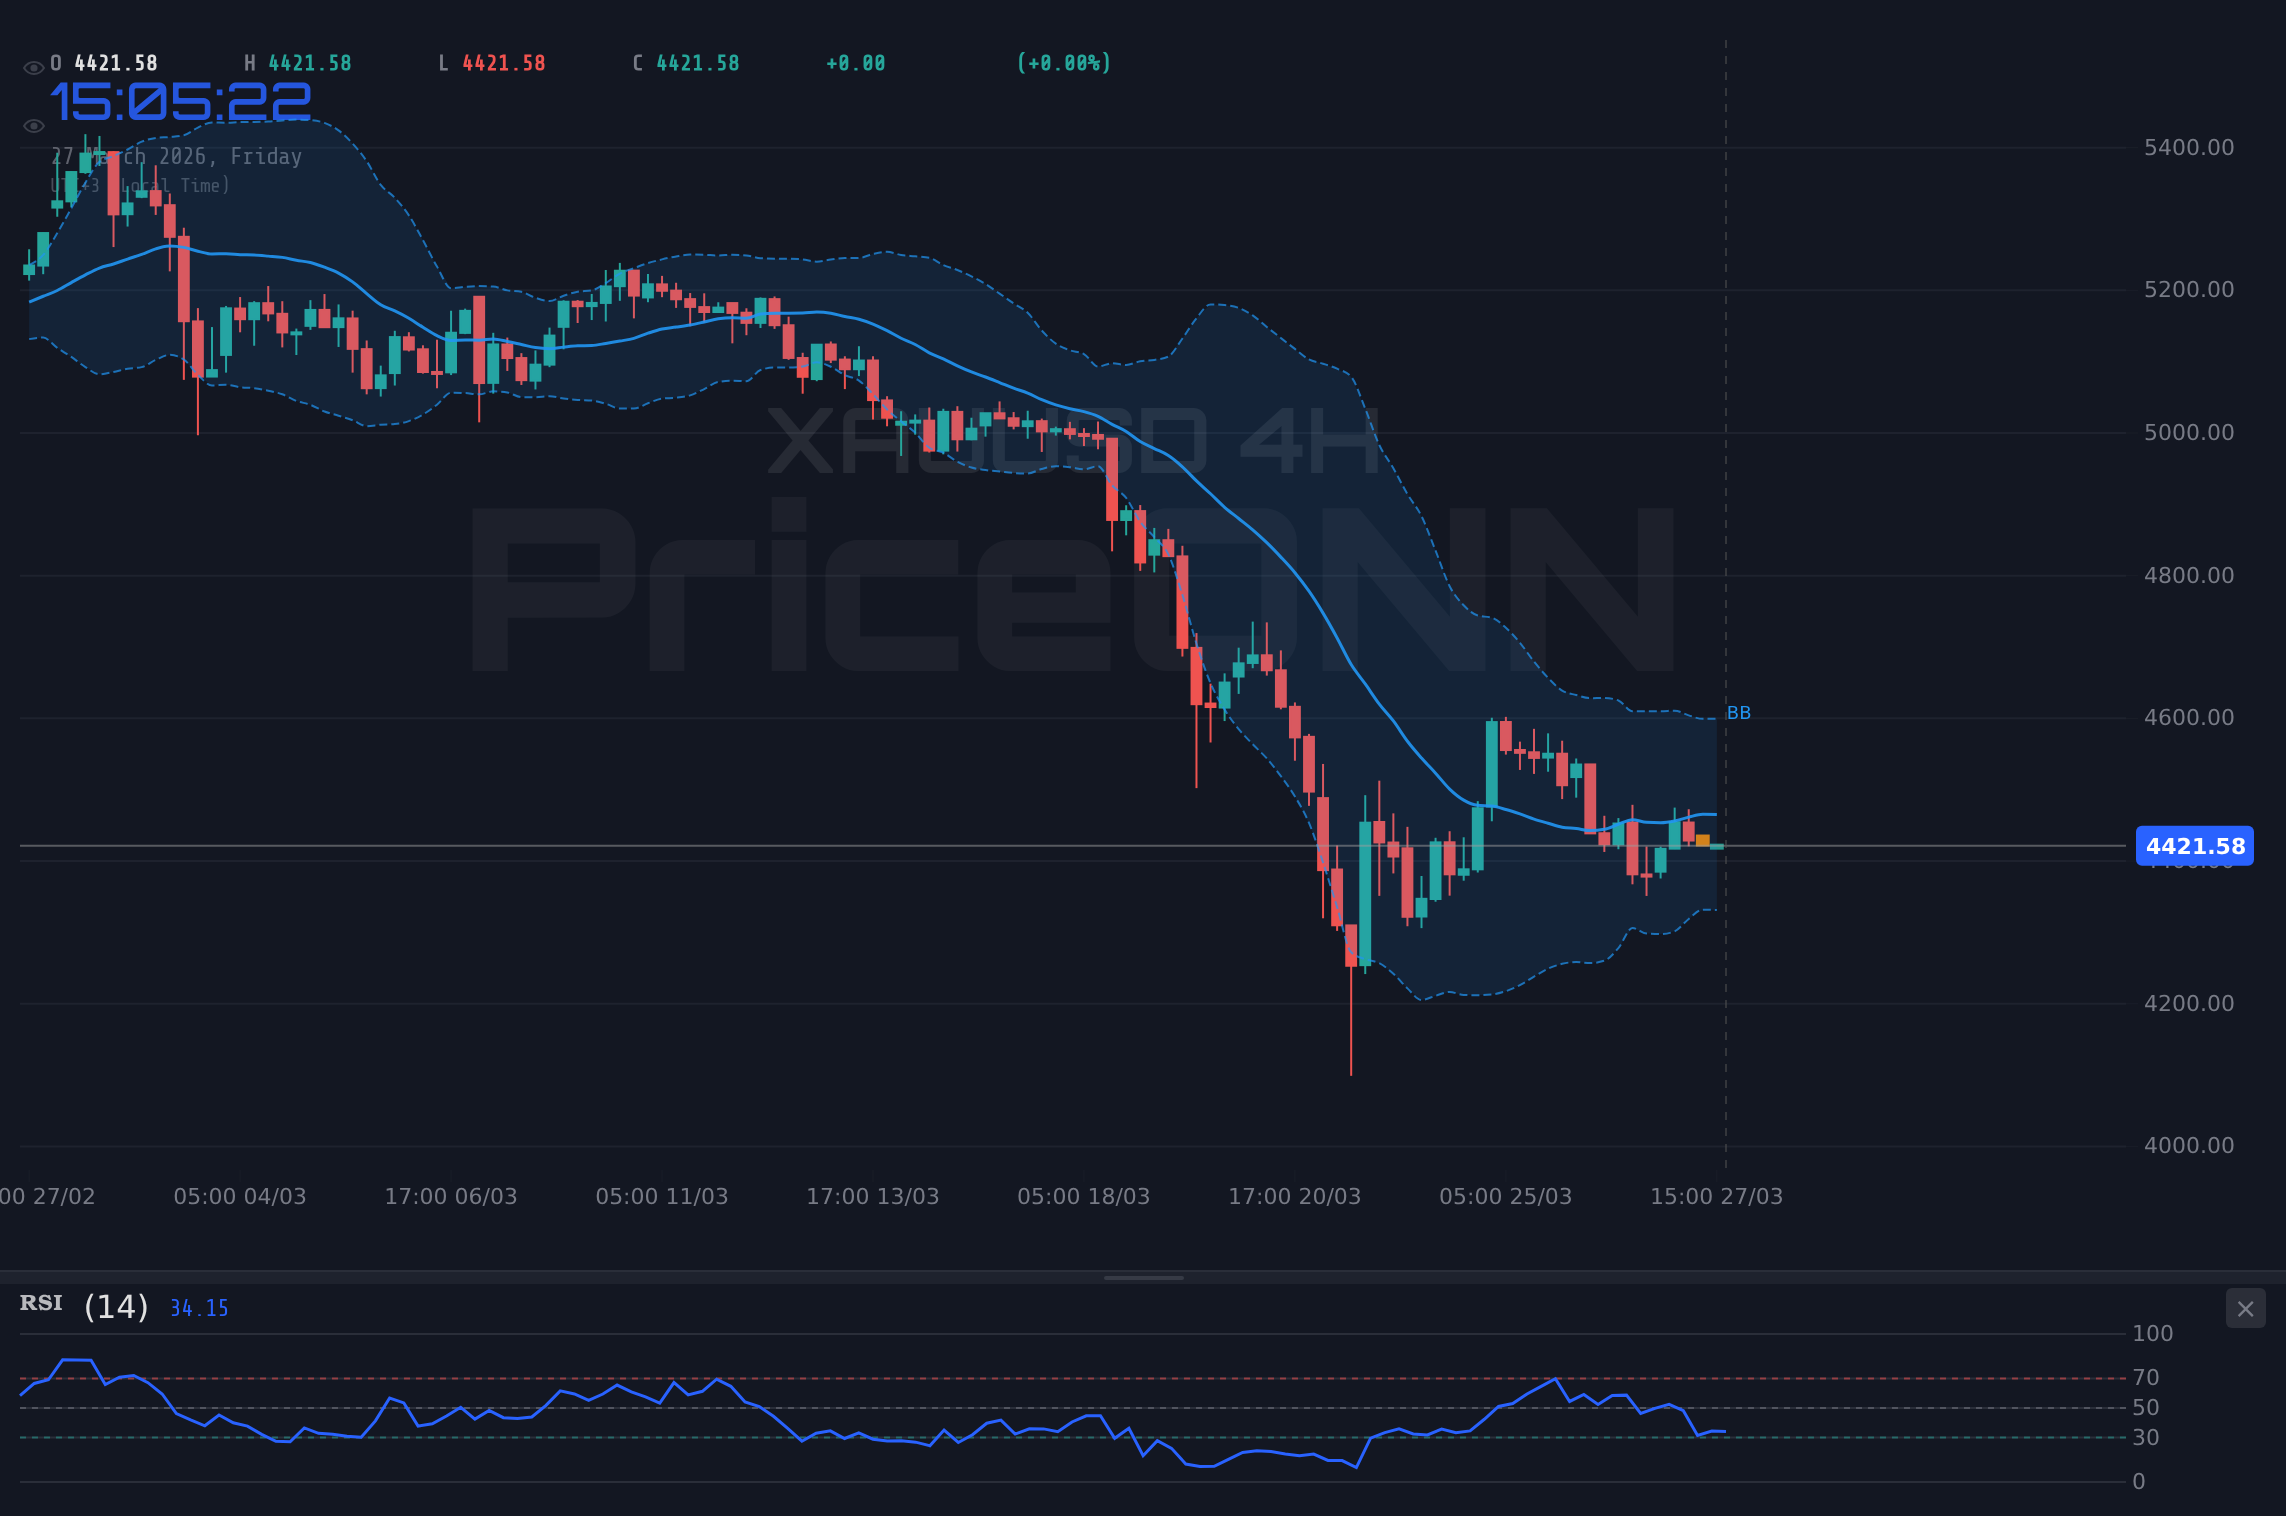
The daily chart presents a concerning picture for the Nasdaq 100, currently priced at $23,455.54. The index has been in a downtrend for some time, with the ADX at a robust 47.25 indicating a strong bearish trend is firmly in place. This is not a fleeting moment of weakness; it’s a sustained downward move that demands attention. The Relative Strength Index (RSI) stands at 30.56, hovering just above oversold territory. While this might tempt some to look for buying opportunities, the MACD histogram, deeply in negative territory, suggests that selling momentum is still strong and has not yet shown signs of reversal. The Bollinger Bands are also widening and positioned below the middle band, a classic sign of increasing bearish pressure. This confluence of indicators on the daily timeframe paints a picture of a market under significant strain, where any rallies are likely to be met with selling pressure as traders position for further declines.盘中疲软:1小时和4小时视角
Examining the shorter timeframes, the 1-hour chart reveals a steep downtrend, reinforced by an ADX of 27.52. The RSI at 27.23 here is deeply oversold, suggesting a potential for a short-term bounce. However, the MACD is firmly negative, and the Stochastic oscillator (%K at 8.47, %D at 30.39) is giving a strong sell signal, indicating that downward momentum is still dominant. The Bollinger Bands are hugging the lower band, a signal of extreme bearishness in the short term. On the 4-hour chart, the picture is similarly bearish, with an ADX of 18.66 indicating a weak trend, but this is often a precursor to a more significant move. The RSI is at 31.36, also in oversold territory, but the MACD remains negative. The Stochastic is showing extreme oversold conditions with %K at 13.37 and %D at 14.23, suggesting a potential reversal is brewing. However, without clear bullish confirmation, these oversold readings are often traps, leading to further price erosion. The key takeaway from these shorter timeframes is that while oversold conditions are present, the underlying bearish momentum, particularly evident on the daily chart, remains the dominant force.美元的主导地位:受审视的相关性
The US Dollar Index (DXY) is currently trading at 99.91, showing a strong upward trend on the daily chart with an ADX of 31.98. This strengthening dollar is a significant headwind for risk assets like the Nasdaq 100. Historically, a rising dollar often correlates with falling equity markets, especially for growth-oriented sectors that dominate the Nasdaq 100. Investors tend to seek refuge in the perceived safety of the dollar during periods of global uncertainty, which is precisely what we are seeing now. The DXY’s ascent puts pressure on foreign capital to convert to dollars, thereby reducing liquidity in other markets and increasing the cost of dollar-denominated assets for non-US investors. This correlation is not merely theoretical; it's a powerful driver of market sentiment and price action. As the DXY approaches the psychologically significant 100 level, the pressure on the Nasdaq 100 is likely to intensify, making it difficult for the index to find sustained upward momentum.地缘政治暗流与市场情绪
Recent geopolitical tensions, as reported by sources like Reuters and Bloomberg, are contributing to a broader risk-aversion sentiment across global markets. Escalating conflicts and concerns over energy security, coupled with persistent inflation fears, are driving investors towards safe-haven assets. This 'risk-off' environment directly impacts growth stocks, which are more sensitive to changes in economic outlook and interest rate expectations. The Federal Reserve's recent commentary, suggesting a renewed focus on inflation risks, adds another layer of uncertainty. If the Fed signals a more hawkish stance, it could lead to higher interest rates for longer, further pressuring valuations of growth stocks. This complex interplay of geopolitical risks, inflation concerns, and central bank policy expectations is creating a challenging environment for the Nasdaq 100, making it susceptible to sharp declines whenever negative news emerges.驾驭支撑结构:空头可能暂停之处
1小时图的即时测试
On the 1-hour chart, the immediate support level for the Nasdaq 100 is at $23,405.37. This is a critical juncture. A break below this level would signal further immediate weakness, potentially leading to a test of the subsequent support at $23,302.67. The strength of the trend on this timeframe, indicated by the ADX at 27.52, suggests that a break here could be swift. However, the extremely oversold RSI (27.23) and Stochastic readings might offer a temporary reprieve, leading to a short-lived bounce before the downtrend resumes. This level is crucial for intraday traders to monitor, as a decisive break could trigger stop-loss orders and accelerate downside momentum.4小时图的关键防线
The 4-hour chart presents a more significant battleground, with the first key support level at $23,302.67. This level has been tested and held previously, making it a psychologically important barrier. Below this, we find further support at $23,273.23, and then a more substantial level at $23,150.20. The ADX at 18.66 on this timeframe suggests a weaker trend, but this can be deceptive in ranging markets or before a significant breakout. The RSI at 31.36 is still in oversold territory, and the Stochastic is showing extreme oversold readings, hinting at a potential reversal. However, the negative MACD momentum cannot be ignored. A sustained close below $23,302.67 on the 4-hour chart would invalidate any near-term bullish hopes and open the door for a deeper correction.日线支撑:长期视角
Looking at the daily chart, the primary support level is $23,150.20. This is a significant level that, if broken convincingly, would signal a much broader bearish trend continuation. Further down, we have support at $22,736.12, and a more distant, critical level at $21,911.37. The daily ADX of 47.25 underscores the strength of the current bearish trend. While the daily RSI is approaching oversold territory, the overall trend strength suggests that this might not be enough to halt the decline. Any bounce from these daily support levels will need to overcome significant resistance, particularly the psychological 23,500-23,600 area, before any sustained recovery can be considered.市场情绪与指标汇聚
The current market sentiment is heavily influenced by the interplay of technical signals and macroeconomic factors. On the 1-hour chart, the RSI at 27.23 and Stochastic readings suggest extreme oversold conditions, potentially signaling a short-term buying opportunity. However, this is directly contradicted by the MACD histogram, which remains deeply negative, indicating that selling momentum is still dominant. This divergence between oscillators and momentum indicators highlights the choppiness and uncertainty in the market. The ADX at 27.52 confirms a strong trend, but without a clear direction, it simply means the market is moving with conviction in its current, albeit potentially temporary, direction. On the 4-hour timeframe, the RSI (31.36) and Stochastic (13.37/%K, 14.23/%D) also point to oversold conditions, but again, the MACD momentum is negative. The ADX at 18.66 suggests a weaker trend, which could mean the market is consolidating before a larger move, or that the current downtrend lacks conviction. The daily chart presents a similar dilemma: RSI (30.56) is oversold, but the MACD is negative, and the ADX at 47.25 indicates a powerful bearish trend. This conflict between oversold oscillators and persistent negative momentum/trend strength means that traders should exercise extreme caution. A bounce from oversold levels is possible, but the underlying bearish trend suggests any such bounce may be a short-lived opportunity for sellers to re-enter the market at better prices.油价与通胀预期的作用
Brent crude oil is trading at $107.97, having seen a significant surge of 4.19%. This rise in oil prices is a double-edged sword for the Nasdaq 100. On one hand, higher energy prices can fuel inflation expectations, potentially leading to more hawkish central bank policies, which is negative for growth stocks. On the other hand, rising oil prices can also signal robust global demand, which could be seen as a positive for the broader economy. However, in the current risk-off environment, the inflationary impact is likely to dominate market sentiment. Persistent high oil prices increase the cost of doing business for many companies and can erode consumer purchasing power, both of which are detrimental to tech stocks. Therefore, the continued strength in oil prices, while indicating demand, is more likely to be interpreted as an inflationary risk, further pressuring the Nasdaq 100.美元日元与英镑美元相关性:两种货币的故事
The USD/JPY pair is trading at 159.847, showing a clear upward trend with a strong daily ADX of 22.41. This reflects the divergence in monetary policy between the US and Japan, with the Fed perceived as more hawkish than the Bank of Japan. This strength in USD/JPY reinforces the strength of the US dollar. Conversely, GBP/USD is trading at 1.32815, showing a bearish trend with a daily ADX of 29.72. The pound is weakening against the dollar, partly due to domestic economic concerns and perhaps a less hawkish stance from the Bank of England compared to the Fed. The weakness in GBP/USD further corroborates the strength of the DXY. These currency pair movements highlight the global demand for dollars and the relative weakness in other major currencies, collectively reinforcing the headwinds faced by the Nasdaq 100. The strength of USD/JPY, in particular, indicates a potential for carry trades and capital flows away from riskier assets and towards dollar-denominated assets or those yielding higher interest rates.情景规划:绘制未来潜在路径
看跌情景:跌势持续
65% 概率触发条件: 4小时图上纳斯达克100指数收盘低于23302.67美元。
无效化: 在成交量增加的情况下,决定性收盘价高于23600美元。
目标1: 23150.20美元(日线支撑)
目标2: 22736.12美元(进一步日线支撑)
中性情景:围绕关键水平的盘整
25% 概率触发条件: 未来48小时内价格走势保持在23300美元至23600美元之间波动。
无效化: 明显突破23800美元或跌破23150美元。
目标1: 23600美元(上轨边界)
目标2: 23300美元(下轨边界)
看涨情景:技术性反弹
10% 概率触发条件: 1小时图上收盘价持续高于23600美元,并得到成交量上升的确认。
无效化: 价格跌回23400美元以下且未能守住。
目标1: 23793.84美元(4小时阻力)
目标2: 24000美元(心理关口)
前路展望:关注要点
The Nasdaq 100 is currently at a critical juncture, trading at $23,455.54. The technical indicators across multiple timeframes present a mixed but predominantly bearish picture. While oversold conditions on shorter timeframes might suggest a temporary bounce, the strong bearish trend on the daily chart, coupled with a strengthening dollar and broader risk-off sentiment, points towards further downside potential. The key support levels to watch are $23,405.37 on the 1-hour chart and $23,302.67 on the 4-hour chart. A decisive break below these levels would likely trigger a cascade of selling, targeting the daily support at $23,150.20. Traders should remain cautious, paying close attention to the DXY's trajectory and any shifts in Federal Reserve rhetoric. The current environment favors a defensive stance, with opportunities likely arising from short-term bounces or a clear break of key support levels.常见问题解答:纳斯达克100指数分析
如果纳斯达克100指数跌破23302.67美元的支撑位会怎样?
在4小时图上跌破23302.67美元的支撑位将使中性情景失效,并可能引发看跌的连锁反应。这将为触及23150.20美元,甚至可能触及22736.12美元的目标打开通道,因为强劲的日线下降趋势将重新确立。
当前水平下,30.56的RSI是纳斯达克100指数的买入信号吗?
虽然日线图上30.56的RSI显示超卖,但这并非独立的买入信号,尤其是在MACD动量为负且ADX强劲(47.25)的情况下。需要确认的看涨反转形态或关键阻力位的突破才能发出可靠的买入信号。
99.91的美元指数如何影响纳斯达克100指数的趋势分析?
美元指数在99.91的强势正在给纳斯达克100指数带来显著的阻力。这种负相关性表明,随着美元因避险情绪和潜在的美联储鹰派言论而走强,资金将从科技股等风险资产流出,从而强化了纳斯达克100指数的看跌趋势分析。
即将公布的经济数据将如何影响本周纳斯达克100指数的走势?
即将公布的经济数据,特别是任何暗示通胀粘性或美联储更鹰派立场的指标,可能会加剧纳斯达克100指数当前的看跌情绪。反之,疲软的数据可能会提供暂时的喘息机会,但强劲的看跌趋势需要重大的催化剂才能逆转。
📊 指标仪表盘
| 指标 | 数值 | 信号 | 解读 |
|---|---|---|---|
| RSI (14) | 30.56 | 超卖 | 可能反弹,但趋势强度是关键。 |
| MACD柱状图 | -163.05 | 负值 | 强劲的抛售动能持续。 |
| Stochastic %K | 23.96 | 超卖 | 极端读数,关注背离。 |
| ADX | 47.25 | 强趋势 | 看跌趋势已牢固确立。 |
| 布林带 | 价格低于中轨 | 看跌 | 表明抛售压力增加。 |
▲ 支撑
S1$23,405.37
S2$23,302.67
S3$23,150.20
▼ 阻力
R1$23,600.00
R2$23,793.84
R3$24,000.00
免责声明:本内容仅供参考和教育目的,不构成投资建议、财务推荐或买卖任何金融工具的要约。过去的表现不保证未来的结果。在做出投资决策前,请进行自己的研究并咨询持牌财务顾问。
本分析由PriceONN的0.12毫秒数据引擎和实时市场数据驱动,经10种语言分析师见解和AI情绪数据交叉验证。