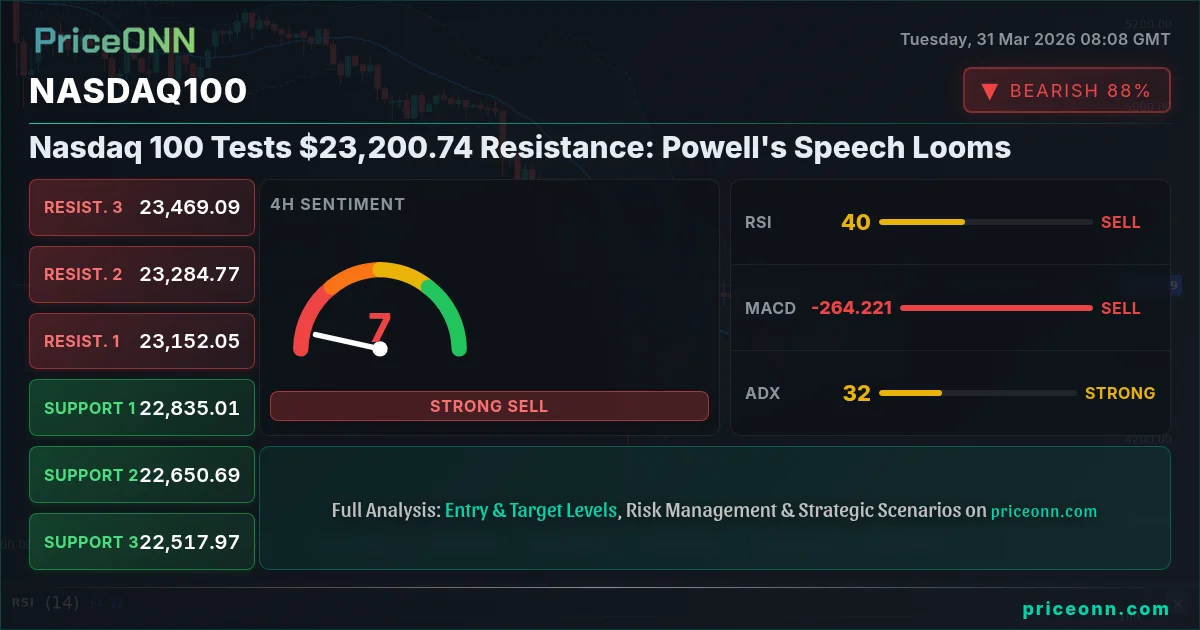
Nasdaq 100 Tests $23,200.74 Resistance: Powell's Speech Looms
Nasdaq 100 hovers near $23,200.74 resistance as traders await Powell's speech. Key levels and indicator signals suggest a critical juncture for the tech-heavy index.
The Nasdaq 100 is standing at a pivotal juncture, hovering around the $23,200.74 mark as market participants brace for Federal Reserve Chair Jerome Powell's upcoming speech. This confluence of a key technical resistance level and central bank commentary creates a tense atmosphere, with bulls and bears locked in a fierce debate over the index's immediate future. The question on everyone's mind is whether the current upward momentum can overcome the psychological and technical barrier, or if Powell's words will trigger a much-anticipated correction. This analysis delves into the intricate technical signals and broader market context to dissect the forces at play and outline potential scenarios.
- The Nasdaq 100 is testing resistance at $23,200.74, with RSI at 54.88 indicating neutral momentum but an upward lean on the 1-hour chart.
- Critical support for the Nasdaq 100 is identified at $23,083.11 (1H), $22,835.01 (4H), and $22,716.56 (1D), providing potential downside buffers.
- The MACD histogram on the 1-hour chart shows positive momentum, suggesting short-term buying interest, while the 4-hour and daily charts indicate bearish divergence.
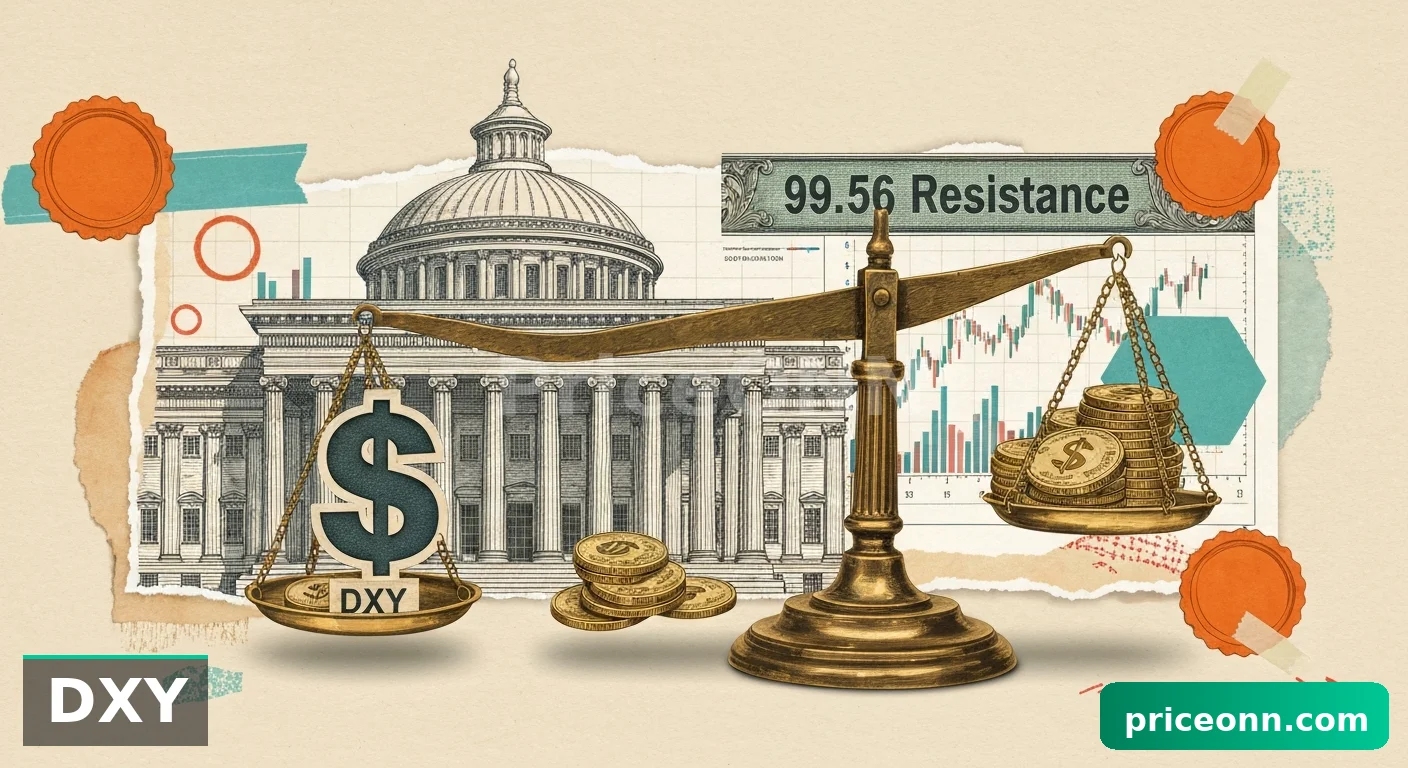
- Correlation analysis shows the DXY at 100.26, a level that typically exerts pressure on growth assets like the Nasdaq 100, adding complexity to the bullish case.
- Traders are closely watching Powell's speech for clues on future monetary policy, which could significantly impact risk appetite and tech valuations.
The Battle for $23,200: Bulls Eyeing Breakout
The bulls are certainly trying to keep the momentum alive, pushing the Nasdaq 100 towards the significant $23,200.74 resistance level. On the 1-hour chart, the technical picture offers some support for this optimistic outlook. The RSI(14) is sitting at 54.88, which, while neutral, shows a clear upward inclination, suggesting that buying pressure is present and potentially building. Furthermore, the MACD is displaying positive momentum, with the MACD line trading above its signal line. This indicates that short-term moving averages are outperforming longer-term ones, a classic sign of immediate upward strength. The Stochastic Oscillator, with %K at 56.06 and %D at 65.76, is showing a slight bearish signal (%K < %D), but it's in a relatively neutral zone and could easily flip with a decisive move. The ADX at 14.74, however, points to a weak trend, suggesting that any breakout might lack strong conviction unless confirmed by increased volume. Despite this, the overall signal for the 1-hour timeframe leans towards 'AL' (Buy), with 5 out of 8 indicators suggesting upside potential. This short-term strength is what the bulls are clinging to, hoping to break through the ceiling and establish new highs.
The broader market context also offers some glimmers of hope for the bulls, albeit with significant caveats. The S&P 500 is showing a daily gain of 1.14%, trading at 6411.65, and the Dow Jones Industrial Average is up 1.14% at 45716. This general risk-on sentiment in the equity markets can provide a tailwind for the Nasdaq 100. However, the rising Dollar Index (DXY), currently at 100.26, presents a significant headwind. Historically, a stronger dollar tends to put pressure on growth-oriented assets like tech stocks, as it can signal tighter financial conditions or a 'risk-off' sentiment globally. The fact that the Nasdaq 100 is showing some resilience despite the DXY's upward move at 100.26 is a testament to the underlying strength in the tech sector, but it also highlights the delicate balance the market is navigating. The bulls need to see this $23,200.74 resistance level decisively broken, ideally with increasing volume, to confirm their view.
The Bear Case: Cautionary Signals and Powell's Shadow
Despite the short-term bullish signals on the 1-hour chart, the medium and long-term technical indicators paint a more cautious, if not outright bearish, picture for the Nasdaq 100. The 4-hour timeframe presents a mixed bag, but with significant bearish undertones. While the general signal leans towards 'AL' (Buy) with 7 out of 8 indicators, the underlying readings are concerning. The RSI(14) at 40.57 on the 4-hour chart is firmly in neutral territory but shows a clear downward trend, suggesting that upward momentum is waning. More importantly, the MACD on both the 4-hour and daily charts is showing negative momentum, with the MACD line below its signal line. This indicates that recent downward price action is gaining traction on longer timeframes, and the short-term bullishness might be a mere retracement within a larger downtrend. The Stochastic Oscillator on the 4-hour chart (%K=39.50, %D=31.25) shows a bullish crossover, but this is happening from oversold levels and doesn't negate the broader bearish momentum.
The daily chart for the Nasdaq 100 is where the bears find their strongest arguments. The index is currently trading below its 1-day middle Bollinger Band, indicating a downward bias. The RSI(14) at 33.1 is deep in neutral territory and trending downwards, signaling a lack of buying conviction and potential for further downside. The MACD is unequivocally bearish, with negative momentum and the MACD line significantly below its signal line. This suggests that the prevailing trend on the daily timeframe is down. The ADX value of 49.33 on the daily chart is particularly alarming; it signifies a very strong downtrend, indicating that any short-term rallies are likely to be met with significant selling pressure. The general signal for the daily timeframe is a clear 'SAT' (Sell), with 7 out of 7 indicators pointing downwards. This strong daily bearish setup suggests that the current testing of resistance at $23,200.74 could be an opportunity for bears to re-enter the market, anticipating a move towards the key daily support levels.
The looming presence of Federal Reserve Chair Jerome Powell's speech adds a significant layer of uncertainty and plays into the bears' hands. Markets are highly sensitive to any hints about future monetary policy, especially concerning interest rates and inflation. If Powell strikes a hawkish tone, perhaps emphasizing the need for continued vigilance against inflation or signaling a slower pace of rate cuts, it could dampen risk appetite considerably. This would likely lead to a sell-off in growth-sensitive assets like the Nasdaq 100, especially given the already strong bearish signals on the daily chart. The correlation with the DXY at 100.26, which is in a strong uptrend (ADX 33.32), further supports the idea that tighter financial conditions could be on the horizon, making the current resistance level a challenging one for the bulls to overcome. The bears are betting that Powell's words will confirm their technical outlook and trigger a move lower.
Key Levels and Technical Confluence
To navigate this complex market environment, understanding the key support and resistance levels is paramount. For the Nasdaq 100, the immediate resistance is clearly defined around the current price of $23,200.74. A decisive break and hold above this level would be necessary to invalidate the bearish outlook and potentially signal a continuation of the uptrend. Immediate resistance points are observed at $23,135.90 (1H), $23,162.51 (1H), and $23,188.69 (1H). A sustained move above these could pave the way for a test of higher levels, but the daily resistance at $23,251.25, $23,580.86, and $23,785.94 looms large.
On the downside, support levels are crucial for the bears to watch. On the 1-hour chart, immediate support is found at $23,083.11, followed by $23,056.93 and $23,030.32. A break below these levels would confirm the short-term bearish bias. However, the more significant support zones lie on the 4-hour and daily charts. The 4-hour support levels are at $22,835.01, $22,650.69, and $22,517.97. These are critical areas where a bounce could occur if selling pressure intensifies. The daily support levels at $22,716.56, $22,511.48, and $22,181.87 represent the ultimate downside targets if the bearish trend fully takes hold. The confluence of strong daily bearish indicators and the proximity to these support zones makes the current resistance test a high-stakes event.
The interplay between these levels and the technical indicators creates a fascinating battleground. For instance, the ADX readings offer a stark contrast: a weak 14.74 on the 1-hour chart suggesting a lack of trend conviction, versus a very strong 49.33 on the daily chart indicating a firmly established downtrend. This divergence highlights the current uncertainty and the potential for a sharp move once a clear direction emerges. The Stochastic Oscillator on the daily chart, with %K at 9.86 and %D at 22.39, is deeply oversold, which historically can precede a bounce. However, with the MACD and RSI also trending downwards, this oversold condition might persist or lead to a weak bounce rather than a reversal. Bulls need to see a sustained break above $23,200.74 with confirmation from higher timeframes and increased volume, while bears are looking for any sign of weakness at this resistance, especially following Powell's remarks, to trigger a move towards the lower support levels.
Navigating the Uncertainty: Scenarios and Strategies
Given the conflicting signals and the looming event risk from Powell's speech, a clear path forward is far from certain. Market participants must consider multiple scenarios. The first is a **Bullish Scenario**, where the Nasdaq 100 successfully breaks through the $23,200.74 resistance. This would likely be fueled by dovish undertones from Powell, suggesting a faster-than-expected pivot on interest rates, or by exceptionally strong positive market sentiment. In this case, the index could target the 4-hour resistance at $23,284.77, and potentially push towards the daily resistance at $23,580.86. The trigger for this scenario would be a decisive close above $23,200.74, with invalidation occurring if the price falls back below $23,083.11.
Conversely, a **Bearish Scenario** becomes more probable if Powell adopts a hawkish stance or if the technical resistance at $23,200.74 holds firm. This would likely lead to a sell-off, with the index testing the 1-hour support at $23,083.11 and potentially falling towards the 4-hour support at $22,835.01. Further downside could see it reach the daily support at $22,716.56. The trigger for this scenario would be a failure to break above $23,200.74, followed by a close below $23,083.11. The invalidation of this bearish thesis would occur if the price manages to break decisively above $23,284.77.
A **Neutral Scenario** or consolidation phase is also possible, especially if Powell's remarks are ambiguous or if the market digests the current price action without a clear directional catalyst. In this case, the Nasdaq 100 might oscillate between the current resistance and the immediate support levels, perhaps ranging between $23,083.11 and $23,200.74 for a period. This would be characterized by lower trading volumes and indecisive indicator signals. The trigger for this would be continued trading within the defined range, with invalidation occurring on a clear break above $23,284.77 or below $23,083.11. The probability of the bearish scenario appears higher given the confluence of daily bearish indicators and the looming speech, but the short-term bullish signals and the resilience shown so far cannot be entirely dismissed. Traders should exercise caution and prioritize risk management.
Bearish Scenario: Powell's Hawkish Turn
65% ProbabilityNeutral Scenario: Consolidation Amid Ambiguity
25% ProbabilityBullish Scenario: Dovish Pivot or Strong Breakout
10% ProbabilityFrequently Asked Questions: Nasdaq100 Analysis
What happens if the Nasdaq 100 fails to break above the $23,200.74 resistance level after Powell's speech?
If the Nasdaq 100 fails to break above $23,200.74, particularly following a hawkish speech from Powell, expect increased selling pressure. The index could retest the 1-hour support at $23,083.11, with a break below potentially targeting the 4-hour support around $22,835.01.
Should traders consider buying the Nasdaq 100 at current levels around $23,200.74 given the mixed signals?
Buying at current levels carries significant risk due to the strong daily bearish indicators and the looming speech. A more prudent approach would be to wait for a confirmed breakout above $23,200.74 with strong volume, or for a clear signal near support levels like $23,083.11, especially if Powell's remarks are dovish.
Is the RSI at 54.88 on the 1-hour chart a buy signal for the Nasdaq 100?
The RSI at 54.88 on the 1-hour chart indicates neutral momentum with an upward lean, suggesting some buying interest. However, it's not a strong buy signal on its own, especially considering the bearish outlook on the daily chart. Confirmation from price action breaking resistance and other indicators turning bullish would be needed.
How might Powell's upcoming speech impact the Nasdaq 100's correlation with the DXY at 100.26?
A hawkish tone from Powell could further strengthen the DXY at 100.26, increasing its negative correlation with the Nasdaq 100 and potentially accelerating a sell-off. Conversely, a dovish stance might weaken the dollar, easing pressure on tech stocks and allowing the Nasdaq 100 to push higher despite the current resistance.
“The market is always in some state of confusion. Clarity is a rare commodity. Patience and discipline are the trader’s best allies.”
The Nasdaq 100 is at a critical crossroads, with the $23,200.74 resistance level serving as the immediate battleground. While short-term indicators offer some bullish hope, the dominant bearish signals on the daily timeframe, coupled with the uncertainty surrounding Jerome Powell's speech and a strengthening dollar, suggest that caution is the most prudent strategy. Traders should closely monitor price action around the key levels discussed, particularly in the aftermath of Powell's remarks. The ability of the index to decisively break through resistance or hold key support will dictate its next major move. Remember, in volatile markets, disciplined risk management and a clear understanding of the potential scenarios are far more valuable than attempting to predict the unpredictable.
Track markets in real-time
AI-powered analysis, technical indicators and real-time price data.
Join Our Telegram Channel
Breaking market news, AI analysis and trading signals instantly.
Join Channel