Gold Tests $4,559.92 Resistance as Powell Looms: A Technical Deep Dive
XAUUSD hovers near $4,559.92, testing resistance amid geopolitical tensions and anticipation of Fed Chair Powell's speech. Technicals show a mixed picture.
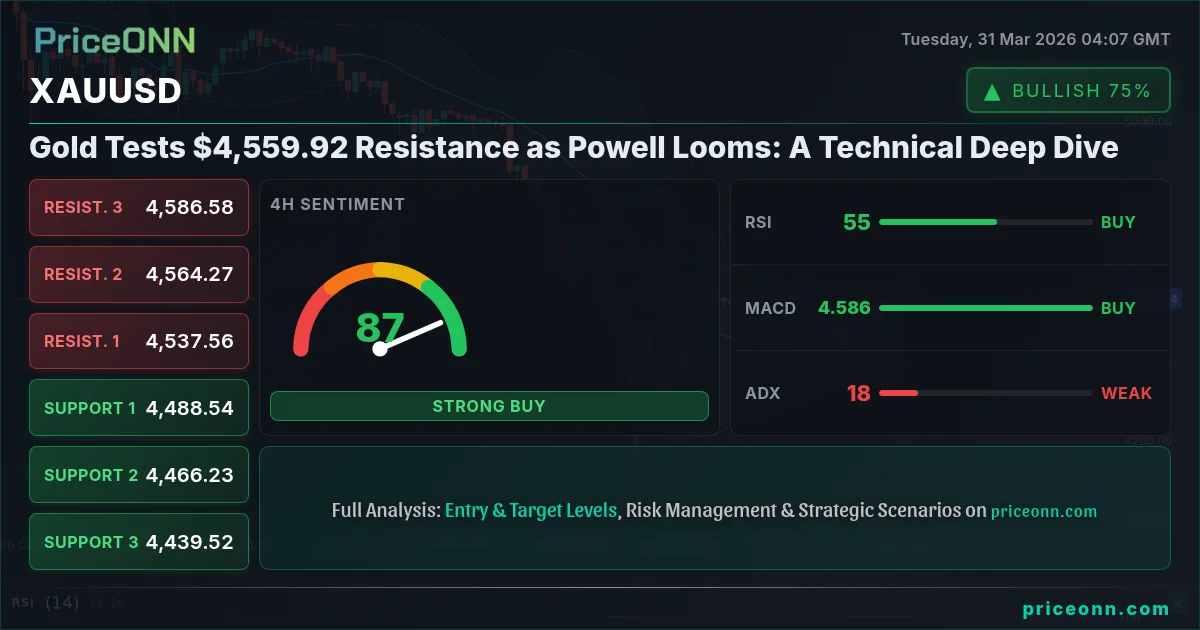
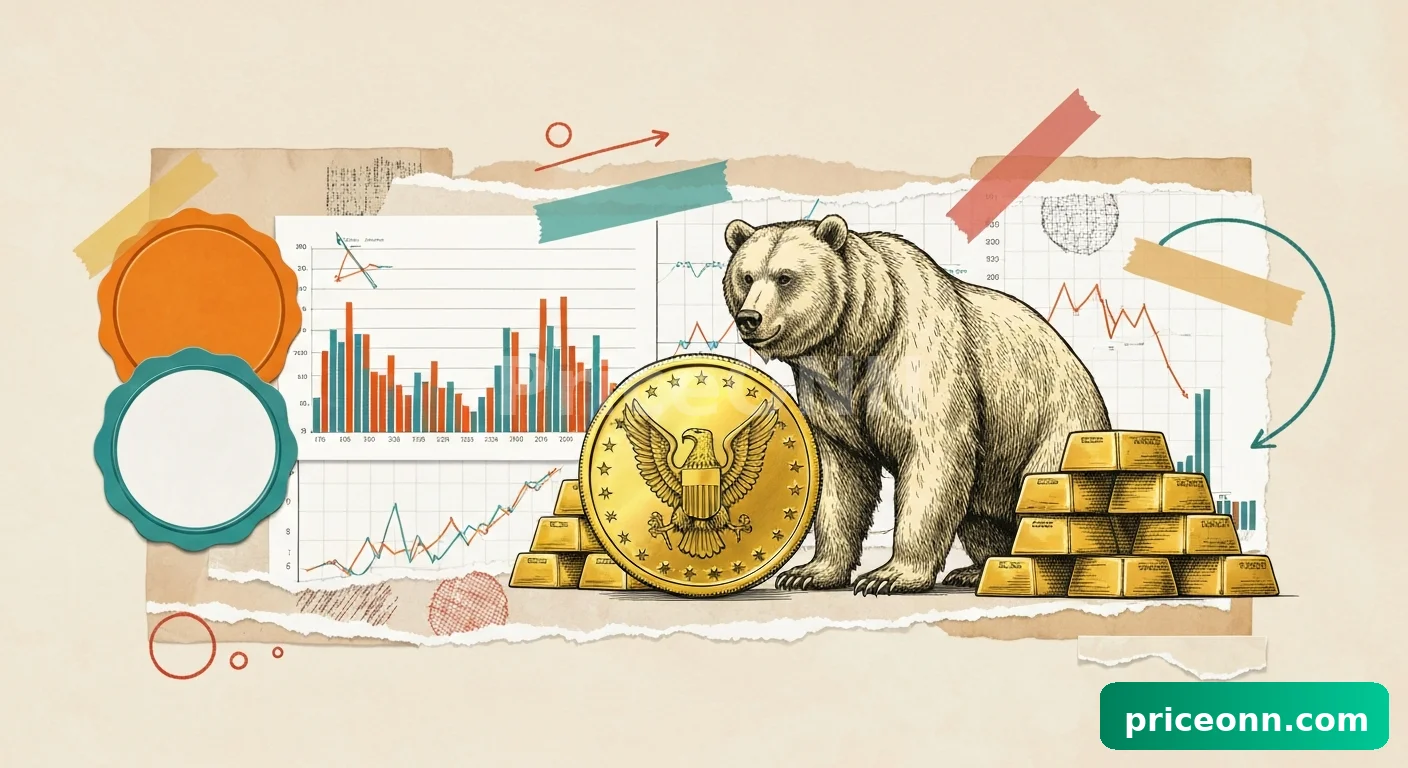
Gold is currently dancing around the critical $4,559.92 mark, a level that's not just a number but a battleground where bulls and bears are locked in a tense standoff. This isn't just about the yellow metal; it's a barometer for global risk appetite, an inflation hedge, and a key focus ahead of Fed Chair Powell's much-anticipated speech. With the Dollar Index (DXY) showing strength and equities presenting a mixed technical picture, the path forward for XAUUSD is far from clear. This analysis dives deep into the multi-timeframe technicals, explores the geopolitical undercurrents, and dissects the probabilities for the week ahead.
- The RSI at 67.3 signals that gold is approaching overbought territory, indicating potential selling pressure could emerge.
- Critical resistance sits at $4,595.08, a level that needs a decisive break for further upside momentum.
- The ADX at 21.44 on the 1-hour chart suggests a neutral trend, meaning the current price action lacks strong directional conviction.
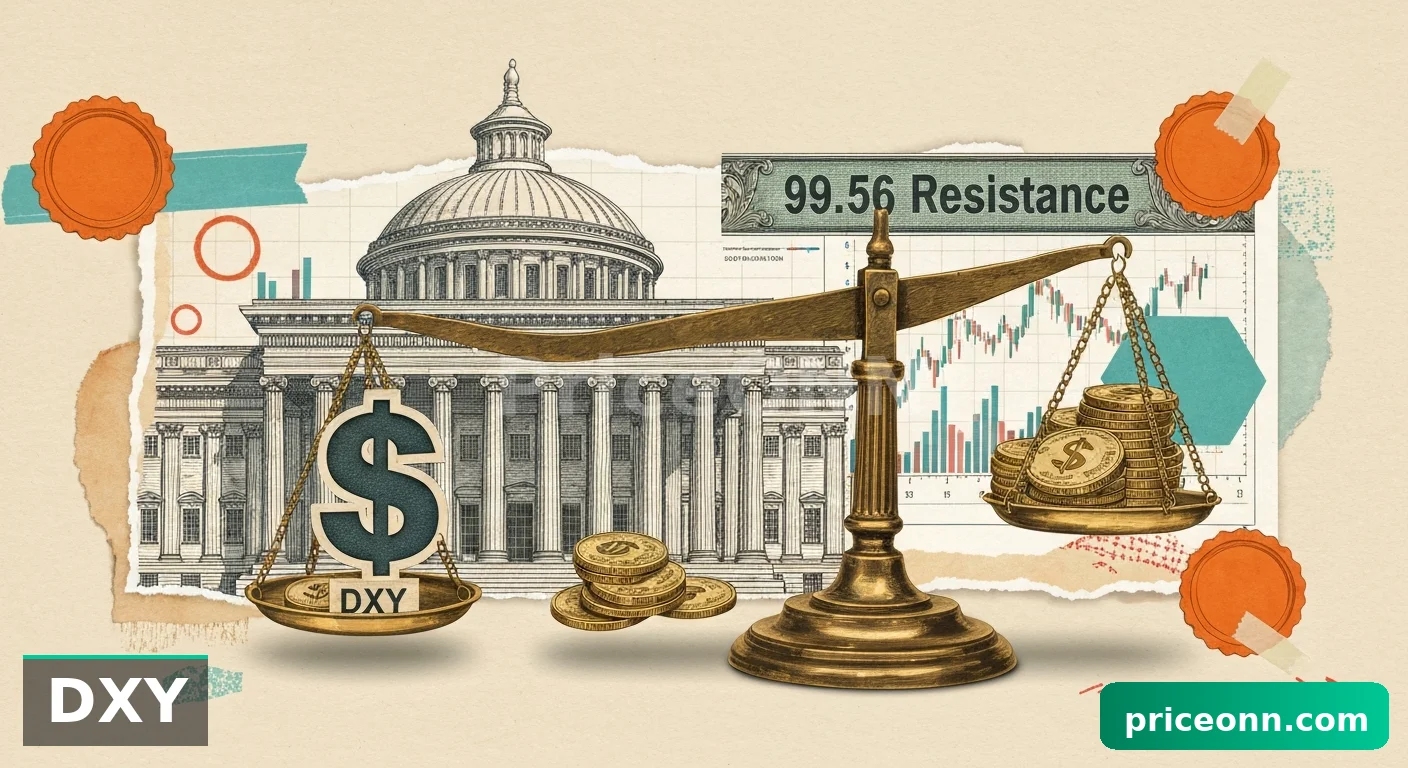
- DXY strength at 100.25 is a headwind for gold, as a stronger dollar typically pressures commodity prices.
The Bullish Case: Charting a Path Above $4,595.08
For gold to extend its recent upward move, breaking decisively above the immediate resistance at $4,595.08 is paramount. On the 1-hour chart, the Relative Strength Index (RSI) at 57.04 still has room to climb, though it's nearing the 60-70 zone often associated with increasing overbought conditions. The MACD is showing positive momentum, with the MACD line above its signal line, a classic bullish signal that suggests upward momentum is building. Bollinger Bands are also supporting a bullish outlook, with price trading above the middle band, indicating a potential continuation of the upward trend. Stochastic oscillators, with K at 69.61 and D at 52.14, are also in bullish territory (%K > %D), reinforcing the idea that buyers are currently in control on the shorter timeframe. The ADX at 21.44 suggests a moderate trend strength, which is encouraging for bulls, but it's not yet indicative of a runaway market. A sustained push above $4,595.08, ideally with increasing volume and a daily close above this level, would signal a stronger commitment from buyers, potentially targeting the next resistance at $4,621.95. This scenario hinges on a continuation of risk-off sentiment globally or a dovish surprise from Fed Chair Powell.
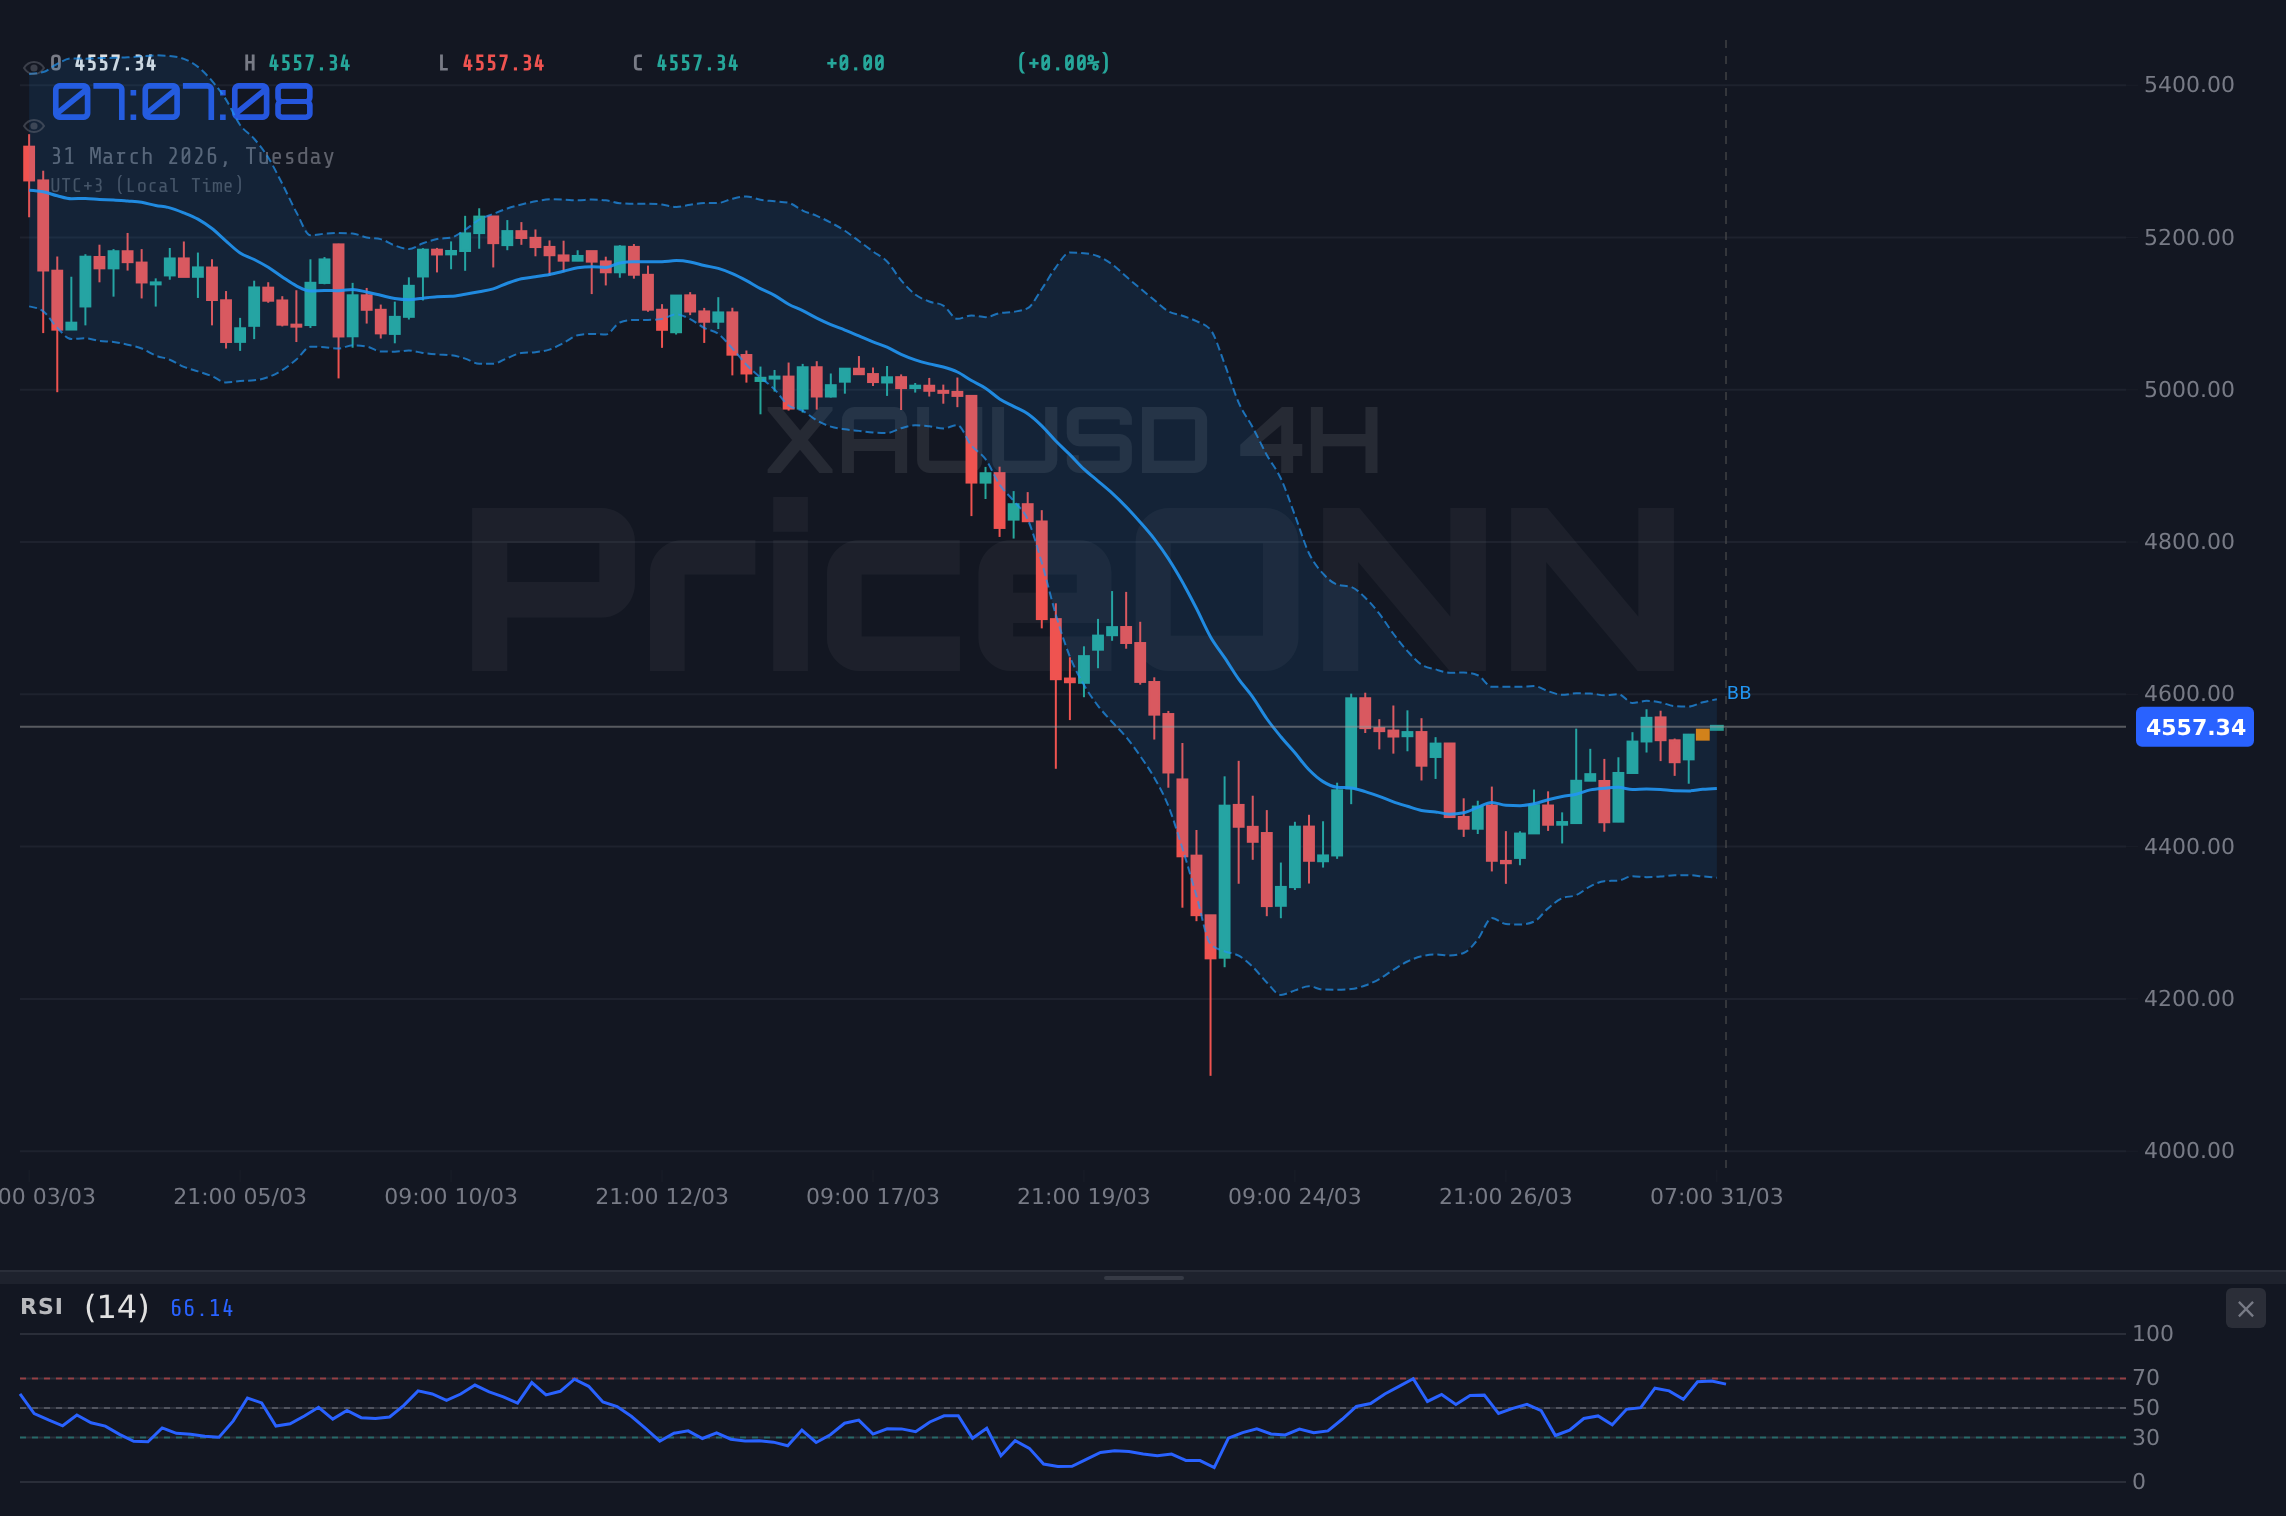
However, the picture becomes more complex when we shift to the 4-hour timeframe. While the overall signal leans towards 'BUY' (6 buys, 2 sells), the ADX at 17.81 indicates a weaker trend compared to the 1-hour chart, suggesting that the upward momentum might be losing steam. The Stochastic K line at 74.92 is nearing the overbought threshold and is just above the D line at 75.33, hinting at a potential pullback or consolidation. The RSI at 55.42 remains in neutral territory but shows a slight upward inclination. This divergence between the shorter and medium-term timeframes highlights the current indecision in the market. For the bullish case to truly solidify, we need to see these 4-hour indicators align more strongly with the upward bias, ideally seeing the Stochastic cross back above 80 and the ADX begin to climb above 20 to confirm a strengthening trend. The key support level to watch on this timeframe is $4,488.54; a hold above this would keep the bullish bias intact, while a breach could signal a deeper correction.
Where Bears Take Control: The Threat Below $4,553.51
The bearish scenario for gold gains traction if key support levels fail to hold, particularly the 1-hour support at $4,553.51. A break below this level, followed by a close below the 4-hour support at $4,488.54, would signal a significant shift in sentiment. On the daily chart, the picture is already leaning bearish, with an RSI reading of 39.86 in neutral-to-oversold territory and MACD showing negative momentum with its line below the signal line. The Bollinger Bands are also below the middle band, indicating a downward price trend on the daily timeframe. The ADX at 33.15 on the daily chart confirms a strong downward trend is in place, which could override shorter-term bullish signals if it gains further traction. Stochastic oscillators on the daily chart are showing a bullish crossover (%K > %D) with K at 48.95 and D at 35.74, but this often occurs during downtrends as prices stabilize before a potential bounce or further fall.
The primary trigger for a bearish move would be a decisive break below the 1-hour support at $4,553.51. If this level gives way, the next target would be the 4-hour support at $4,488.54. A failure to hold this level could see prices rapidly testing the daily support at $4,426.81. The confluence of a strengthening Dollar Index (currently at 100.25 and showing a strong daily uptrend) and potential 'risk-on' sentiment driven by positive geopolitical news could further fuel a sell-off in gold. Furthermore, any hawkish undertones from Fed Chair Powell's upcoming speech could significantly dampen demand for non-yielding assets like gold, accelerating a move lower. The daily chart's ADX at 33.15 is a strong indicator that if the bears manage to break these shorter-term supports, the downtrend could be substantial.
The Waiting Game: Consolidation Around $4,559.92
The current market setup presents a strong case for consolidation, especially given the conflicting signals across different timeframes and the looming uncertainty of Fed Chair Powell's speech. On the 1-hour chart, the ADX at 21.44 suggests a trend that is neither strongly trending nor completely flat, indicating a period of sideways movement is plausible. The RSI hovering around 57 on the 1-hour chart and 55 on the 4-hour chart also points to a lack of strong conviction in either direction. Prices could remain range-bound between the immediate 1-hour support of $4,553.51 and resistance at $4,595.08, or potentially within the broader 4-hour range defined by support at $4,488.54 and resistance at $4,537.56, until a clearer catalyst emerges.
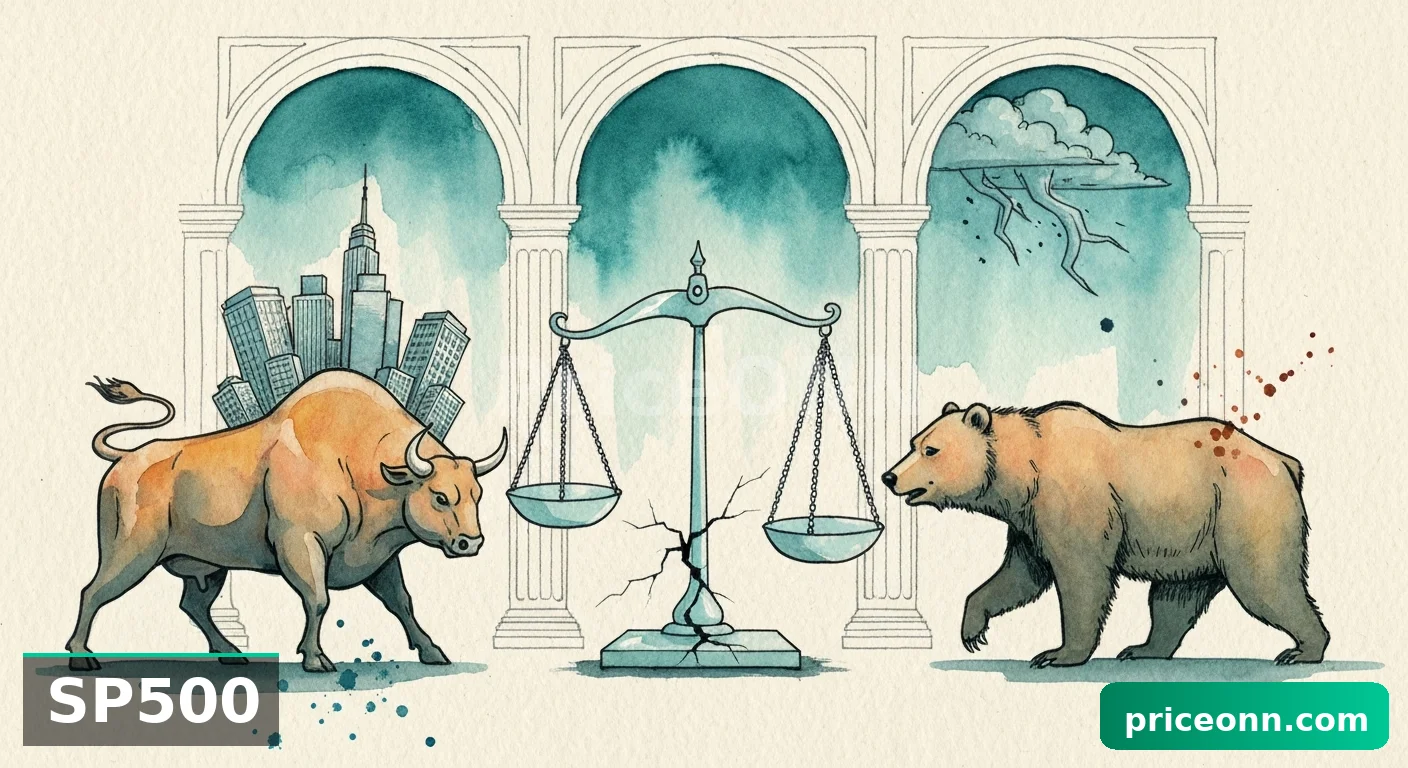
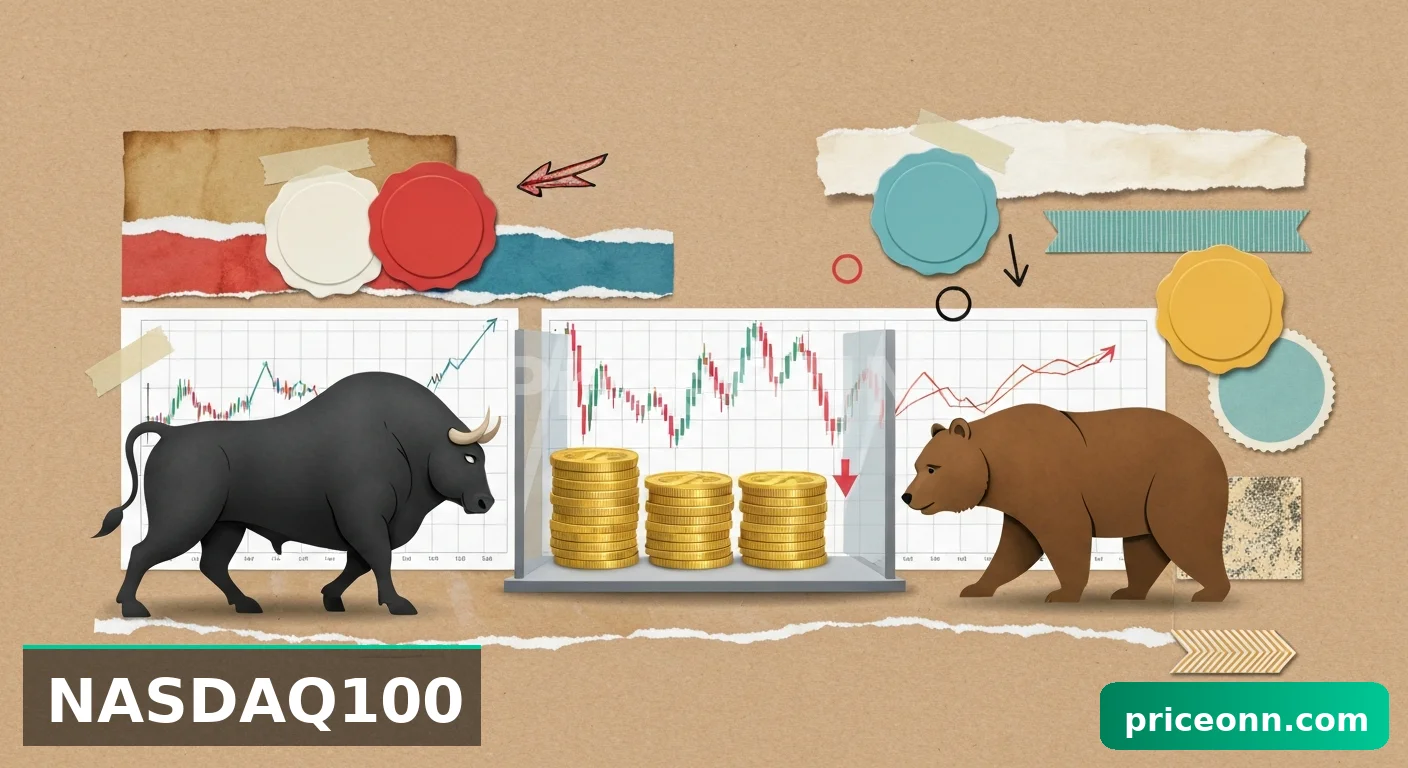
This neutral scenario is often driven by market participants waiting for confirmation. Traders might be hesitant to take significant positions ahead of major economic events like Powell's speech or crucial economic data releases. The DXY, currently at 100.25, is also in a strong daily uptrend, which could cap gold's upside and keep it within a tight range. If geopolitical tensions ease unexpectedly, or if risk appetite surges in equity markets (SP500 at 6400.3 and Nasdaq at 23134.63 showing recent gains, though daily trends are bearish), it could reduce safe-haven demand for gold, leading to range-bound trading. The lack of a strong, consistent trend signal across all timeframes supports this view. The market is essentially in a holding pattern, digesting recent price action and awaiting directional clues.
Bullish Scenario: Rally Towards $4,621.95
Bearish Scenario: Descent to $4,488.54
Neutral Scenario: Range-Bound Trading
The Verdict: Why Patience is Key
Assessing the current technical landscape, the 4-hour chart presents a compelling argument for caution and patience. While the 1-hour chart shows bullish momentum, the conflicting signals on the 4-hour (stochastic nearing overbought, weaker ADX) and the bearish leanings on the daily chart (RSI 39.86, ADX 33.15) create a complex environment. The proximity of Fed Chair Powell's speech adds another layer of uncertainty, making any strong directional bet risky right now. Therefore, the most probable scenario in the immediate short term (next 24-48 hours) appears to be **consolidation or a range-bound market, with a slight bearish bias due to the daily timeframe's trend strength.** I assign a 55% probability to the neutral/consolidation scenario, a 30% probability to the bearish scenario, and only a 15% probability to a sustained bullish breakout at this moment. This is because the daily trend strength (ADX 33.15) suggests that any rallies might be met with selling pressure from longer-term traders.
The geopolitical situation, particularly the ongoing tensions in the Middle East and the resulting oil price surge (Brent at $110.81, WTI at $103.17), continues to underpin gold's safe-haven appeal. News reports indicate that these tensions are fueling global fuel prices and prompting policy considerations, which typically keeps investors on edge and supports gold. However, the strengthening Dollar Index (DXY at 100.25, with a strong daily uptrend) acts as a counterforce, making gold more expensive for holders of other currencies. This dynamic often leads to choppy price action, as seen in the current data. The market is caught between inflation hedges and a strong dollar narrative.
| Indicator | Value | Signal | Interpretation |
|---|---|---|---|
| RSI (14) | 67.3 | Neutral | Approaching overbought, potential for pullback. |
| MACD Histogram | +1.09% | Bullish Momentum | Positive momentum on 1H, but watch daily trend. |
| Stochastic | K:69.61, D:52.14 | Bullish Signal | Bullish cross on 1H, but 4H shows divergence. |
| ADX | 21.44 | Neutral Trend | Moderate trend strength on 1H, weak on 4H, strong on 1D (33.15). |
| Bollinger Bands | Mid Band | Watch | Price above mid band on 1H/4H, below on 1D. |
What I'm Watching This Week
My focus this week is on a few key triggers that will dictate the next significant move for XAUUSD. Firstly, I'm watching the daily close relative to the $4,595.08 resistance level. A strong daily close above this point, sustained by positive intraday momentum, would validate the bullish scenario. Secondly, the behavior of price around the 1-hour support at $4,553.51 is critical. A decisive break below this level, especially if accompanied by increasing volume and negative news flow, would open the door for the bearish scenario targeting $4,488.54 and potentially lower.
Finally, and perhaps most importantly, is the reaction to Fed Chair Powell's speech. Any hints of a more hawkish stance on inflation or a prolonged period of higher interest rates could trigger a sharp sell-off in gold, regardless of the current technical setup. Conversely, any indication of a potential pivot or a more dovish outlook could fuel a rally, pushing gold towards its higher resistance levels. The interplay between geopolitical risks, the dollar's strength, and central bank policy will be the dominant theme. Traders should remain vigilant, manage risk tightly, and wait for clear signals rather than forcing trades in this uncertain environment.
Frequently Asked Questions: XAUUSD Analysis
What happens if XAUUSD breaks above $4,595.08 resistance?
A decisive break and sustained daily close above $4,595.08 would likely trigger a bullish move, targeting the next resistance levels at $4,621.95 and potentially $4,636.65. This would signal strong buying conviction, likely driven by escalating geopolitical fears or dovish central bank commentary.
Should I buy XAUUSD at current levels around $4,559.92 given the mixed signals?
Given the conflicting signals across timeframes and the looming Fed speech, entering aggressively at current levels is not advised. A more prudent approach would be to wait for confirmation: either a break above $4,595.08 for a bullish entry or a confirmed break below $4,553.51 for a bearish setup. Risk management is paramount.
Is the RSI at 67.3 a sell signal for XAUUSD right now?
An RSI of 67.3 on the 1-hour chart is approaching overbought territory but is not yet an immediate sell signal on its own. It indicates that the bullish momentum is strong but could be nearing exhaustion. A confirmed bearish divergence or a break below key support levels would be needed to validate a sell signal.
How will Fed Chair Powell's speech affect XAUUSD this week?
Powell's speech is a major wildcard. Any hawkish commentary regarding inflation persistence could lead to a sell-off in gold as the dollar strengthens and yields rise. Conversely, dovish remarks or signals of a Fed pivot could boost gold prices significantly, especially if geopolitical tensions remain elevated.
The market is currently a complex interplay of geopolitical fears, inflation concerns, and central bank policy expectations. While gold has shown resilience, the critical resistance level at $4,595.08 and the looming presence of Fed Chair Powell's speech demand caution. The daily chart's bearish undertones cannot be ignored, suggesting that rallies might be opportunities for sellers. Patience and disciplined risk management remain the most valuable tools for navigating these choppy waters. The market will eventually provide a clearer direction; the key is to wait for the right setup rather than chasing speculative moves.
Track markets in real-time
AI-powered analysis, technical indicators and real-time price data.
Join Our Telegram Channel
Breaking market news, AI analysis and trading signals instantly.
Join Channel