BTCUSD Targets $68.2K as Powell Looms; Technicals Show Strength
Bitcoin bulls eye $68.2K resistance as BTCUSD hovers around $67,736.00. Traders watch Powell's speech amid mixed technical signals and strong ADX.
Bitcoin (BTCUSD) is currently trading at $67,736.00, perched precariously near a key resistance level that bulls are aggressively targeting for a potential breakout towards $68.2K. However, the looming shadow of Federal Reserve Chair Jerome Powell's upcoming speech injects a dose of caution into the market. While the latest technical indicators on various timeframes paint a complex picture, the strong ADX reading suggests a trend is indeed in play, making the next few sessions critical for determining Bitcoin's short-to-medium term trajectory. This analysis delves into the multi-faceted technical landscape, exploring potential scenarios and the critical price levels traders must watch.
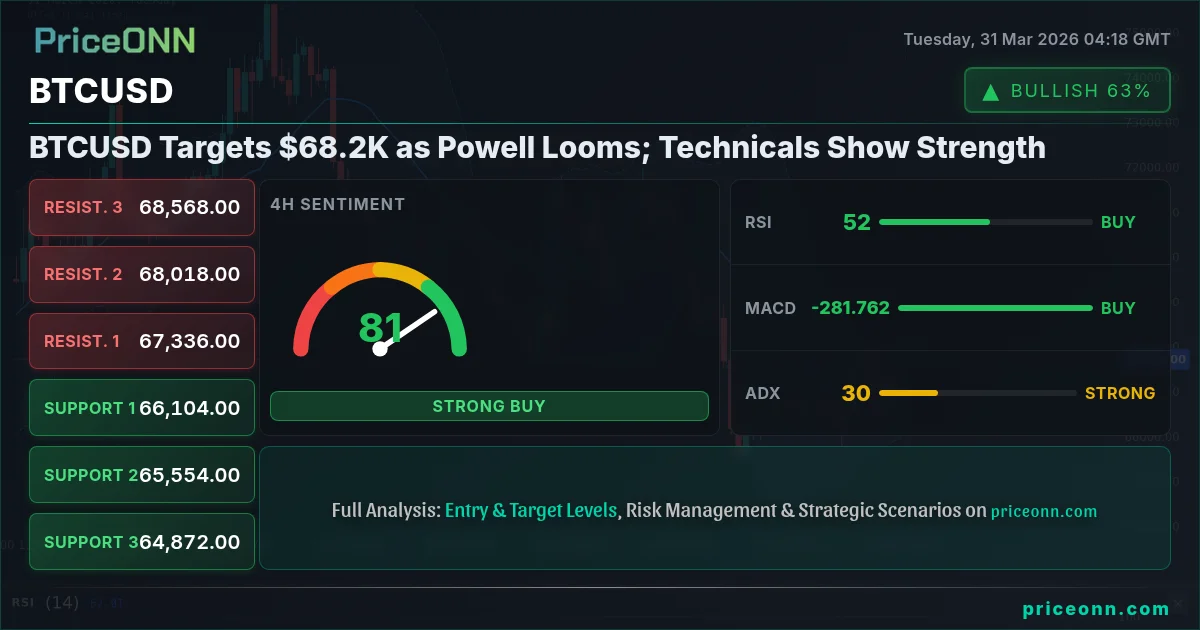
- BTCUSD is currently priced at $67,736.00, with bulls aiming for the $68,200 resistance zone.
- The ADX at 29.78 indicates a strong trend, while RSI at 51.92 (4H) suggests room for further movement.
- Key support for BTCUSD is identified at $67,463.67 (1H) and $66,104 (4H), with resistance at $68,103.67 (1H) and $67,336 (4H).
- Traders are closely monitoring Fed Chair Powell's speech for potential shifts in monetary policy outlook, which could significantly impact risk assets like Bitcoin.
Navigating the Bullish Momentum: BTCUSD's Push Towards $68.2K
The Immediate Upside Target: A Critical Juncture
Bitcoin bulls have set their sights firmly on the $68.2K mark, a level that represents a significant psychological and technical resistance. Currently trading at $67,736.00, BTCUSD is showing a determined effort to breach higher, supported by a generally positive sentiment across the crypto market and a notable surge in its daily change of 1.62%, adding $1082. The 1-hour chart analysis reveals a bullish trend with a power of 79%, and the MACD is displaying positive momentum, sitting above its signal line. This suggests that short-term traders are leaning towards an upward bias, with immediate resistance eyed at $68,103.67 and then $68,261.33. The Stochastic oscillator, with K at 75.33 and D at 52.88, further reinforces this bullish outlook, signaling a buy with %K firmly above %D. The RSI(14) at 59.41 on the 1H chart, while in neutral territory, shows an upward inclination, indicating that momentum is building rather than fading.
However, this optimism must be tempered by the broader market context and the upcoming Federal Reserve commentary. The DXY (Dollar Index) is showing strength, currently at 100.25, which historically can put pressure on risk assets like Bitcoin. The S&P 500 and Nasdaq 100 are also showing mixed signals across different timeframes, with daily charts indicating a bearish trend despite intraday strength. This divergence highlights the importance of a granular approach to technical analysis and a keen awareness of macroeconomic undercurrents. The ADX at 17.35 on the 1H chart suggests a weak trend, implying that the current upward move might lack sustained conviction. This means that while the immediate inclination is bullish, confirmation through sustained price action above key resistance levels will be crucial.
The 4-Hour Chart: A Tale of Two Signals
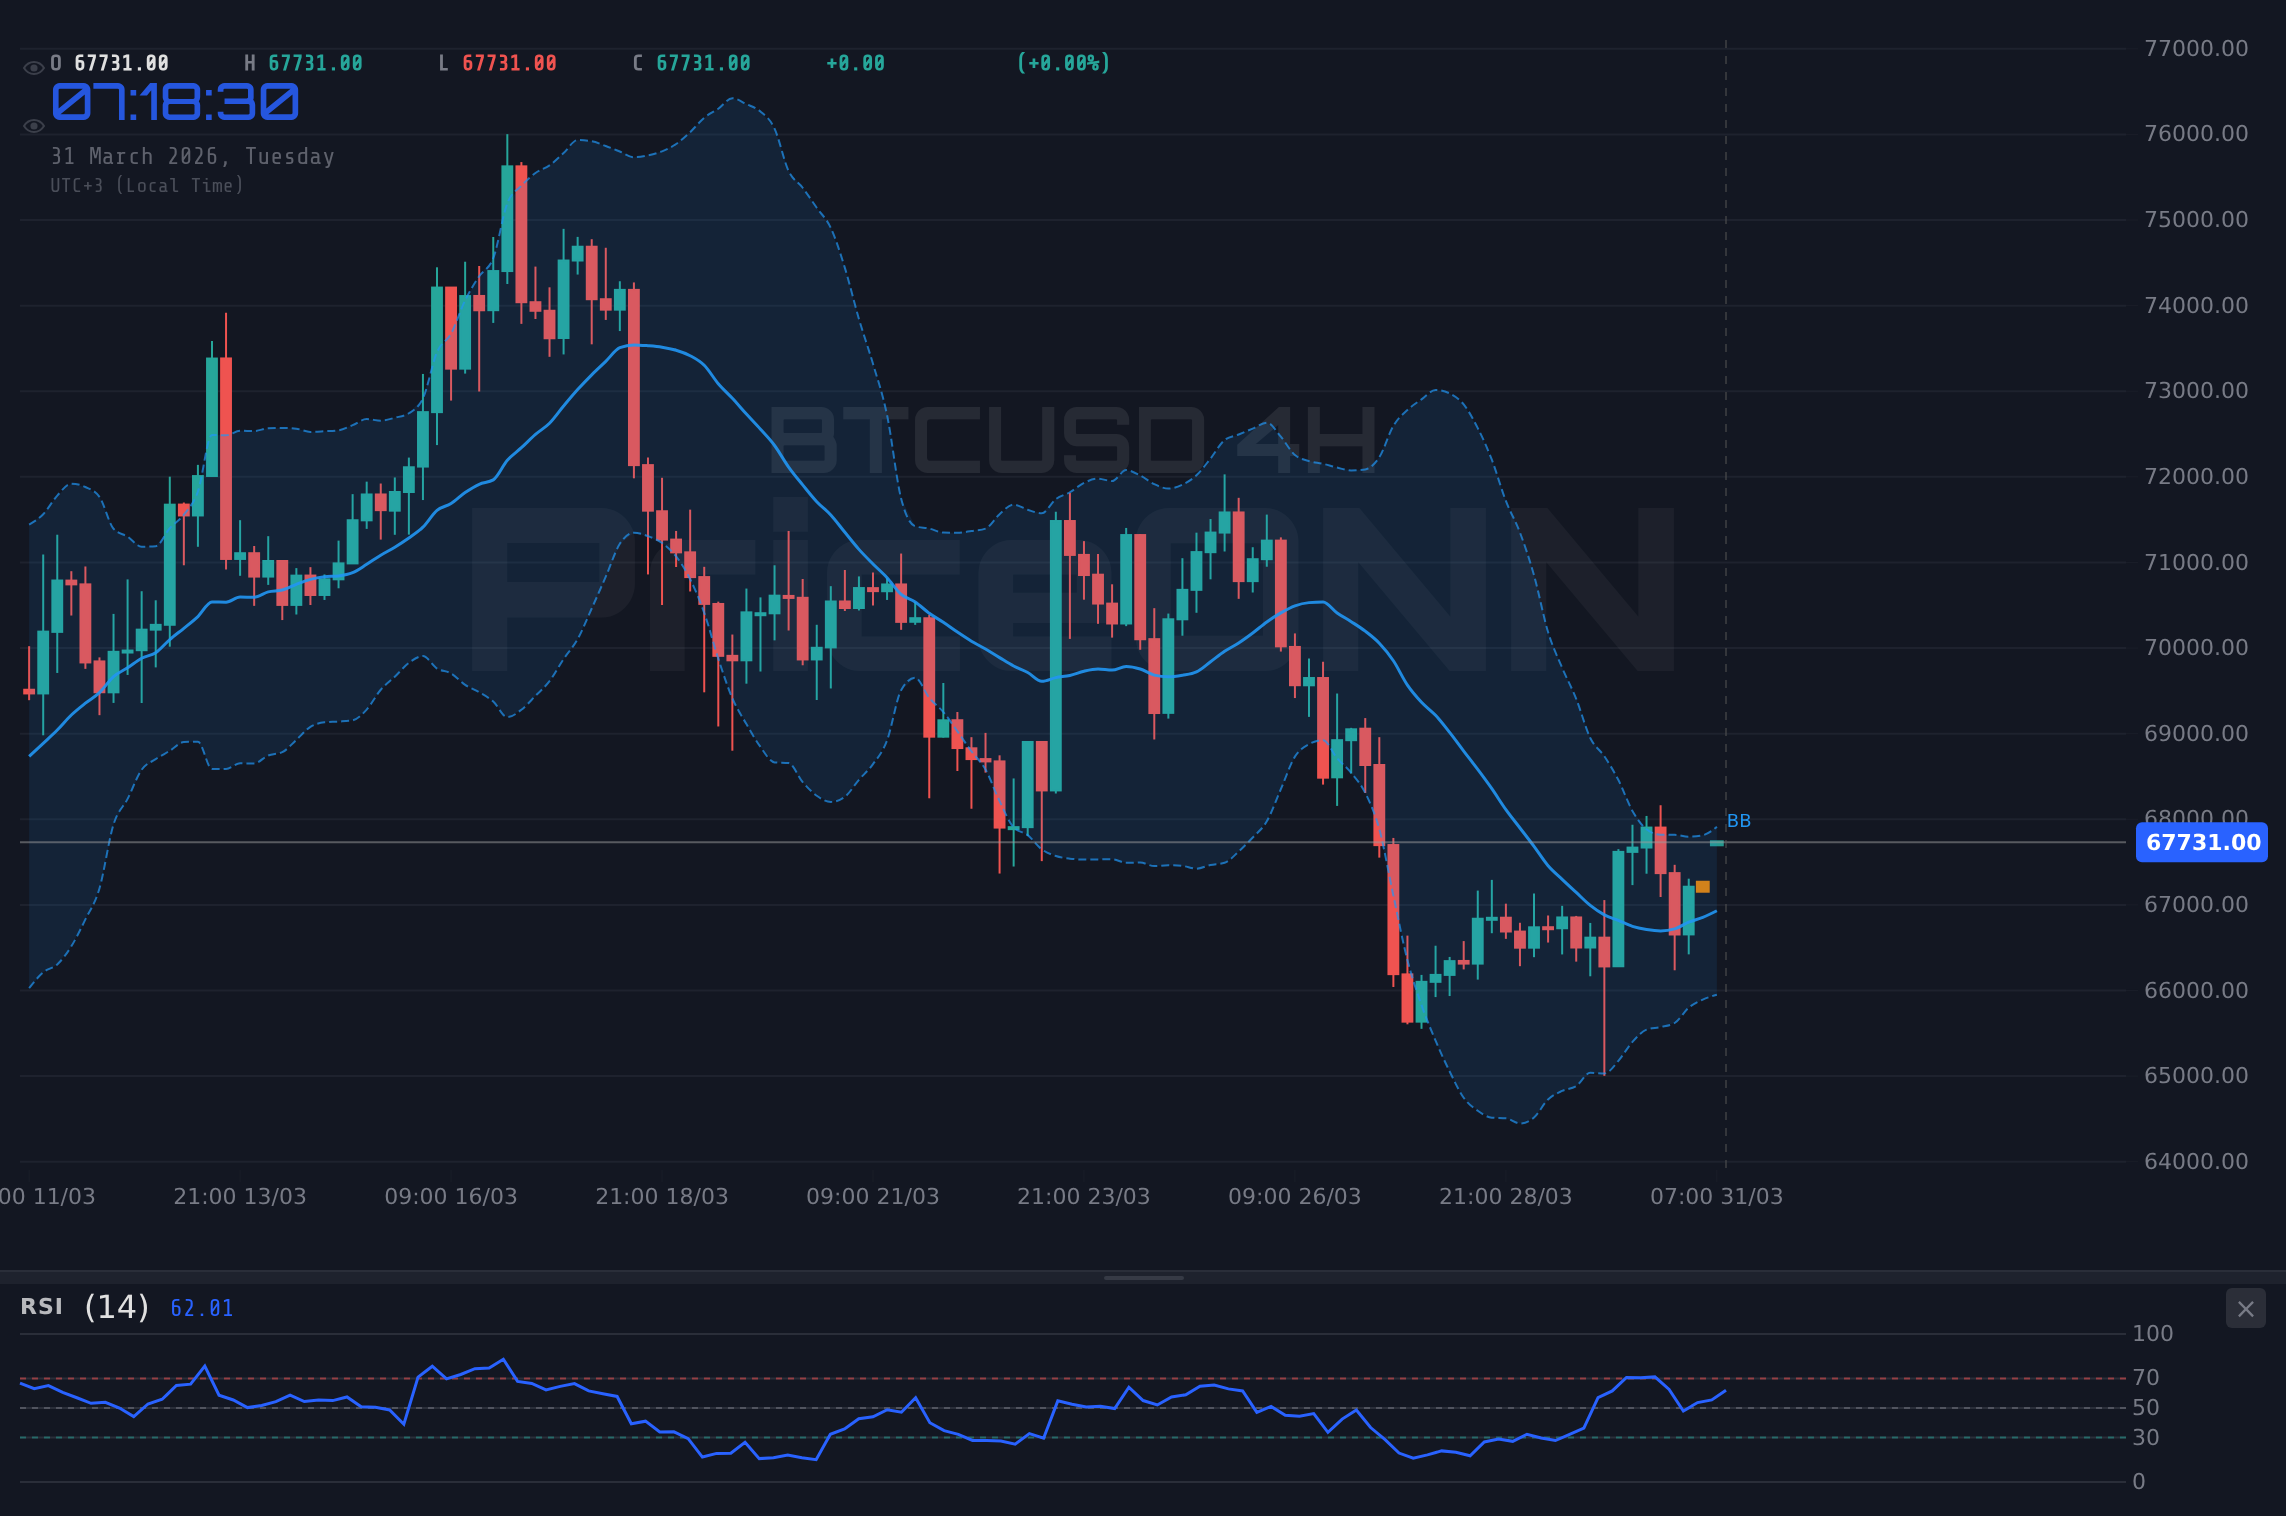
Diving deeper into the 4-hour timeframe offers a more nuanced perspective. Here, the trend is classified as neutral with 50% power, a stark contrast to the 1-hour chart's bullish inclination. The MACD is positive, but the Stochastic oscillator presents a conflicting signal: K at 71.20 and D at 79.17 indicate a potential bearish divergence, with %K dipping below %D. This suggests that while prices have been moving up, the underlying momentum might be weakening, potentially signaling a pullback. The RSI(14) at 51.92 is also in neutral territory, offering little directional conviction on this timeframe. Furthermore, the ADX at 29.78 is notably higher than on the 1H chart, indicating a stronger trend, albeit still classified as mid-strength. This confluence of signals - bullish MACD and RSI, but bearish Stochastic divergence and a strong ADX - creates a complex trading environment.
The support levels on the 4-hour chart are clearly defined: $66,104, $65,554, and $64,872. The resistance levels are $67,336, $68,018, and $68,568. The current price of $67,736.00 sits between the first levels of resistance and support on this timeframe, highlighting a potential range-bound scenario if the conflicting signals persist. The Bollinger Bands are also hovering above the middle band, suggesting an upward bias, but the Stochastic divergence warrants caution. This mixed picture on the 4H chart underscores the importance of waiting for clearer signals or confirmation from price action before committing to significant positions. The market appears to be at a crossroads, with the bulls needing to decisively break through the $67,336 resistance to invalidate the bearish Stochastic signal and confirm a sustained upward move.
The Daily Perspective: Long-Term Trend and Caution
On the daily timeframe, the picture for BTCUSD becomes more challenging for the bulls. The trend is classified as bullish with 79% power, but this is accompanied by negative MACD momentum, with the MACD line below its signal line. This suggests that while the longer-term trend might still be upwards, the immediate directional force is leaning negative. The RSI(14) at 45.33 is in neutral territory but trending downwards, indicating a potential weakening of buying pressure. The Stochastic oscillator, however, offers a bullish signal with K at 26.28 and D at 21.99, showing %K above %D, suggesting a potential bounce from oversold conditions - though these levels are not extremely oversold. The ADX at 18.36 points to a weak trend on this timeframe, suggesting that the daily chart might be consolidating or experiencing a temporary lull rather than a strong directional move.
The daily support levels are at $65,050, $63,446, and $61,889, while resistance is pegged at $68,211, $69,768, and $71,372. The current price of $67,736.00 is trading below the middle Bollinger Band on the daily chart, which typically indicates a bearish inclination. This daily outlook, characterized by negative MACD momentum and a downward-tending RSI, contrasts sharply with the more optimistic short-term signals. It suggests that any rallies might face significant headwinds from longer-term sellers, and a sustained move above the daily resistance at $68,211 would be required to invalidate the current bearish undertones. The market is essentially caught between short-term bullish signals and longer-term cautionary indicators, creating a volatile environment where quick reversals are possible.
The Macroeconomic Overhang: Powell's Influence and Market Correlation
The Shadow of the Fed: Powell's Potential Impact
The most significant wildcard for BTCUSD, and indeed for all risk assets, remains the upcoming speech by Federal Reserve Chair Jerome Powell. The market is highly sensitive to any hints about the future path of monetary policy, particularly regarding interest rates. With inflation data in the US showing mixed signals and the labor market remaining resilient, the Fed's stance on potential rate cuts or hikes is under intense scrutiny. If Powell adopts a hawkish tone, suggesting a prolonged period of higher interest rates or even a potential for further hikes to combat stubborn inflation, it could trigger a significant risk-off sentiment. This would likely lead to a strengthening of the US Dollar (DXY, currently at 100.25) and a sell-off in assets like Bitcoin. Conversely, a dovish tone, signaling a readiness to cut rates sooner rather than later, could boost risk appetite and send BTCUSD higher.
The current market pricing reflects a degree of uncertainty. While some traders might be pricing in a certain number of rate cuts throughout the year, any deviation from these expectations could cause significant market volatility. The correlation between Bitcoin and traditional risk assets like the S&P 500 (currently at 6402.4, showing a strong daily rise but mixed 4H/1D trends) and the Nasdaq 100 (23145.87, similar mixed picture) is a crucial factor. A hawkish Fed could weigh on equities, and by extension, on Bitcoin. Geopolitical tensions, such as the ongoing Middle East conflict contributing to oil price surges (Brent at $110.98, WTI at $103.33), add another layer of complexity, potentially fueling inflation concerns and complicating the Fed's decision-making. This makes Powell's commentary not just a monetary policy signal, but a potential catalyst for broader market sentiment shifts.
DXY Strength and Gold's Safe Haven Appeal
The Dollar Index (DXY) is currently trading at 100.25, exhibiting a strong upward trend on the daily chart (ADX 33.32) and showing signs of bullish momentum. Historically, a strengthening dollar often correlates with a weakening of other major currencies like EURUSD (1.14706) and GBPUSD (1.32011), which are showing bearish trends on their daily charts. This robust dollar environment can act as a headwind for Bitcoin, as it increases the cost of dollar-denominated assets for holders of other currencies and signals a potential flight to safety. Gold (XAUUSD), a traditional safe-haven asset, is currently priced at $4,559.16 and showing a bullish direction, which might suggest that while the dollar is strong, there's also underlying demand for perceived safe havens due to geopolitical risks. This dynamic creates an interesting interplay: a strong dollar and rising gold prices could signal caution for riskier assets like BTCUSD.
The correlation between Bitcoin and gold is often debated, but in times of heightened geopolitical uncertainty and inflation fears, both can see demand as alternative stores of value. However, Bitcoin is generally considered a higher-risk asset than gold. Therefore, if the DXY continues its upward march and geopolitical tensions remain elevated, it could create a scenario where investors favor the dollar and gold over Bitcoin. The daily RSI for DXY is at 64.25, indicating a strong uptrend, while the Stochastic is in overbought territory, suggesting a potential pullback is due. This makes the DXY's next move particularly important. A significant pullback in the dollar could provide a tailwind for BTCUSD, while continued strength would likely add to the selling pressure.
Trade Scenarios: Charting the Path Forward for BTCUSD
Bullish Scenario: Breakout Above $68.2K
45% ProbabilityNeutral Scenario: Consolidation Around $67.7K
30% ProbabilityBearish Scenario: Powell Dampens Enthusiasm
25% ProbabilityWhat I'm Watching: Key Triggers for the Week Ahead
The coming days will be pivotal for BTCUSD, with several key triggers likely to dictate price direction. Firstly, the outcome of Jerome Powell's speech is paramount. Any hawkish leanings could quickly shift sentiment and invalidate the bullish short-term signals, pushing BTCUSD towards its support levels. Traders should be prepared for increased volatility around this event. Secondly, price action around the $68,103.67 to $68,261.33 resistance zone on the 1-hour chart is critical. A decisive break and hold above this area, especially with increasing volume, would strongly support the bullish scenario, targeting higher levels. Conversely, rejection from this zone, coupled with a break below the $67,463.67 1-hour support, would signal a shift towards the bearish outlook.
Finally, monitoring the DXY and broader equity markets will be essential. If the dollar continues to strengthen and major indices like the S&P 500 and Nasdaq show renewed weakness, it would add significant weight to the bearish case for Bitcoin. Conversely, a pullback in the dollar and a stabilization or rally in equities could provide the necessary tailwind for BTCUSD to overcome its immediate resistance. The ADX reading of 29.78 on the 4H chart suggests that whichever direction the market chooses, it's likely to be a trending move, making it crucial to identify the right side of the trade early.
The Indicator Dashboard: A Snapshot of BTCUSD's Technical Health
| Indicator | Value | Signal | Interpretation |
|---|---|---|---|
| RSI (14) | 51.92 | Neutral | Upward inclination on 1H, but trending down on 1D. Room to move. |
| MACD | Positive Momentum | Bullish | Positive on 1H, but negative on 4H/1D, indicating conflicting short-term vs long-term momentum. |
| Stochastic | K=71.20, D=79.17 (4H) | Bearish Divergence | Conflicting signals across timeframes; 4H shows potential bearish divergence. |
| ADX | 29.78 | Strong Trend | Indicates a trending market on 4H, suggesting conviction once a direction is established. |
| Bollinger | Above Mid Band (1H/4H) | Bullish Inclination | Suggests upward pressure, but daily is below mid-band. |
Key Levels to Watch: Support and Resistance Zones
Frequently Asked Questions: BTCUSD Analysis
What happens if BTCUSD breaks above the $68,103.67 resistance level?
A sustained break above $68,103.67, confirmed by strong volume, would invalidate bearish signals on shorter timeframes and could target the $69,768 daily resistance level. This would align with the bullish scenario, suggesting further upside potential.
Should I buy BTCUSD at current levels of $67,736.00 given the mixed signals?
Given the conflicting signals between timeframes and the looming Powell speech, caution is advised. A more prudent approach might be to wait for confirmation of a breakout above $68,103.67 or a clear rejection and bounce from support around $66,104. Trading based on current levels carries significant risk.
Is the RSI at 51.92 a buy or sell signal for BTCUSD right now?
An RSI of 51.92 on the 4-hour chart is in neutral territory, indicating neither strong buying nor selling pressure. While it shows an upward inclination on the 1-hour chart, its downward trend on the daily chart suggests caution. It's not a definitive buy or sell signal on its own.
How will Powell's speech affect BTCUSD this week?
Powell's speech is a major catalyst. A hawkish tone could trigger a sell-off in risk assets, pushing BTCUSD towards its support levels. Conversely, a dovish tone might boost risk appetite, supporting a move towards the $68.2K resistance and potentially higher.
Track markets in real-time
AI-powered analysis, technical indicators and real-time price data.
Join Our Telegram Channel
Breaking market news, AI analysis and trading signals instantly.
Join Channel