Silver Tests $72.04 Resistance as Powell Looms; Geopolitical Jitters Persist
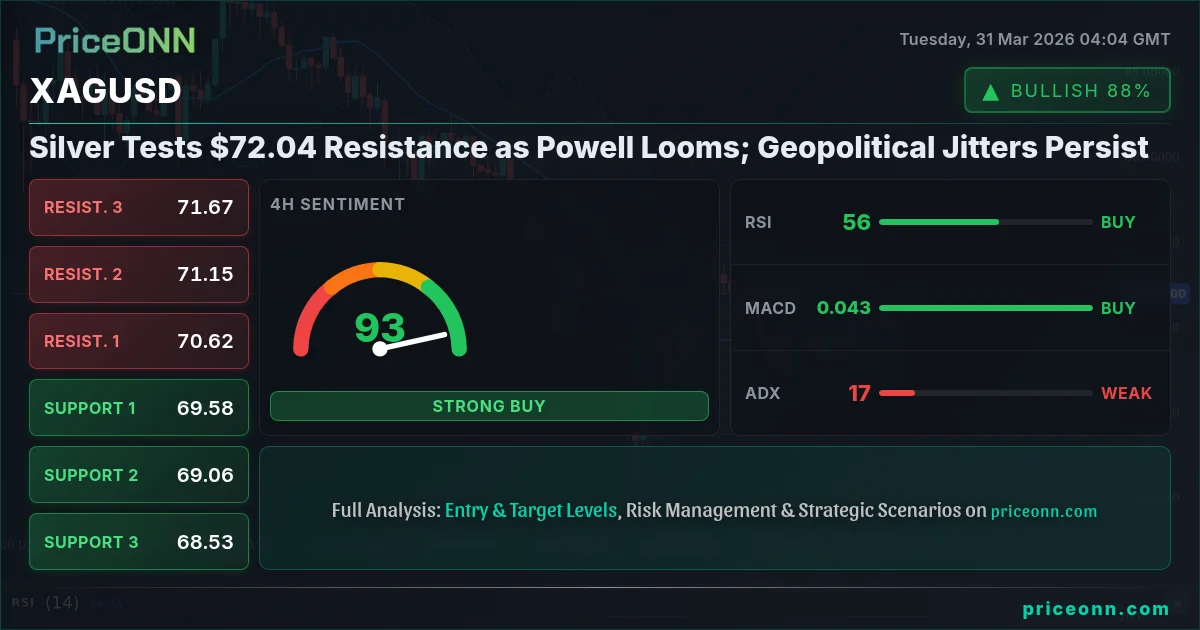
XAGUSD hovers near $72.04, testing resistance levels amid ongoing geopolitical tensions and anticipation of Fed Chair Powell's remarks. Technicals show mixed signals.
The global financial stage is set for a pivotal moment as silver, specifically XAGUSD, finds itself testing critical resistance around the $72.04 mark. This ascent occurs against a backdrop of persistent geopolitical anxieties, particularly the escalating Middle East conflict and its ripple effects on energy markets, coupled with keen anticipation of Federal Reserve Chair Jerome Powell's upcoming statements. These macro-level forces are increasingly dictating market sentiment, creating a complex environment where technical signals must be interpreted with a heightened awareness of fundamental drivers. The interplay between safe-haven demand, inflation expectations, and central bank policy signals is creating a delicate balance for precious metals, making the current technical setup for XAGUSD a subject of intense scrutiny among traders and analysts.
- XAGUSD is currently testing resistance near $72.04, with the 1-hour chart showing positive momentum but the daily chart indicating a bearish trend.
- The RSI is at 61.18 on the 1-hour chart, suggesting upward momentum, while the 1-day RSI stands at 42.49, indicating a bearish inclination.
- Critical resistance is observed around $73.66, while the immediate support level to watch on the 1-hour chart is $71.51.
- Geopolitical tensions and Fed Chair Powell's upcoming remarks are key macro drivers influencing silver's price action, creating a WATCH_ZONE scenario.
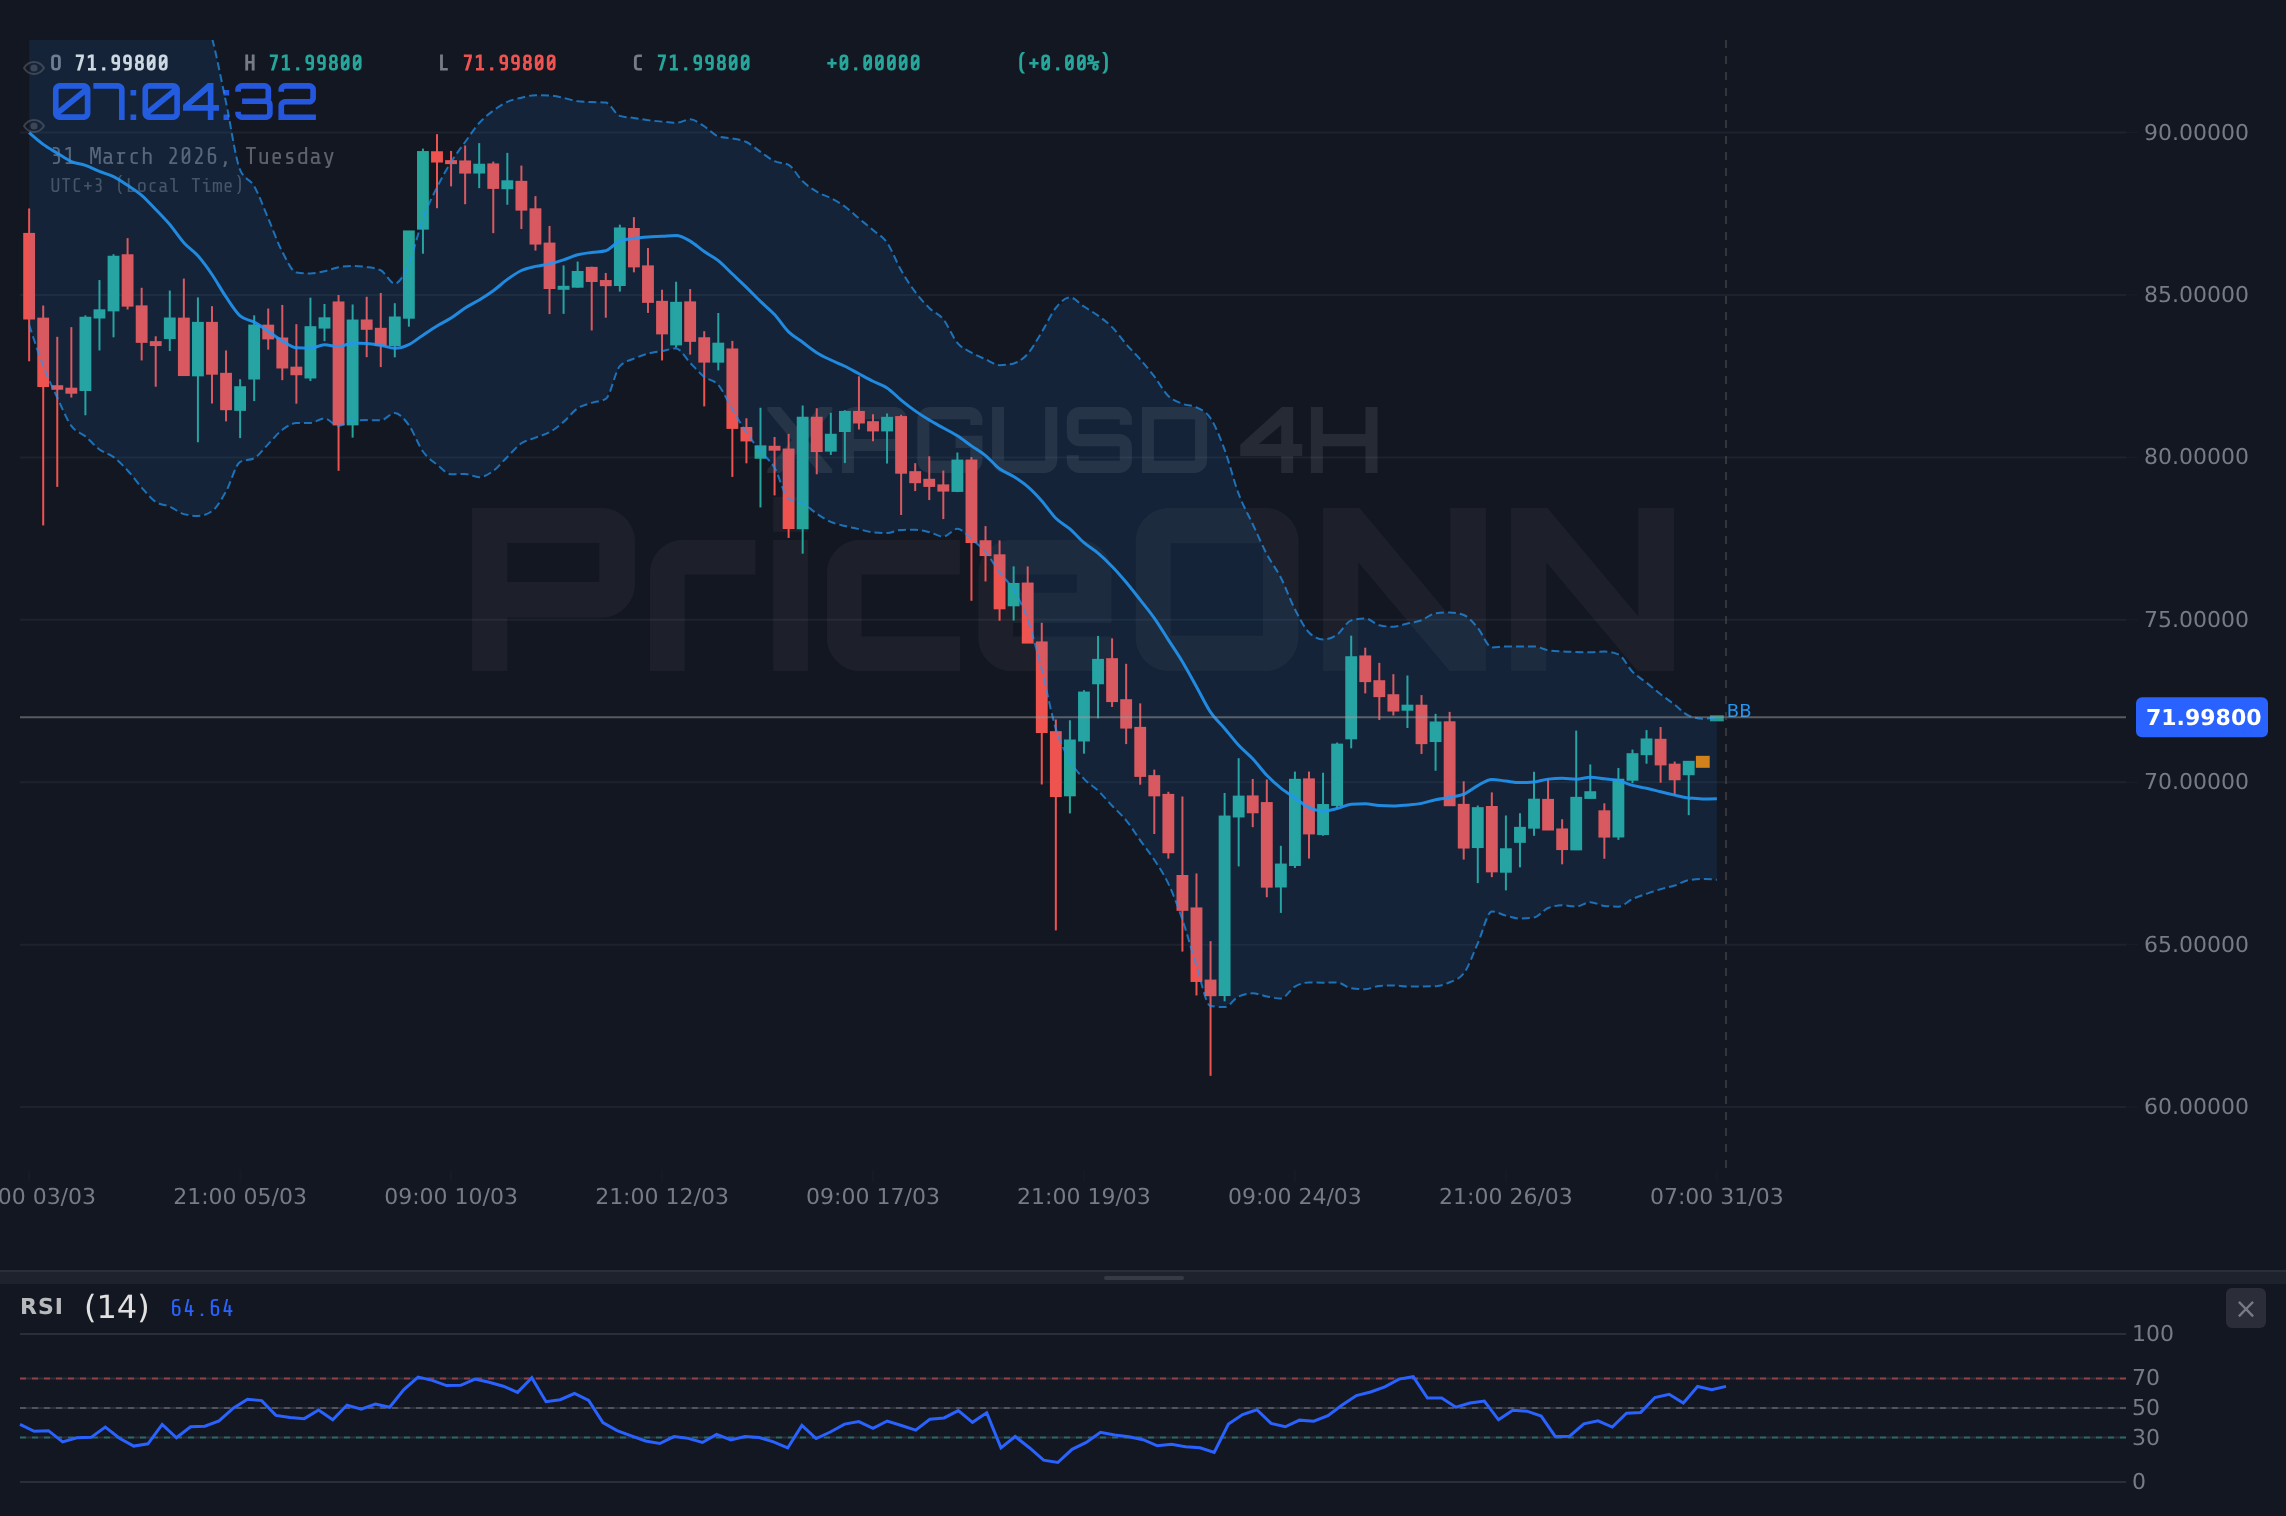
The current market environment for silver presents a fascinating dichotomy. On one hand, the 1-hour and 4-hour technical indicators, such as the RSI and MACD, are flashing predominantly bullish signals, suggesting upward momentum is building. The Stochastic Oscillator on the 1-hour chart, with %K at 73.47 and %D at 48.21, clearly indicates a bullish signal as %K surpasses %D. This aligns with the general 'BUY' signal across these shorter timeframes, painting a picture of immediate upward pressure. However, a deeper dive into the daily timeframe reveals a different narrative. The 1-day RSI at 42.49, MACD below its signal line, and a bearish Bollinger band setup all point towards underlying weakness and a potential reversal. This divergence across timeframes underscores the importance of a nuanced approach, recognizing that while short-term sentiment may favor buyers, the longer-term trend remains uncertain and heavily influenced by external factors.
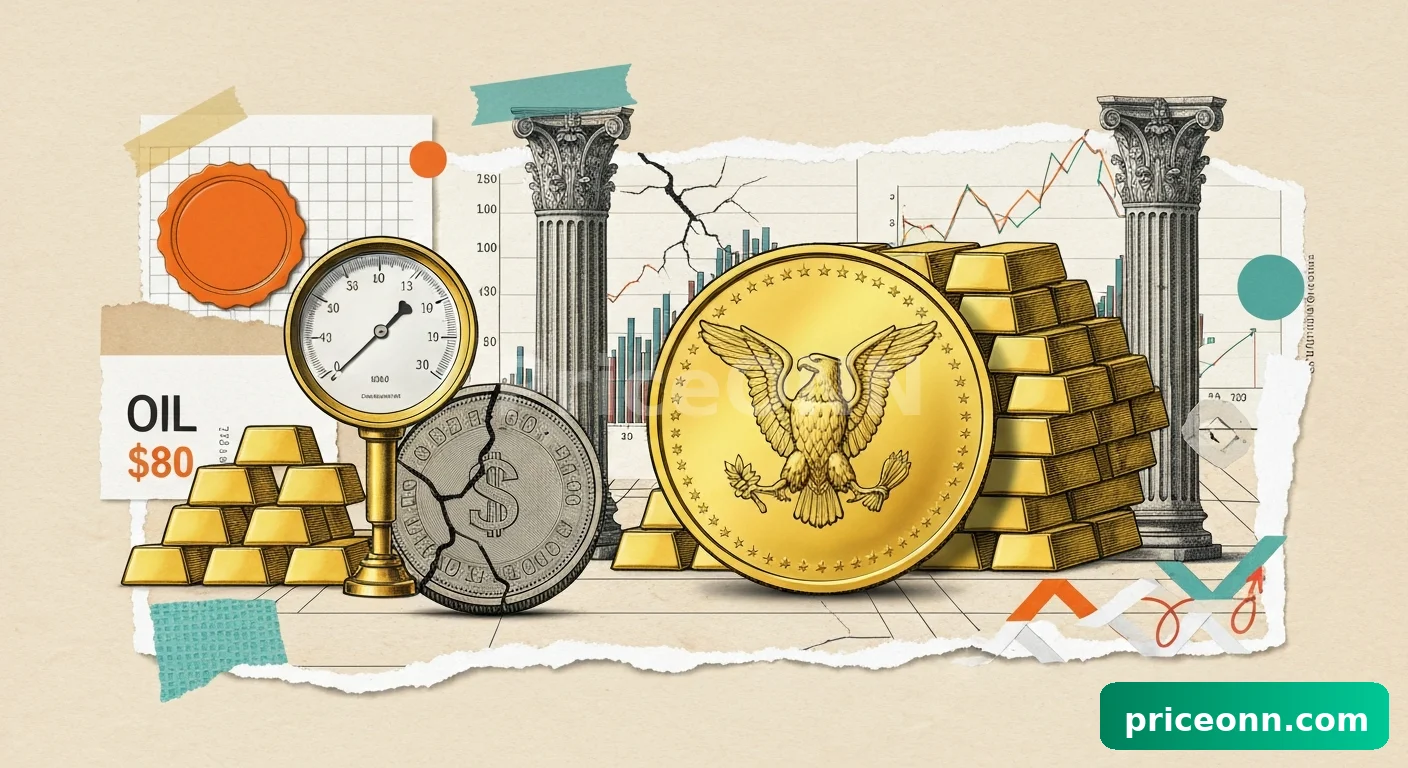
The geopolitical landscape continues to be a significant tailwind for precious metals, and silver is no exception. Escalating tensions in the Middle East, coupled with the ongoing energy crisis in Europe and the resulting inflationary pressures, are bolstering demand for safe-haven assets. The surge in crude oil prices, with WTI reaching $102.69 per barrel, directly fuels inflation concerns, making assets like silver, historically viewed as an inflation hedge, more attractive. While the market digests these developments, the anticipation surrounding Federal Reserve Chair Jerome Powell's upcoming statements adds another layer of complexity. Any hints about the future path of interest rates or the Fed's stance on inflation will be crucial in determining the broader market risk appetite and, consequently, the demand for non-yielding assets like silver. The current price action around $72.04 is therefore not just a technical battleground but a reflection of these powerful macro crosscurrents.
Navigating Technical Crosscurrents: A Multi-Timeframe View
The 1-Hour and 4-Hour Momentum Picture
Examining the shorter timeframes, XAGUSD is exhibiting considerable strength. On the 1-hour chart, the trend is neutrally strong, with a clear 'BUY' signal derived from a confluence of indicators. The RSI at 56.91 is in neutral territory but trending upwards, suggesting buyers are gaining a slight edge. MACD is positive, and Stochastic Oscillator readings are firmly in bullish territory (%K at 69.48, %D at 52.11). The ADX at 21.44 indicates a moderately strong uptrend, reinforcing the bullish sentiment on this timeframe. Similarly, the 4-hour chart shows a predominantly 'BUY' signal, with the RSI at 55.38 and positive MACD momentum. While the 4-hour Stochastic shows a slight caution (%K at 74.8, %D at 75.31, hinting at potential divergence or overbought conditions soon), the overall picture on these shorter frames is one of upward bias. This suggests that intraday traders might find opportunities on the buy-side, provided key support levels hold.
However, it's crucial to interpret these shorter-term signals within the broader context. The ADX on the 4-hour chart is at 17.8, indicating a weaker trend compared to the 1-hour chart. This suggests that while there's immediate upward pressure, the conviction behind the move might be waning, or the market is entering a phase of consolidation before the next significant move. The fact that the 4-hour Stochastic is showing a potential crossover or divergence is a warning sign that the bullish momentum might not be sustainable in the very short term. This is where the concept of a 'WATCH_ZONE' becomes critical; immediate price action might be bullish, but the underlying trend strength is not yet fully confirmed, demanding careful observation of how price reacts to key intraday levels.
The Daily Chart's Cautionary Tale
Diving into the daily chart, the narrative shifts significantly. Here, the overall trend is classified as neutral but with a strong bearish signal. The RSI at 39.83 is firmly in the lower half of the neutral zone, indicating a bearish inclination and suggesting that sellers have more control on a daily basis. The MACD is showing negative momentum, trading below its signal line, which is a classic bearish indicator. Bollinger Bands are positioned below the middle band, further reinforcing the bearish sentiment on the daily timeframe. The ADX at 33.15 signifies a strong downward trend, contradicting the shorter-term bullish signals and highlighting a significant divergence. The Stochastic Oscillator on the daily chart, while showing %K (48.92) above %D (35.73), is in the middle of its range and doesn't provide a strong conviction for an immediate upside reversal. This daily picture paints a starkly different view, suggesting that any short-term rallies might be met with significant selling pressure as the broader trend remains under pressure.
This conflict between short-term bullish signals and long-term bearish indicators is precisely why the current market condition is classified as a 'WATCH_ZONE'. The daily chart's bearish trend implies that any rallies are likely to face selling pressure, potentially from institutional players or longer-term investors who are bearish on silver's prospects in the medium term. The price at $72.04 is currently battling against resistance levels derived from the 1-hour timeframe, such as $72.59 and $73.27. Conversely, immediate support on the 1-hour chart is seen at $71.51, followed by $71.12. A break below these levels on the 1-hour chart could exacerbate the bearish sentiment indicated by the daily timeframe, potentially leading to a retest of the 4-hour support levels around $69.58.
Macroeconomic Headwinds and Fed's Shadow
The Dollar and Yields: A Persistent Correlation
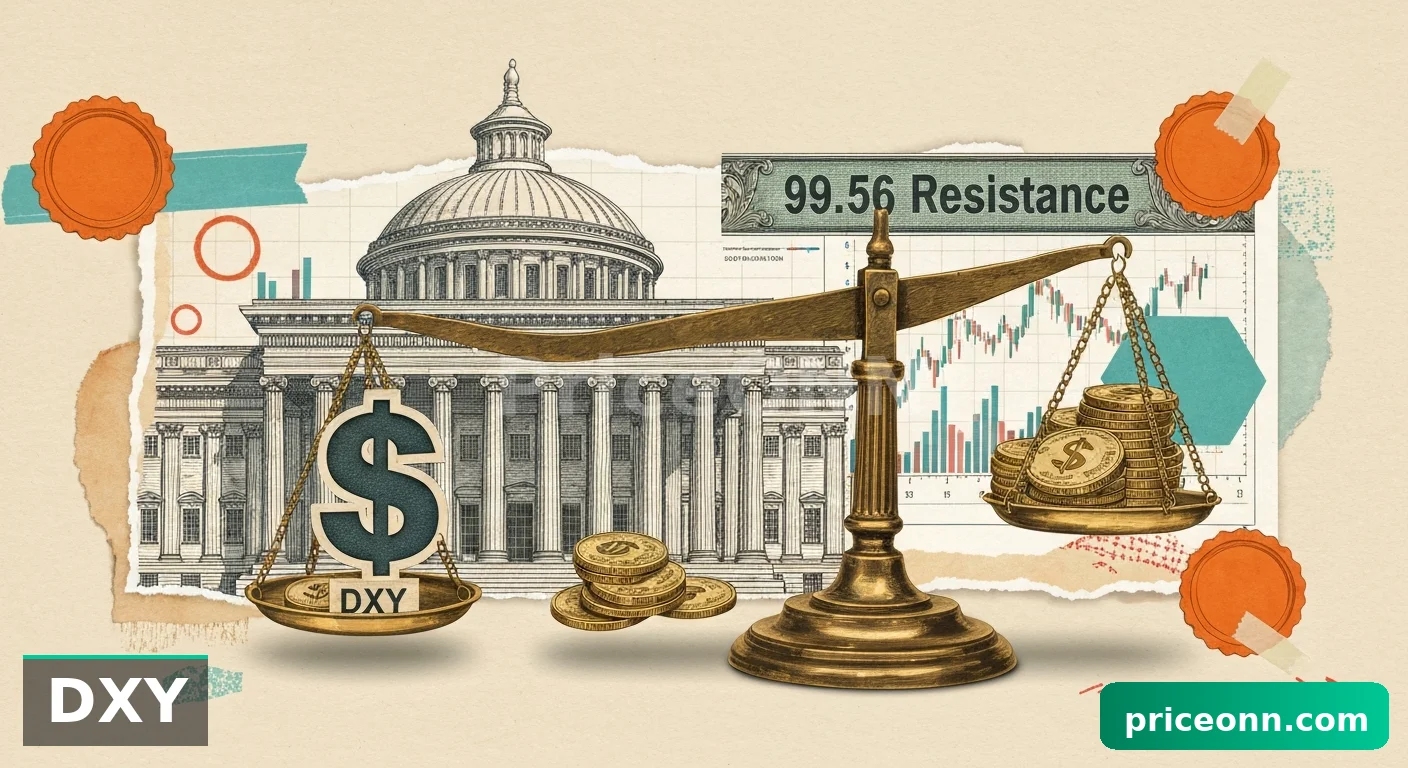
The US Dollar Index (DXY) is currently at 100.25 and showing a strong upward trend on the daily chart, with a significant reading of ADX at 33.32. This strength in the dollar typically exerts downward pressure on dollar-denominated commodities like silver. When the dollar strengthens, it makes silver more expensive for holders of other currencies, potentially dampening demand. Furthermore, the 4-hour DXY chart shows RSI at 72.95, indicating an overbought condition that might precede a minor pullback, but the overall daily trend remains bullish. This suggests that any immediate weakness in the dollar might offer temporary relief to silver, but the prevailing dollar strength remains a significant headwind. The correlation between silver and the dollar is a well-established market dynamic, and as long as the DXY maintains its upward trajectory, it will likely cap any substantial rallies in XAGUSD.
Complementing the dollar's strength, US Treasury yields also play a crucial role. While the provided data does not include specific yield figures, the general inverse relationship between yields and precious metals is paramount. Higher yields increase the opportunity cost of holding non-yielding assets like silver, making interest-bearing assets more attractive by comparison. Conversely, easing yields, as hinted by some market commentary suggesting a pullback, can reduce this opportunity cost, thereby supporting silver prices. The market is keenly awaiting Fed Chair Powell's remarks for any clues on the future trajectory of interest rates. If Powell signals a more hawkish stance, implying higher-for-longer rates, this would likely boost yields and the dollar, putting renewed pressure on silver. A dovish tone, however, could lead to easing yields and a weaker dollar, providing a much-needed catalyst for a silver rally.
Geopolitical Tensions: Fueling Safe-Haven Demand?
The ongoing geopolitical instability, particularly the Middle East conflict and its impact on global energy supplies, is a key factor currently supporting precious metals. The surge in Brent crude to $110.77 and WTI to $103.16, despite recent pullbacks, highlights the persistent inflationary pressures and the 'risk-off' sentiment that often benefits safe-haven assets. This elevated risk environment can increase demand for gold and silver as investors seek to preserve capital. The news that Europe is facing its third energy crisis in four years, exacerbated by geopolitical tensions, further underscores the fragility of the global economic outlook. This persistent uncertainty provides a structural bid for silver, acting as a counterweight to the headwinds from a strong dollar and potentially higher interest rates. The market is effectively caught between the macro-economic tightening narrative and the safe-haven demand driven by geopolitical risks.
The question remains whether this geopolitical-driven demand is sufficient to overcome the macro-economic headwinds. While silver has shown resilience, testing resistance at $72.04, its ability to sustain an upward move hinges on a confluence of factors. A significant escalation in geopolitical events could propel silver higher, potentially breaking through the $73.66 resistance. Conversely, any de-escalation or a more hawkish tone from the Fed could quickly reverse the trend, pushing silver back towards its support levels. The current ADX reading of 29.25 on the daily chart suggests a strong downtrend is in play, which implies that rallies might be short-lived unless major catalysts emerge to shift the fundamental narrative decisively.
The Trade Plan: Navigating the WATCH_ZONE
Given the conflicting signals across different timeframes and the significant macro-economic and geopolitical uncertainties, the current setup for XAGUSD falls squarely into a 'WATCH_ZONE' classification. A decisive trade recommendation is premature without clearer confirmation. The key level to watch will be the $72.04 price point itself, acting as immediate resistance on the 1-hour chart. A sustained break above this level, particularly on the 4-hour or daily charts, would be the first sign that short-term bullish momentum could be gaining traction against the prevailing daily downtrend. Confirmation would require not just a price breach but also a corresponding shift in broader market sentiment, perhaps indicated by a weakening DXY or easing yields.
Conversely, failure to overcome the $72.04 resistance, especially if accompanied by a break below the 1-hour support at $71.51, would reinforce the bearish outlook suggested by the daily chart. Such a move could signal a 'stop hunt' or a liquidity grab before a more significant decline. The critical support levels to monitor on the 4-hour timeframe are $69.58 and $69.06. A decisive close below these levels on the 4-hour chart would strongly suggest that the bearish trend is resuming, potentially targeting lower support levels on the daily chart, such as $67.92. For now, patience is paramount. Traders should be looking for a clear break of either the immediate resistance or support levels, supported by confirmation from broader market dynamics, before committing to a directional trade.
The current divergence between the short-term bullish technical signals and the longer-term bearish trend on the daily chart, coupled with macro uncertainties, creates a high-risk trading environment. A clear breakout above the $73.66 daily resistance, sustained by positive geopolitical news or a dovish Fed pivot, could signal a significant trend change. However, until then, the risk of a reversal from current levels near $72.04 remains elevated.
Bearish Scenario: Rejection at Resistance
65% ProbabilityNeutral Scenario: Consolidation Near Resistance
25% ProbabilityBullish Scenario: Breakout Above Resistance
10% ProbabilityFrequently Asked Questions: XAGUSD Analysis
What happens if XAGUSD fails to break above the $72.04 resistance level?
If XAGUSD fails to decisively break and hold above the $72.04 resistance, particularly with a close below the $71.51 support on the 1-hour chart, it would likely reinforce the bearish sentiment indicated by the daily timeframe. This scenario could lead to a retest of lower support levels, such as $69.58.
Should I buy XAGUSD at current levels near $72.04 given the mixed technical signals?
Buying at current levels near $72.04 is not recommended due to the conflicting signals and the 'WATCH_ZONE' classification. A high-probability setup would require a clear break above daily resistance ($73.66) for a bullish case, or a breakdown below 4-hour support ($69.58) for a bearish case, accompanied by confirming macro catalysts.
Is the RSI at 61.18 on the 1-hour chart a buy signal for XAGUSD?
An RSI of 61.18 on the 1-hour chart indicates upward momentum but is not in extreme overbought territory. While it supports the short-term bullish bias, it must be considered alongside the bearish RSI of 42.49 on the daily chart. Confirmation of a sustained uptrend would require the daily RSI to also move above 50.
How will Fed Chair Powell's upcoming remarks affect XAGUSD this week?
Fed Chair Powell's remarks are critical. A hawkish tone suggesting higher interest rates could strengthen the dollar and yields, pressuring XAGUSD lower towards $69.58. Conversely, a dovish tone could ease yields, weaken the dollar, and potentially propel XAGUSD towards the $73.66 resistance level.
The path forward for silver is clouded by uncertainty, a common theme when conflicting technical signals align with significant macro-economic and geopolitical crosscurrents. While short-term charts suggest potential upside, the daily timeframe paints a more cautious picture, hinting at underlying weakness. The critical resistance at $72.04 and support at $71.51 on the 1-hour chart will be key battlegrounds in the immediate future. Traders must remain vigilant, awaiting a clearer signal from the market or a decisive shift in the macro narrative. Patience and disciplined risk management will be the most valuable tools in navigating this complex environment, ensuring that any trades taken are based on confirmed setups rather than speculation.
Track markets in real-time
AI-powered analysis, technical indicators and real-time price data.
Join Our Telegram Channel
Breaking market news, AI analysis and trading signals instantly.
Join Channel