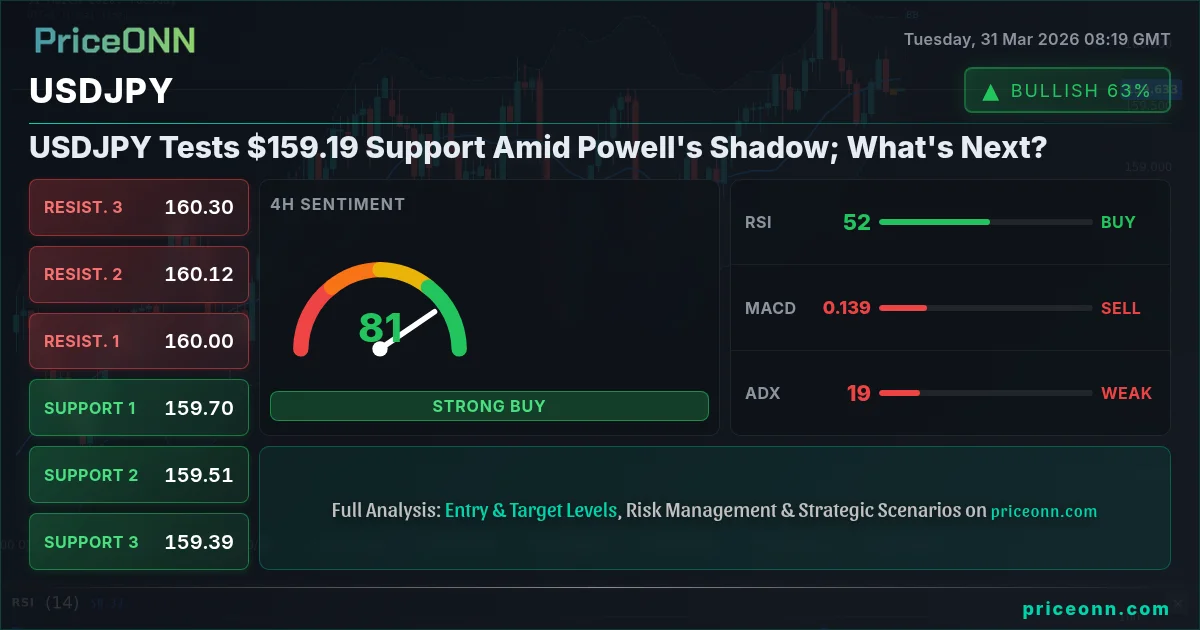
USDJPY Tests $159.19 Support Amid Powell's Shadow; What's Next?
USDJPY hovers near $159.19 support as traders await Fed Chair Powell's speech. Technicals show mixed signals, with ADX at 18.61 indicating range-bound conditions.
The intense focus on Federal Reserve Chair Jerome Powell's upcoming remarks casts a significant shadow over USDJPY's current trajectory, leaving the pair teetering precariously near the critical $159.19 support level. With the Dollar Index (DXY) showing strength and oil prices above $100, inflationary pressures remain a key concern for policymakers, directly influencing the Bank of Japan's stance and market expectations for intervention. This delicate balance between potential Fed hawkishness and the yen's safe-haven appeal creates a complex trading environment, demanding close attention to both macro drivers and nuanced technical signals.
- USDJPY hovers near $159.19 support, with the 1H chart showing potential for a bounce towards $159.80.
- Critical support sits at $159.19, tested multiple times; a close below this level on the daily chart would be a significant bearish signal.
- ADX at 18.61 on the 4H timeframe indicates a weak trend, suggesting a ranging market rather than a committed breakout.
- Fed Chair Powell's speech is the primary macro driver, with traders watching for any hints on future monetary policy that could impact the USDJPY correlation.
The Macro Tightrope: Powell, Inflation, and the Yen's Fate
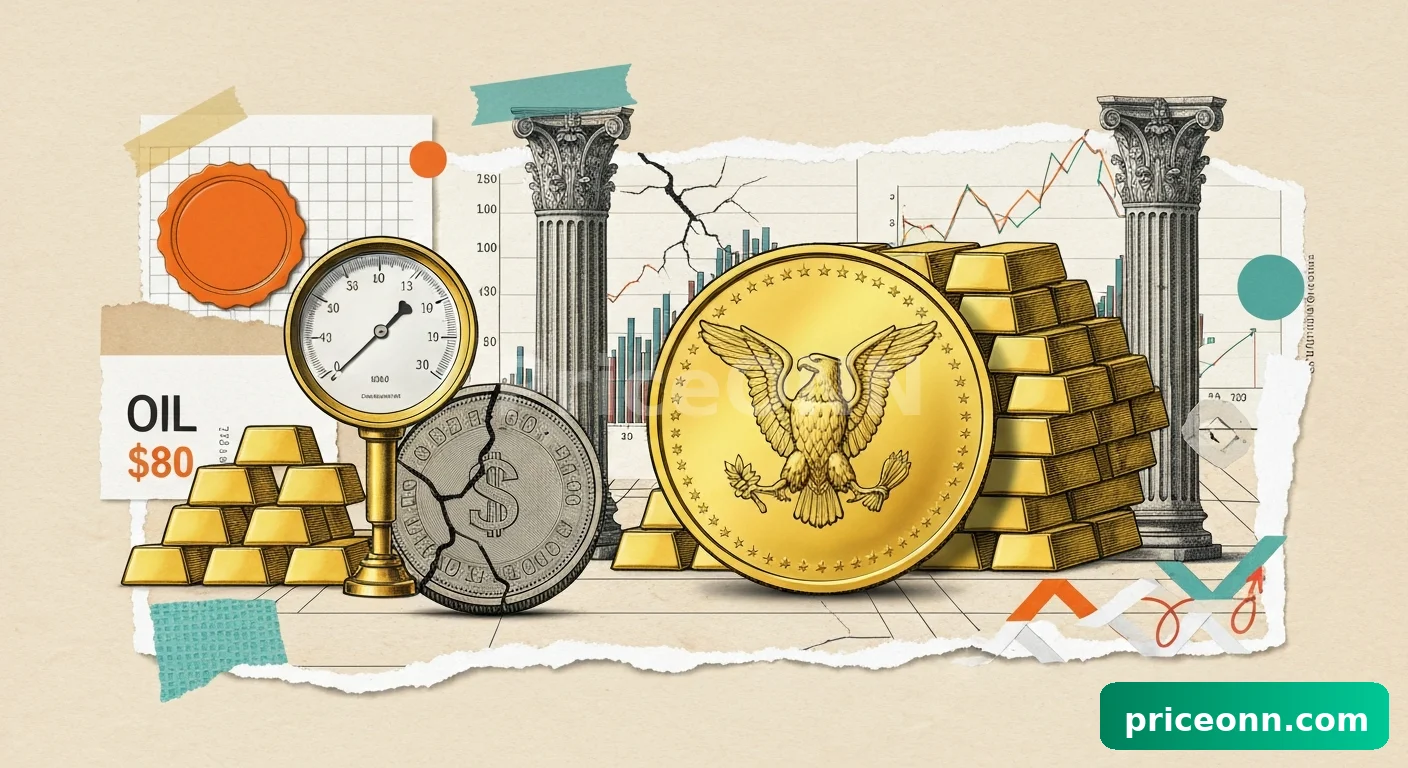
The global financial stage is set for a pivotal moment as Federal Reserve Chair Jerome Powell prepares to address the market. His words carry immense weight, particularly in the current climate of persistent inflationary pressures and elevated oil prices exceeding $100 a barrel. This backdrop intensifies scrutiny on the Fed's monetary policy path. Should Powell signal a more hawkish stance, perhaps hinting at prolonged higher interest rates or even further tightening, the US Dollar could see a significant boost. This would naturally exert downward pressure on USDJPY, potentially driving it towards or even below the $159.19 support level we are watching closely. The market's interpretation of Powell's tone - whether leaning towards inflation control or economic growth concerns - will be the primary catalyst in the short term.
Conversely, any hint of dovishness, or a more measured approach acknowledging economic slowdown risks, could lead to a dollar pullback. This would offer some respite to USDJPY, potentially allowing it to consolidate or even retrace higher levels. The Bank of Japan, meanwhile, is caught in a difficult position. With the yen weakening significantly against the dollar, the specter of direct intervention to support the currency looms. However, the BoJ has been cautious, balancing the need to control inflation with the desire to avoid stifling economic recovery. This duality means that while a stronger dollar might push USDJPY higher, any significant intervention or shift in BoJ policy could rapidly alter the pair's direction.
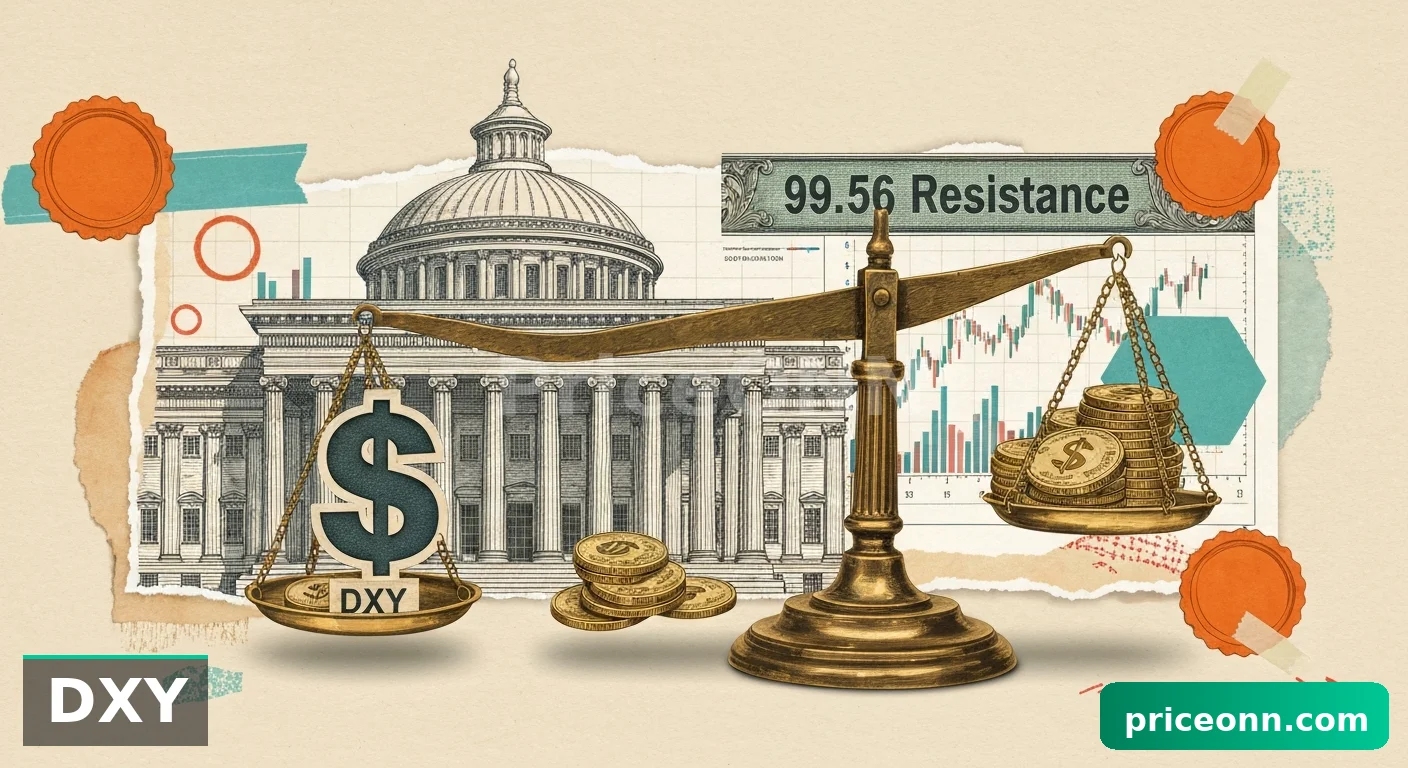
The correlation between USDJPY and the Dollar Index (DXY) is a crucial element to monitor. As the DXY currently trades around 100.29, showing a firm upward trend on the daily chart with an ADX of 33.32, it suggests that dollar strength is a prevailing theme. This strength typically translates into higher USDJPY levels. However, the short-term technical signals on USDJPY present a more nuanced picture. While the daily chart leans towards a bullish trend, the 1-hour and 4-hour timeframes show conflicting signals, particularly around momentum indicators and the ADX, which hovers around 18.61 on the 4H chart. This suggests that despite the underlying dollar strength, the immediate path for USDJPY might be one of consolidation or a potential short-term pullback towards support.
Decoding the Technical Tapestry: USDJPY's Short-Term Battleground
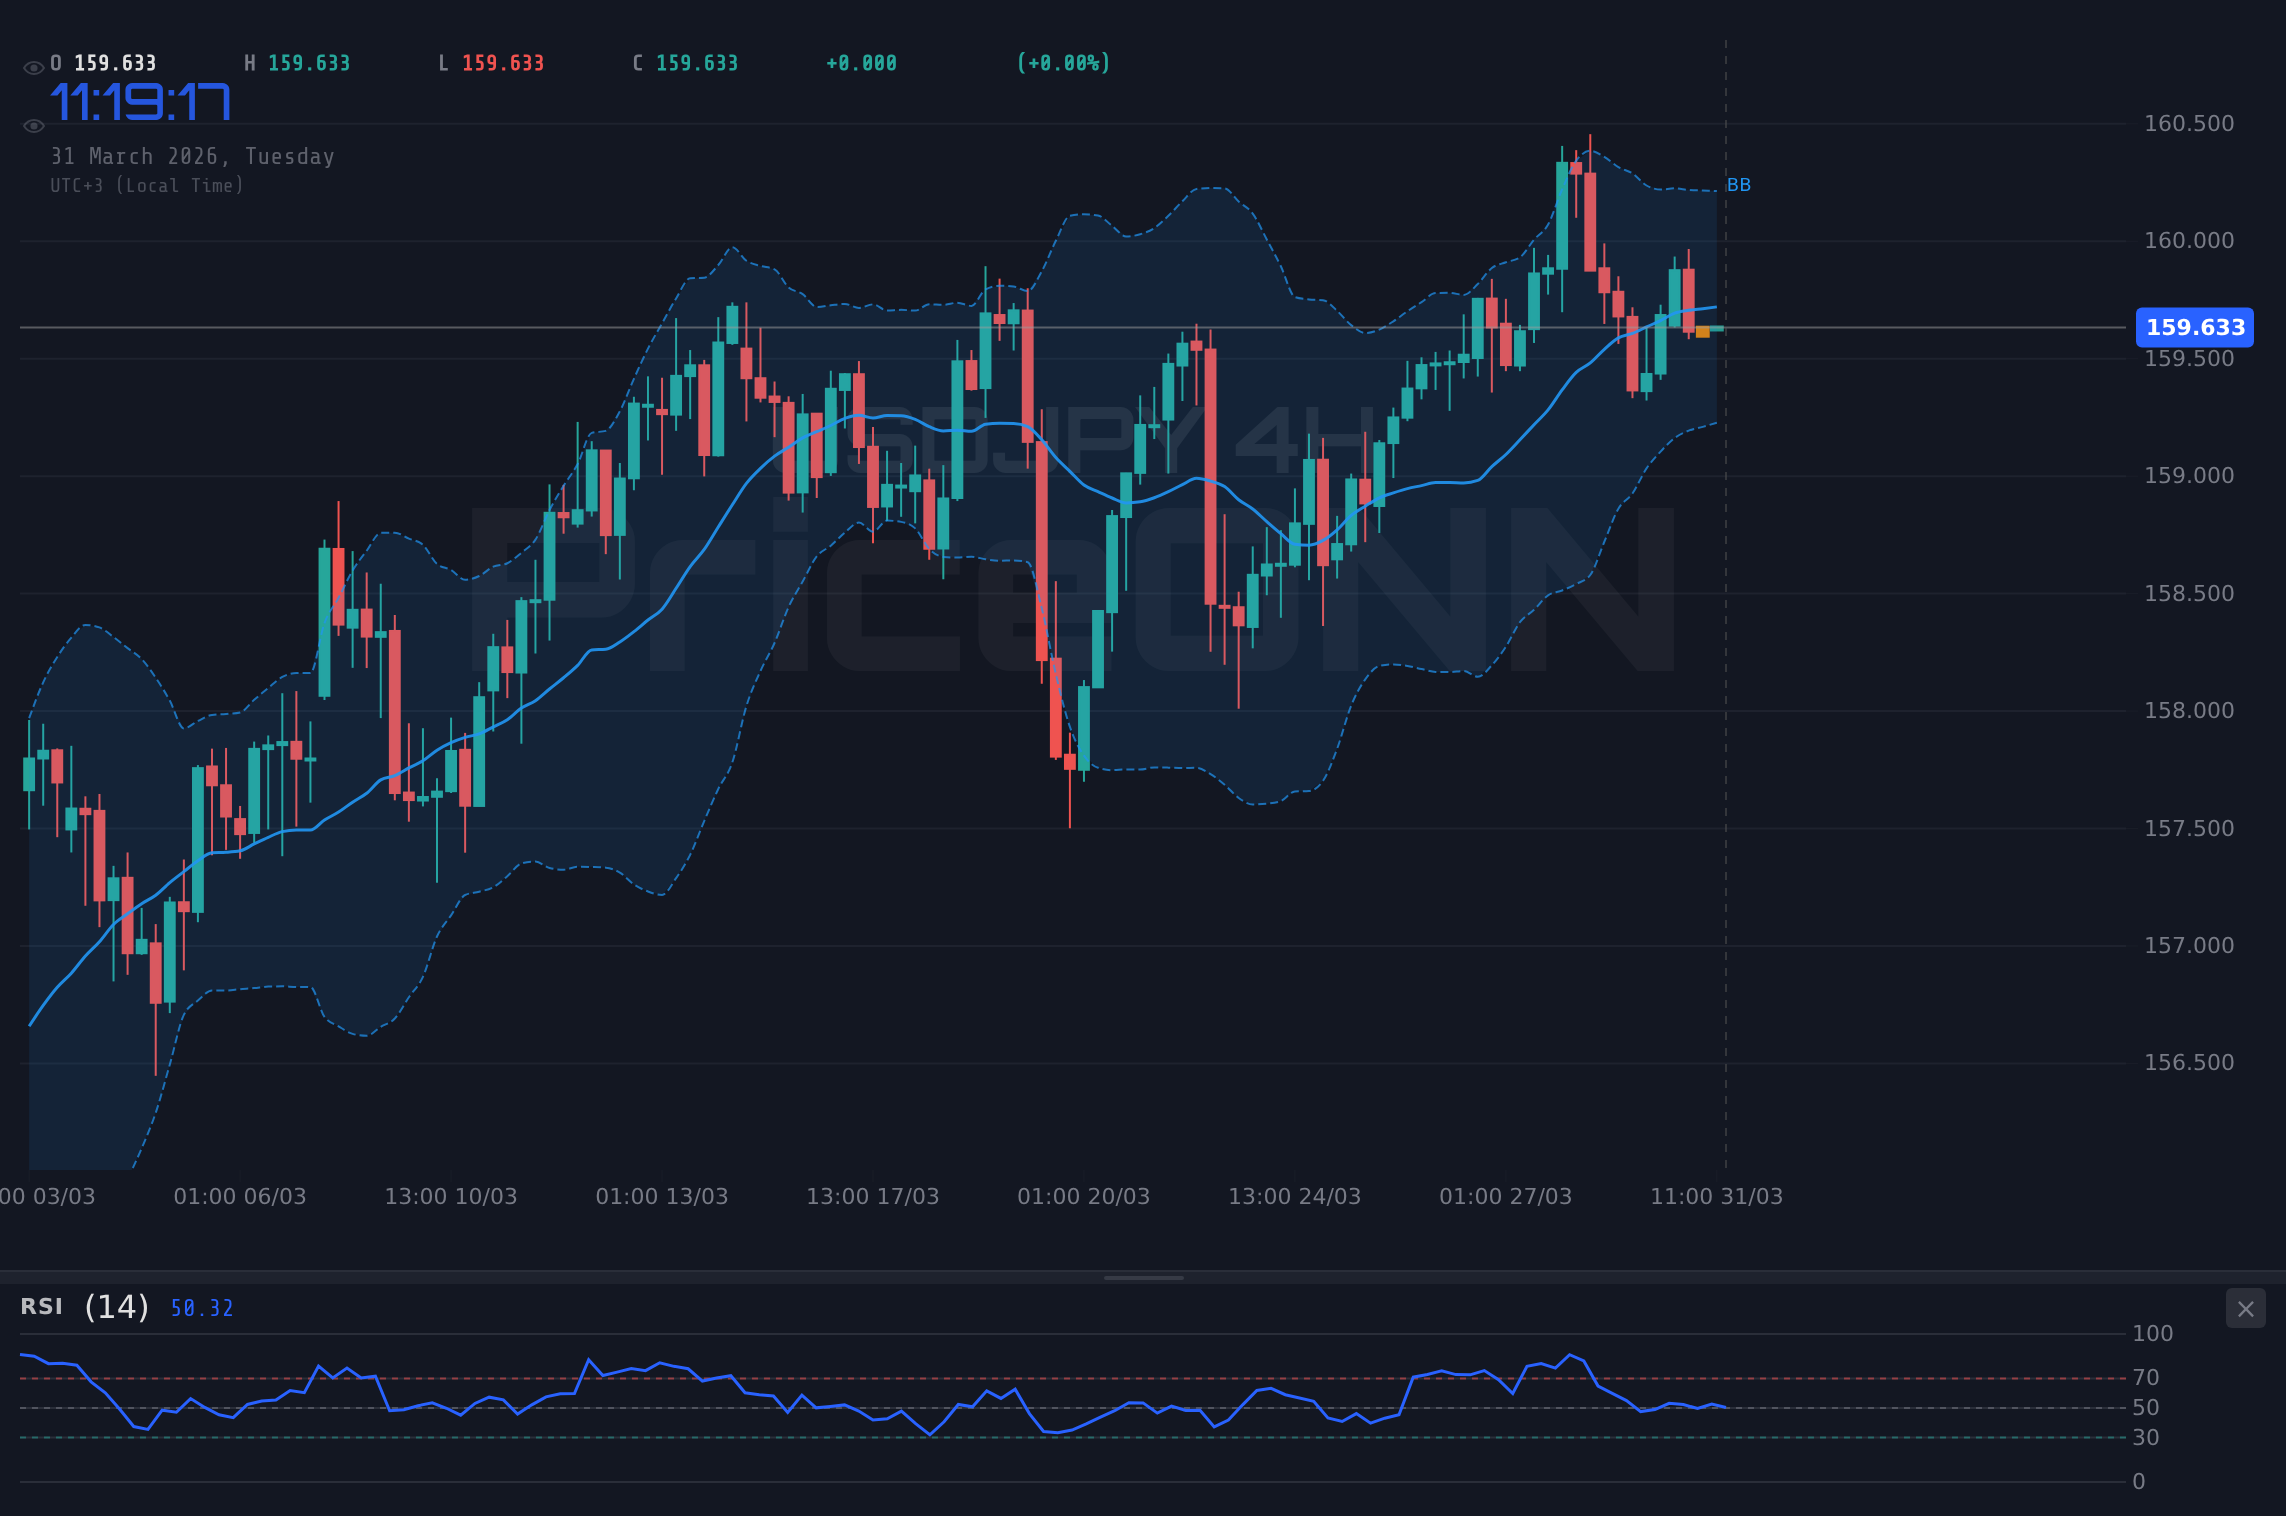
Turning our attention to the technical charts, USDJPY presents a fascinating case study in multi-timeframe analysis. On the 1-hour chart, the trend is classified as neutral with a power of 50%, and the MACD shows positive momentum with the MACD line above the signal line. The Stochastic oscillator, however, offers a slight bearish signal with K at 36.26 and D at 35.68, suggesting a potential dip. The RSI(14) sits at 47.21, in neutral territory but with a downward inclination, indicating some loss of upward momentum. Bollinger Bands are above the middle band, hinting at an upward bias, but the overall picture is mixed, pointing towards consolidation rather than a clear directional move.
The 4-hour timeframe paints a similar, albeit slightly more bearish, picture. The trend is still neutral (50% power), but the MACD exhibits negative momentum, with the MACD line below the signal line. The Stochastic shows a K value of 36.38 and D value of 25.28, still suggesting a potential rise from oversold conditions, while the RSI is at 52.06, leaning neutral. Crucially, the ADX on this timeframe is 18.61, a reading that signifies a weak trend. This is a key takeaway; it implies that the current market environment is more range-bound or choppy, making decisive breakouts less likely without a significant catalyst. This aligns with the 'NO_TRADE' decision based on the ADX, as it suggests elevated risk in attempting to trade against the prevailing indecision.
However, the daily chart provides a longer-term perspective that cannot be ignored. Here, USDJPY is showing a clear bullish trend with a power of 87%. The MACD is positive, and the Stochastic oscillator is in overbought territory with K at 80.7 and D at 72.04, indicating strong upward momentum. The RSI(14) is at 58.59, comfortably in neutral territory and trending upwards, supporting the bullish outlook. The ADX at 23.89 suggests a moderately strong trend is in place. This divergence between the short-term indecision and the longer-term bullish trend highlights the importance of Powell's upcoming speech. It could be the catalyst needed to break the short-term consolidation and align all timeframes with the daily bullish bias, or it could trigger a reversal, invalidating the longer-term trend and sending USDJPY back towards the $159.19 support.
The ADX reading of 18.61 on the 4H chart is a critical indicator of market indecision, suggesting that current price action is likely to remain range-bound until a significant catalyst emerges, such as Fed Chair Powell's comments.
Navigating the Scenarios: Bullish, Bearish, and the Neutral Ground
Given the conflicting signals across timeframes and the overarching uncertainty surrounding Fed policy, it's prudent to map out potential scenarios for USDJPY. The current technical setup, particularly the neutral to slightly bearish short-term signals against a longer-term bullish trend, suggests a high probability of continued choppiness. The $159.19 support level is a key demarcation. A sustained hold above this level, especially if confirmed by a bullish reaction to Powell's speech, could pave the way for a move back towards the $160.32 resistance. The 1-hour chart, with its positive MACD momentum, offers a potential immediate target around $159.80, aligning with the middle Bollinger Band. However, this bullish scenario hinges on confirmation from the daily chart's strength and a lack of dovish surprises from the Fed.
Bullish Scenario: Powell's Nod to Stability
45% ProbabilityOn the flip side, a bearish scenario would likely be triggered by a more dovish-than-expected tone from Powell, or persistent inflation fears that prompt aggressive Fed action, leading to dollar strength that eventually overwhelms the yen's support. A break below the $159.19 support level, particularly on the daily chart, would be a significant bearish signal, potentially opening the door for a move towards the $158.68 support. The short-term technicals, with negative MACD momentum on the 4H chart, could accelerate such a move if the $159.19 level fails to hold as a firm floor. Traders would look for confirmation through increased selling volume and a breakdown of short-term trendlines.
Bearish Scenario: Dovish Powell or Intervention Fears
35% ProbabilityThe most probable outcome in the immediate aftermath of Powell's speech, given the current ADX readings and mixed signals, might be a period of consolidation. This neutral scenario suggests that neither the bulls nor the bears can gain a decisive upper hand without further confirmation. Price could remain range-bound between the $159.19 support and the $159.80-$160.32 resistance area. This would allow the market to digest the Fed's commentary and wait for upcoming economic data, such as employment figures or inflation reports, to provide a clearer directional impetus. In such a case, scalping opportunities within the range might arise, but larger directional trades would likely be on hold.
Neutral Scenario: Consolidation Amid Uncertainty
20% ProbabilityThe Interplay of Global Factors: DXY, Oil, and Risk Appetite
The strength of the US Dollar, as indicated by the DXY trading around 100.29, is a significant tailwind for USDJPY. The DXY's daily chart shows a robust upward trend, supported by an ADX of 33.32, suggesting that dollar bulls are firmly in control on the longer timeframe. This strength is often fueled by expectations of tighter monetary policy from the Federal Reserve or by global risk aversion, which drives capital towards the perceived safety of the US dollar. The current geopolitical landscape, marked by ongoing conflicts and elevated oil prices, contributes to this risk-off sentiment, further bolstering the dollar's appeal.
Brent crude oil trading above $110 a barrel is a stark reminder of the inflationary pressures that central banks are grappling with. This high oil price environment has a dual effect: it increases inflation expectations, potentially forcing the Fed to maintain a hawkish stance, which supports the dollar. However, it also dampens global growth prospects, which could, in theory, lead to a flight to safety that benefits currencies like the yen. This is where the complexity lies; the dollar's safe-haven status often trumps the yen's in times of heightened global stress, especially when the Fed's policy path is perceived as more aggressive than other central banks. The correlation between USDJPY and oil prices is therefore not always straightforward, but the inflationary component currently favors dollar strength.
Furthermore, the performance of major US indices like the S&P 500 and Nasdaq 100 provides context for risk appetite. The S&P 500, currently showing a strong daily bullish trend (ADX 50.27), suggests that despite inflationary concerns, equity markets are showing resilience, or perhaps are being supported by other factors. However, the 4-hour chart for the S&P 500 indicates a bearish trend with an ADX of 28.61, hinting at potential short-term weakness. If risk appetite were to significantly decline, leading to a selloff in US equities, we might see increased demand for safe-haven assets, including the Japanese yen, which could put downward pressure on USDJPY, irrespective of dollar strength. This interplay between inflation, Fed policy, oil prices, and equity market sentiment creates a dynamic environment that requires constant monitoring.
With the DXY at 100.29 and showing a strong daily trend, USDJPY is likely to remain sensitive to dollar strength. However, a sharp decline in the S&P 500 (currently showing a bearish 4H trend) could introduce safe-haven flows favoring JPY.
The Road Ahead: Watching Key Levels and Powell's Words
As we look towards the immediate future, the $159.19 support level on USDJPY remains the focal point. A failure to hold this level could trigger a cascade of selling, accelerating towards $158.68 and potentially $158.05. The daily chart's ADX at 33.15, while indicating a strong downward trend on that specific timeframe for XAUUSD, is not directly applicable to USDJPY but highlights that strong trends do exist in the market. For USDJPY, the daily ADX of 23.89 suggests a moderately strong bullish trend, which is being challenged by short-term weakness.
Conversely, a successful defense of $159.19, coupled with a neutral-to-hawkish interpretation of Powell's speech, could see USDJPY re-test resistance levels. The immediate target would be $159.80, followed by the more significant daily resistance at $160.32. The interplay of short-term indicators, particularly the conflicting Stochastic and RSI signals on different timeframes, suggests that any move higher might face immediate headwinds and potential profit-taking. The market is clearly waiting for a definitive signal, and Powell's address is poised to be that signal.
Traders should remain vigilant, focusing on price action around the key $159.19 and $160.32 levels. The outcome of Powell's speech will likely dictate the short-to-medium term direction. If the Fed signals continued resolve against inflation, the dollar could strengthen, pushing USDJPY higher and potentially invalidating the bearish short-term signals. If, however, concerns about economic growth dominate, or if the BoJ signals a more interventionist stance, we could see a reversal. Patience and risk management are paramount in navigating this period of heightened uncertainty. The market is ripe for a move, but the direction will be heavily influenced by the words spoken in the coming hours.
Frequently Asked Questions: USDJPY Analysis
What happens if USDJPY breaks below the $159.19 support level after Powell's speech?
A decisive break below $159.19, especially on the daily chart, would signal a bearish reversal. This could trigger further selling towards the $158.68 support level, potentially accelerating if the market perceives the Fed's stance as more dovish than expected, or if intervention fears surrounding the yen subside.
Should I trade USDJPY at current levels of $159.64 given the mixed short-term signals and upcoming Fed speech?
Trading at current levels is high-risk due to the conflicting signals and uncertainty surrounding Powell's speech. The ADX of 18.61 suggests a ranging market. A patient approach, waiting for a clear break of $159.19 support or a confirmed move above $159.80 resistance post-speech, offers a better risk/reward setup.
Is the RSI at 47.21 on the 1H chart a sell signal for USDJPY right now?
An RSI of 47.21 is in neutral territory but trending downwards, suggesting some loss of bullish momentum on the 1-hour chart. It's not a strong sell signal on its own but contributes to the overall picture of short-term indecision, reinforcing the need for confirmation from other indicators or price action.
How will Fed Chair Powell's speech affect USDJPY this week, given the DXY strength around 100.29?
If Powell adopts a hawkish tone, it could further strengthen the DXY, pushing USDJPY higher towards $160.32. Conversely, a dovish tone might weaken the dollar, potentially causing USDJPY to fall towards $159.19 support, despite the current DXY strength.
| Indicator | Value | Signal | Interpretation |
|---|---|---|---|
| RSI (14) | 47.21 | Neutral | 47.21 on 1H chart, downward inclination. |
| MACD | - | Bullish Momentum | Positive momentum on 1H, negative on 4H. |
| Stochastic | K: 36.26, D: 35.68 | Bearish Signal | Suggests potential dip on 1H chart. |
| ADX | 18.61 | Weak Trend | Indicates range-bound/choppy market on 4H. |
| Bollinger Bands | Middle Band | Watch | Price hovering around middle band on 1H, below on 4H. |
Track markets in real-time
AI-powered analysis, technical indicators and real-time price data.
Join Our Telegram Channel
Breaking market news, AI analysis and trading signals instantly.
Join Channel