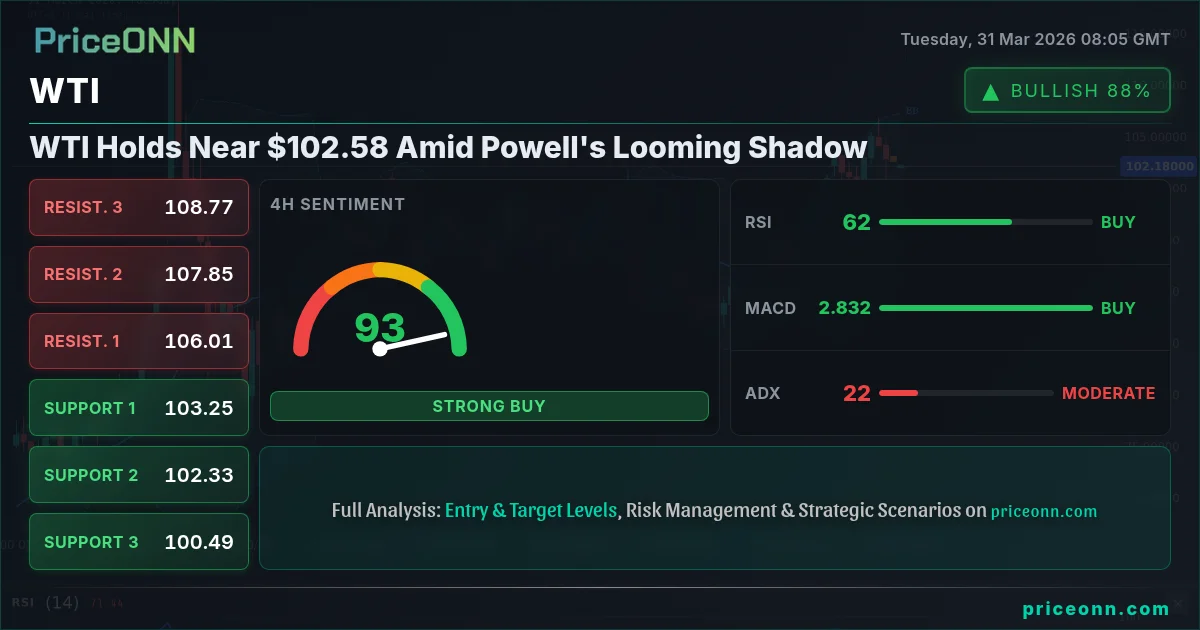
WTI Holds Near $102.58 Amid Powell's Looming Shadow
WTI crude oil hovers around $102.58 as traders await Fed Chair Powell's speech. Technical indicators show a neutral stance with key support at $102.22 and resistance at $103.11.
The global oil market is holding its breath as WTI crude oil hovers precariously near the $102.58 mark. This delicate equilibrium is largely dictated by anticipation surrounding Federal Reserve Chair Jerome Powell's upcoming address, which is expected to provide crucial insights into the future trajectory of U.S. monetary policy. In a market already sensitive to geopolitical tensions and shifting supply-demand dynamics, Powell's words could be the catalyst that propels WTI decisively in either direction. Traders are meticulously dissecting every nuance of the current technical landscape, seeking confirmation for potential moves, while keeping a keen eye on the macroeconomic undercurrents shaping the broader financial environment.
- WTI crude oil is trading around $102.58, with key support at $102.22 and resistance at $103.11.
- The ADX at 22.01 indicates a moderate trend, while RSI at 50.8 suggests a neutral stance with a slight upward inclination.
- Traders are awaiting Fed Chair Powell's speech for monetary policy direction, which could significantly impact WTI's correlation with the DXY.
- Geopolitical risks in the Middle East continue to underpin oil prices, despite concerns over global growth.
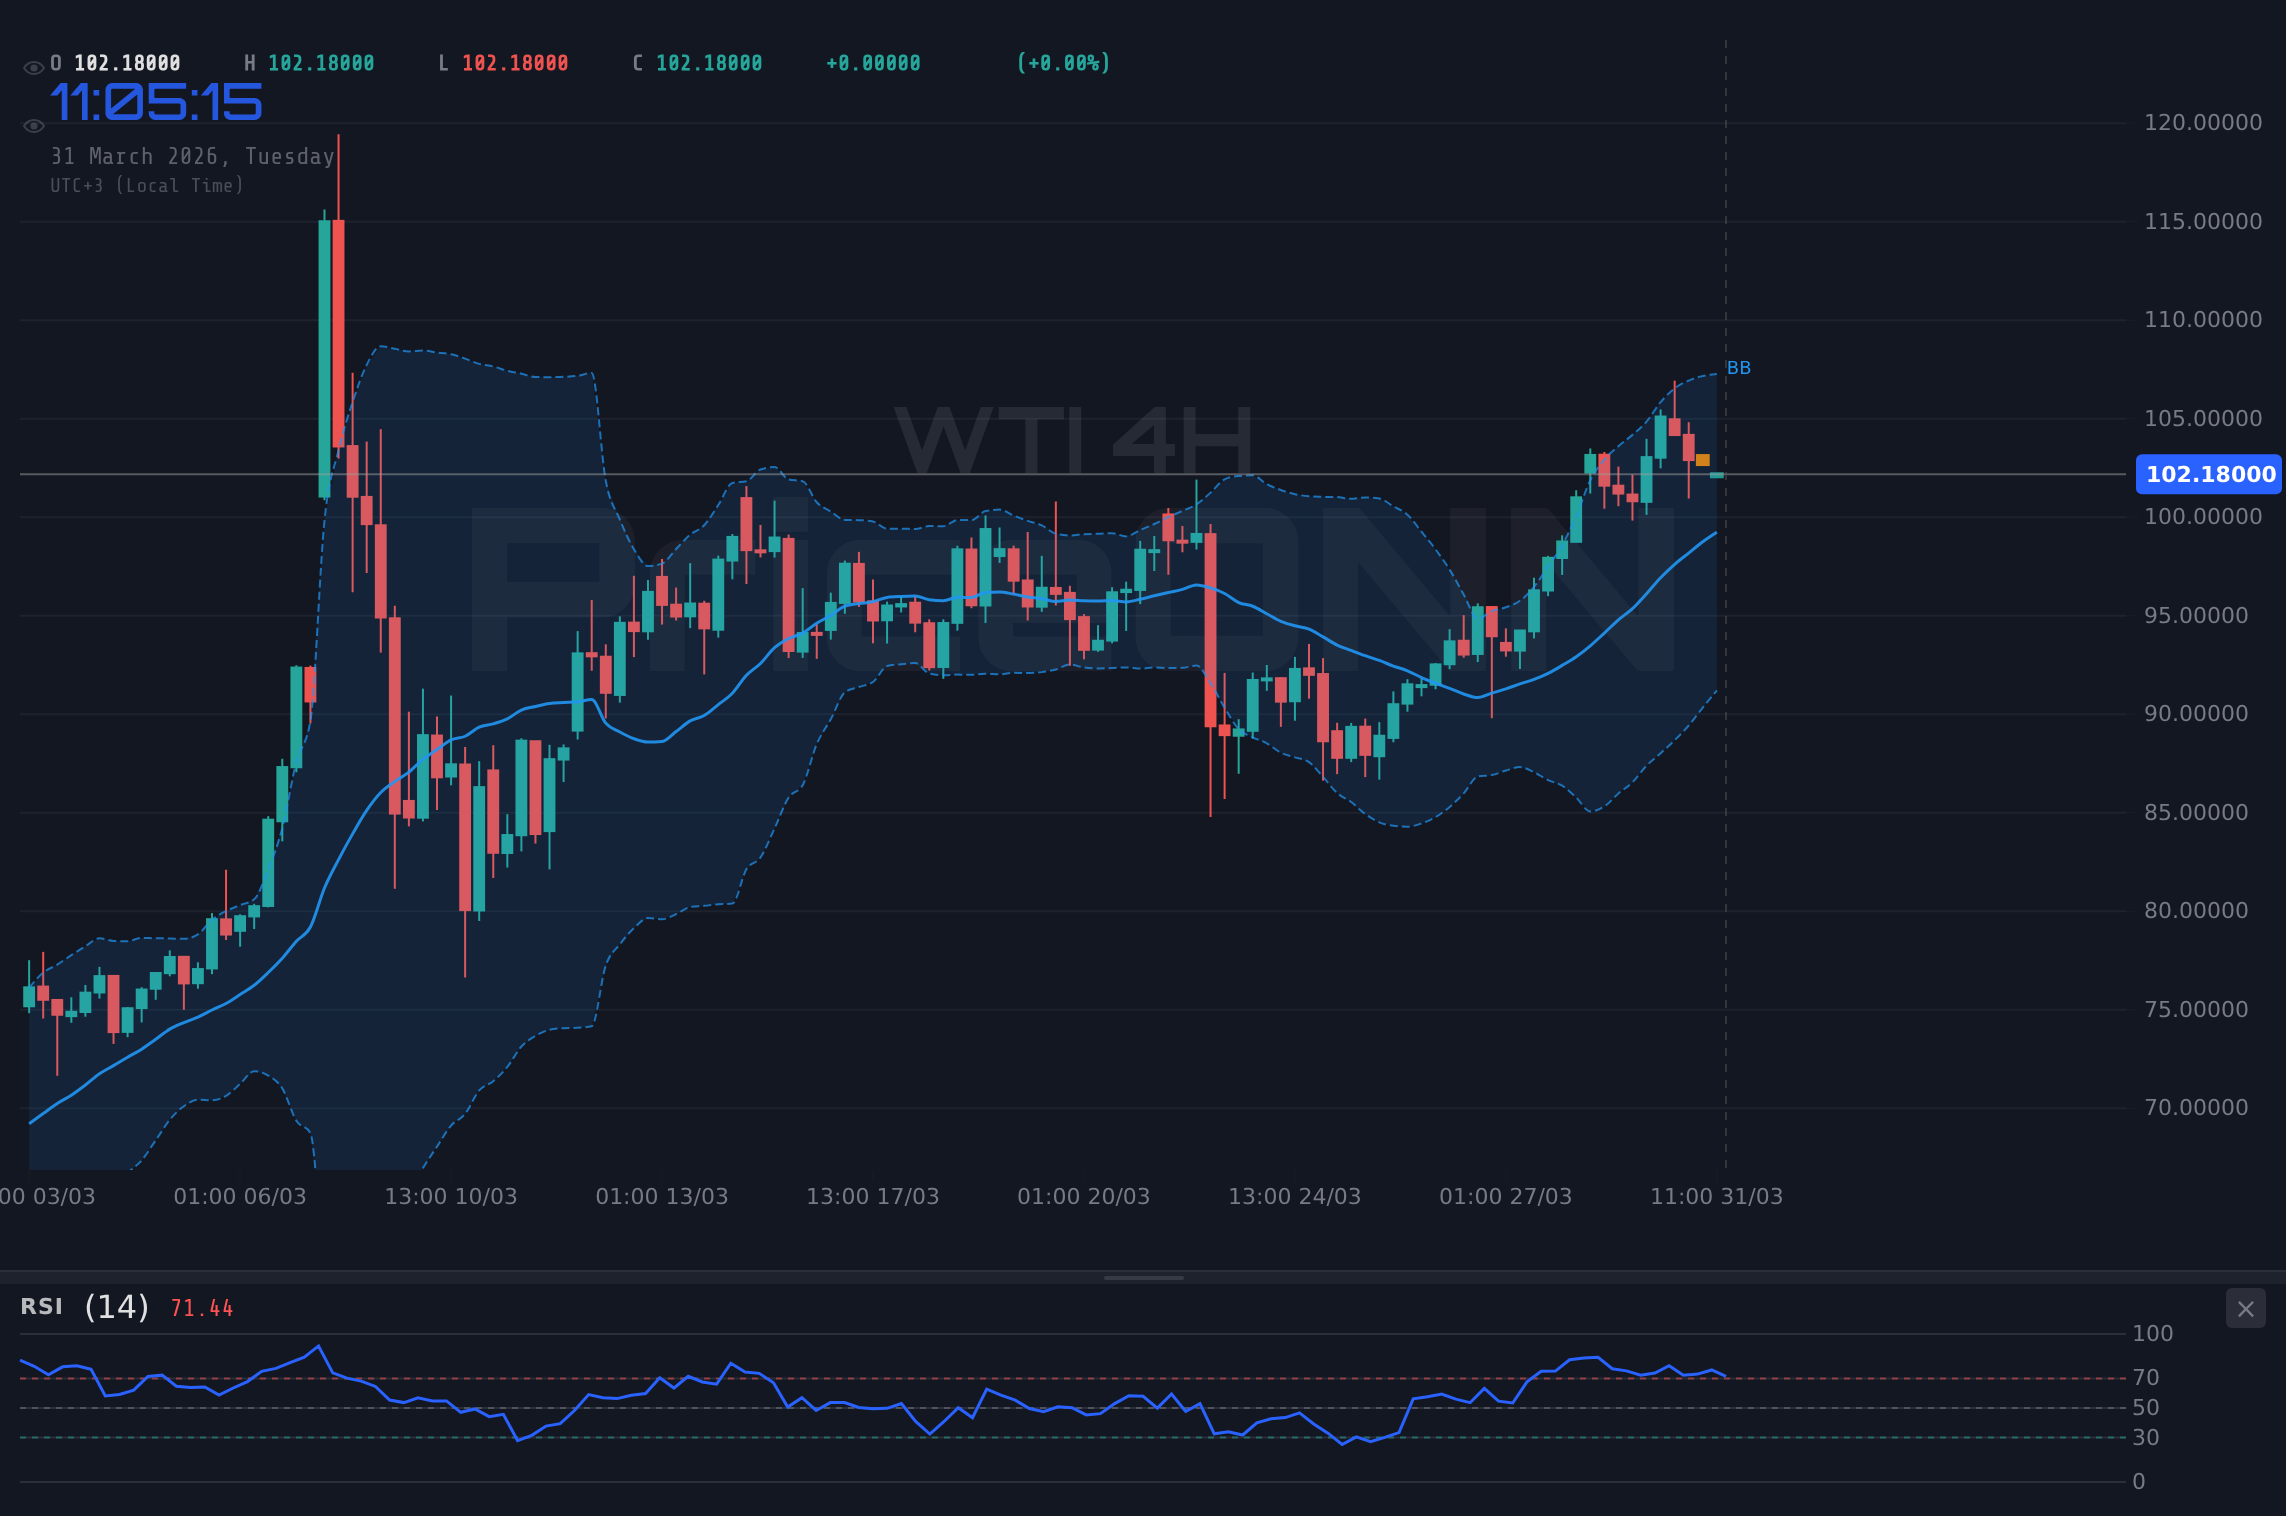
- The 4-hour chart shows a bullish trend signal (ADX 22.01), but the 1-hour chart points to a neutral-to-bearish leaning with a MACD histogram below the signal line.
Navigating the Crossroads: Powell's Influence on Oil
The immediate focus for WTI traders is the impending speech by Federal Reserve Chair Jerome Powell. In the current economic climate, characterized by persistent inflation concerns and a complex global growth outlook, the Fed's stance on interest rates is paramount. Any indication of a more hawkish policy - suggesting prolonged higher rates or even further tightening - could strengthen the US Dollar (DXY), which is currently trading around 100.26. A stronger dollar typically exerts downward pressure on dollar-denominated commodities like WTI, as it makes oil more expensive for holders of other currencies. Conversely, a more dovish tone, or signals that rate cuts might be closer than anticipated, could weaken the dollar, potentially boosting WTI prices. The market is actively pricing in these possibilities, creating a palpable sense of caution ahead of Powell's remarks.
The correlation between the DXY and WTI is a critical factor to monitor. With the DXY showing a strong upward trend on the daily chart (ADX 33.32) and currently testing resistance around 100.27 on the 1-hour chart, the dollar's strength is a headwind for oil prices. However, the daily RSI for DXY at 64.3 suggests it's in a strong but not yet overbought territory, leaving room for further appreciation. Any dovish signals from Powell could see the DXY pull back from these levels, offering a potential reprieve for WTI. The interplay between Fed policy expectations and geopolitical events creates a volatile environment, demanding constant vigilance from market participants.
Technical Tapestry: A Multifaceted Picture for WTI
Examining WTI's technical indicators reveals a market at a crossroads. On the 1-hour chart, the trend is currently classified as neutral, with a trend strength of 50%. The price is trading above the middle Bollinger Band, indicating a slight upward inclination, supported by a MACD that shows positive momentum with the MACD line above the signal line. However, the RSI(14) at 50.8 is right in the neutral zone, showing a slight upward trend but lacking conviction. The Stochastic oscillator, with K=29.65 and D=29.45, shows a bullish crossover, suggesting a potential uptick, but these levels are in oversold territory, meaning the move might be a rebound rather than a sustained rally. The ADX at 18.92 signifies a weak trend, suggesting that the current price action lacks strong directional commitment.
The 4-hour timeframe presents a more bullish technical picture. Here, the trend is classified as rising, with a strength of 86%. The price is firmly above the middle Bollinger Band, and the MACD displays positive momentum. The RSI(14) at 62.24 indicates a stronger upward leaning, moving out of neutral territory towards overbought conditions. The Stochastic oscillator (K=71.72, D=82.71) is showing a bearish crossover, signaling a potential pullback from current levels, but this signal comes from overbought territory, which can sometimes persist. The ADX at 22.01 confirms a moderately strong upward trend, suggesting that the underlying momentum is building. This divergence between the 1-hour and 4-hour charts highlights the indecision currently plaguing WTI.
However, the daily chart paints a different story, leaning towards a more robust uptrend. The trend is classified as rising with a strength of 100%, and the ADX at 58.34 confirms a very strong uptrend. The price is trading above the middle Bollinger Band, and the MACD shows positive momentum. The RSI(14) at 66.22 is approaching overbought territory but still has room to run within a strong trend. The Stochastic oscillator (K=91.12, D=59.36) shows a bullish crossover, reinforcing the upward bias. This daily strength suggests that any short-term pullbacks might be seen as buying opportunities by longer-term traders, provided key support levels hold.
Supply Side Pressures: Geopolitics and OPEC+ Dynamics
The persistent geopolitical tensions, particularly in the Middle East, continue to be a significant underpinning factor for crude oil prices, including WTI. Recent reports indicate Japan's release of strategic reserves, a move partly driven by escalating tensions in the region. While this might temporarily ease immediate supply fears, the underlying risk premium associated with potential supply disruptions remains embedded in the market. The ongoing conflict in the Middle East, coupled with the continued ramifications of the Russia-Ukraine war, creates an environment where any supply-side shock could lead to sharp price spikes. This geopolitical backdrop provides a floor for WTI, even amidst concerns about global demand.
The influence of OPEC+ decisions cannot be overstated. While the group has implemented production cuts to stabilize the market, the adherence and effectiveness of these cuts remain under scrutiny. Saudi Arabia's voluntary production cut, for instance, is a key factor in maintaining a supply deficit. The market is constantly assessing whether these measures are sufficient to offset potential increases in non-OPEC production, particularly from the U.S. shale sector. The interplay between OPEC+ supply management, geopolitical risks, and the demand outlook from major consumers like China and India creates a complex supply-side equation that directly impacts WTI's price trajectory.
Demand-Side Considerations: Global Growth and Inflationary Headwinds
On the demand side, the picture is more nuanced. While crude oil prices have surged past $100 a barrel, defying some concerns over fragile global economic growth, the sustainability of this demand is a key question. The International Monetary Fund (IMF) has warned about the persistent inflationary pressures, which could lead central banks to maintain tighter monetary policies for longer. This, in turn, could dampen economic activity and, consequently, oil demand. The recent news about MicroStrategy pausing its Bitcoin purchases amid market shifts, while related to crypto, hints at a broader cautious sentiment among investors, which could extend to other risk assets, including oil.
China's economic performance remains a critical variable. As a major consumer of oil, any signs of a slowdown or a robust recovery in the Chinese economy have a direct impact on global demand. While there have been positive indicators following China's reopening, the overall global growth narrative remains somewhat subdued. The strength of the US dollar, influenced by Fed policy, also plays a role here, making oil more expensive for emerging markets that might be struggling with currency depreciation. Balancing these factors - strong geopolitical risk premiums versus potential demand destruction from tight monetary policy and a slowing global economy - is crucial for understanding WTI's future price path.
Correlations and Contrasts: DXY, Equities, and WTI
The relationship between WTI and major market indices like the S&P 500 and Nasdaq 100 provides further context. Currently, the S&P 500 is showing a strong upward move on the 1-hour chart (68.9 points, 1.09% increase) but a bearish trend on the daily chart (ADX 50.27). Similarly, the Nasdaq 100 shows a similar pattern. This divergence suggests that while there might be short-term optimism in equities, the longer-term trend remains under pressure, potentially reflecting underlying economic anxieties. If risk appetite continues to wane, as suggested by the daily bearish trends in these indices, it could spill over into commodities, creating additional selling pressure on WTI, despite the geopolitical support.
The DXY's current position around 100.26 is particularly influential. On the 1-hour chart, the DXY shows a strong uptrend (ADX 42.47) and is nearing resistance. The RSI at 70.02 is in overbought territory, suggesting a potential pullback. If Powell signals a less hawkish stance, the DXY could retreat, which would typically be supportive of WTI. However, if the Fed maintains a hawkish outlook, the DXY could push higher, potentially dragging WTI down towards its support levels. The correlation is not always perfect, as geopolitical events can sometimes override currency movements, but it remains a primary driver to watch.
Key Levels and Trading Scenarios
Based on the provided data, WTI's immediate technical landscape is defined by key support at $102.22 and resistance at $103.11 on the 1-hour chart. The 4-hour chart offers further support levels at $100.97 and $100.49, with resistance points at $106.01 and $107.85. The daily chart shows significant support at $101.47 and $97.83, and resistance at $107.11 and $109.11. The current price of $102.58 sits between the immediate 1-hour support and resistance, indicating a tight range ahead of Powell's speech.
Bearish Scenario: Powell Sparks Dollar Strength
65% ProbabilityNeutral Scenario: Data Dependency and Range-Bound Trading
25% ProbabilityBullish Scenario: Dovish Signals and Geopolitical Premium
10% ProbabilityThe current ADX reading of 22.01 on the 4-hour chart suggests a moderately strong trend, but the conflict between the 1-hour's neutral-to-bearish lean and the daily's strong bullish trend indicates significant chop ahead. Traders should exercise caution, awaiting confirmation from Powell's speech and a clearer technical breakout or breakdown. The potential for a stop hunt before Powell speaks is also a consideration, given the market's sensitivity and the proximity of key levels.
The Path Forward: Risk Management and Strategic Positioning
WTI crude oil finds itself at a critical juncture, heavily influenced by upcoming Fed policy signals and ongoing geopolitical risks. The technical indicators present a mixed picture, with short-term charts showing indecision while longer-term charts lean bullish. The $102.58 price point represents a delicate balance, with immediate support at $102.22 and resistance at $103.11. The prevailing sentiment is one of cautious anticipation, with traders looking to Powell's address for directional clarity. The market's ability to sustain prices above $102.22 will be a key test of bullish conviction, while a decisive break below this level could signal a deeper correction.
For traders, managing risk will be paramount. Given the high probability of volatility surrounding Powell's speech, employing strategies that account for potential whipsaws is advisable. This might involve waiting for a clear breakout above resistance or a confirmed break below support before committing to a position. Alternatively, scalping opportunities within the defined range, while closely monitoring the DXY and equity market movements, could be considered. The longer-term bullish trend on the daily chart remains intact, suggesting that any significant dips could present buying opportunities for those with a longer time horizon, provided the geopolitical risk premium continues to support oil prices.
Frequently Asked Questions: WTI Analysis
What happens if WTI breaks below the $102.22 support level after Powell's speech?
If WTI breaks decisively below the $102.22 support level, especially following hawkish remarks from Fed Chair Powell, it could trigger further selling pressure. This would likely invalidate the bullish outlook on the 4-hour chart and could see prices targeting the next significant support at $100.97, fueled by dollar strength and reduced risk appetite.
Should traders consider buying WTI at current levels around $102.58 given the mixed signals?
Buying at current levels around $102.58 is a high-risk proposition due to the uncertainty surrounding Powell's speech and the conflicting technical signals across timeframes. A more prudent approach would be to wait for confirmation: either a clear break and hold above $103.11 resistance, or a confirmed bounce from support levels like $102.22, ideally coupled with dovish Fed commentary.
Is the RSI at 50.8 on the 1-hour chart a sell signal for WTI right now?
An RSI of 50.8 on the 1-hour chart is generally considered a neutral reading, indicating neither strong buying nor selling pressure. While it shows a slight upward inclination, it's not indicative of an immediate sell signal. A move below 40 would typically be needed to signal bearish momentum, and a sustained push above 60 would suggest bullish strength building.
How will Fed Chair Powell's upcoming speech affect WTI this week, given the DXY is near resistance?
Powell's speech is pivotal. If he signals a hawkish stance, it could strengthen the DXY (currently near 100.26 resistance), pressuring WTI lower towards $102.22. Conversely, dovish signals could weaken the DXY, potentially allowing WTI to rally towards $103.11 and beyond, especially if geopolitical risks remain elevated.
Technical Outlook Summary
| Indicator | Value | Signal | Interpretation |
|---|---|---|---|
| RSI (14) | 50.8 | Neutral | Neutral, slight upward trend. Watching for moves above 60 or below 40. |
| MACD Histogram | -0.18 | Bearish | Slightly below signal line, indicating weakening momentum on 1H. |
| Stochastic | K:29.65, D:29.45 | Bullish Crossover | Bullish crossover in oversold territory on 1H, potential for short-term rebound. |
| ADX | 18.92 | Weak Trend | Low reading indicates lack of strong directional commitment on 1H. |
| Bollinger Bands | Middle Band | Watch | Price is above middle band on 1H, suggesting upward bias, but not conclusive. |
Track markets in real-time
AI-powered analysis, technical indicators and real-time price data.
Join Our Telegram Channel
Breaking market news, AI analysis and trading signals instantly.
Join Channel