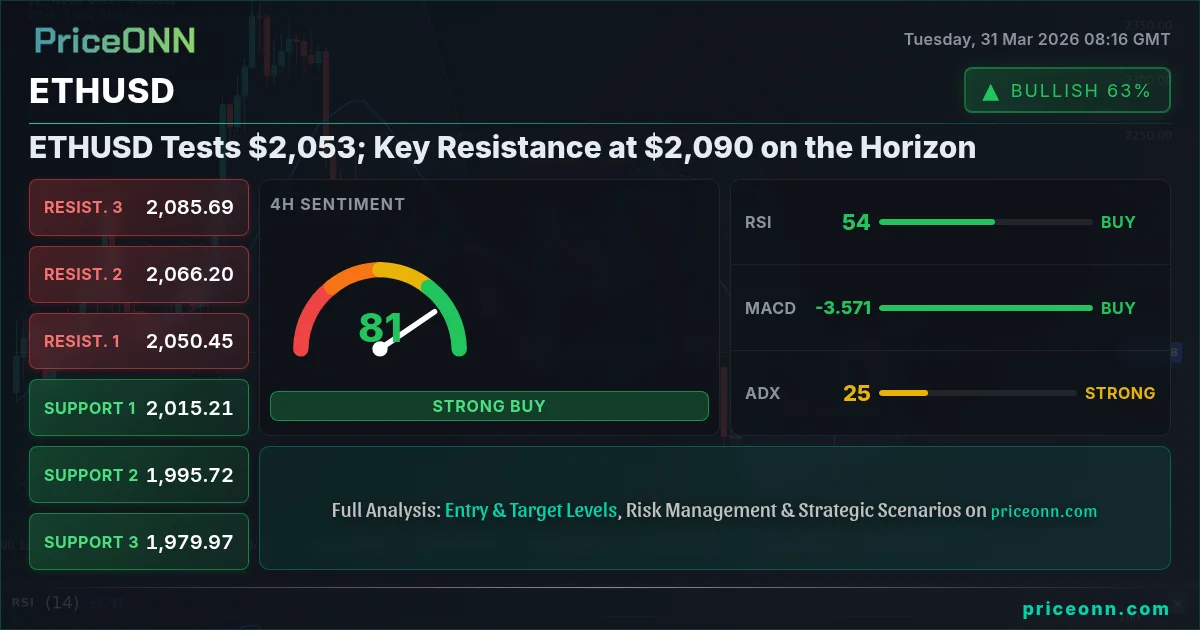
ETHUSD Tests $2,053; Key Resistance at $2,090 on the Horizon
ETHUSD is currently trading at $2,053.01. With mixed signals across timeframes, traders are watching crucial support and resistance levels for the next directional move.
The cryptocurrency market is in a perpetual state of flux, and ETHUSD is no exception. After a period of consolidation, the second-largest digital asset by market capitalization is showing signs of life, currently trading at precisely $2,053.01. This level, while seemingly just another number, represents a critical juncture. The question on every trader's mind is whether this is the prelude to a significant upward move towards the $2,090 resistance, or if we're merely seeing a temporary bounce before further downside. Understanding the interplay between technical indicators, broader market sentiment, and the ever-present macroeconomic backdrop is paramount for navigating these choppy waters. This analysis delves into the intricate details of ETHUSD's current technical posture, exploring the potential scenarios that could unfold in the coming days and weeks.
- ETHUSD is currently trading at $2,053.01, with key resistance eyed at $2,090 and support at $2,044.34.
- The 1-hour chart shows a neutral trend with a bullish bias (7 Buy, 1 Sell signals), while the 4-hour chart maintains a similar outlook (5 Buy, 3 Sell).
- However, the daily timeframe presents a contrasting bearish signal (2 Buy, 6 Sell), indicating potential headwinds for ETHUSD despite short-term optimism.
- The US Dollar Index (DXY) is strong at 100.3, which typically exerts downward pressure on crypto assets like ETHUSD.
The path forward for ETHUSD is far from clear-cut, presenting a classic case of conflicting signals across different timeframes. On the shorter 1-hour and 4-hour charts, the technical indicators lean towards a bullish sentiment. The 1-hour chart, for instance, shows a neutral trend with a strong lean towards buying, evidenced by a general signal count of 7 'Buy' to 1 'Sell'. Similarly, the 4-hour timeframe echoes this cautious optimism, with a 5 Buy, 3 Sell signal ratio. This suggests that intraday traders and those looking for short-term gains might be finding opportunities on the buy-side. The RSI on these shorter frames hovers in the mid-50s, indicating room for upward momentum without being immediately overbought. MACD is also showing positive momentum, and Stochastic oscillators, while sometimes showing divergence, are generally not in extreme territory, allowing for potential further upside.
However, the moment we shift our gaze to the daily chart, the narrative takes a sharp turn. The longer-term picture for ETHUSD is decidedly more bearish, with a significant majority of indicators signaling 'Sell' – a stark contrast to the shorter timeframes. The daily RSI sits at 47.51, showing a bearish eğilim (downward tendency) and suggesting that while not yet oversold, the momentum is not in favor of buyers. The MACD is below its signal line, confirming negative momentum. Bollinger Bands are also positioned below the middle band, a classic bearish sign. This divergence between short-term optimism and long-term caution is precisely where market participants need to exercise the most vigilance. It suggests that any current upward movement might be a counter-trend rally within a larger bearish structure, or that the market is grappling with conflicting information. The ADX on the daily chart at 15.63 indicates a weak trend, which can often lead to volatile price swings in either direction, but the overall signal leans towards caution.
The broader macroeconomic environment further complicates the outlook for ETHUSD. The US Dollar Index (DXY) is currently trading at 100.3, a level that historically exerts significant pressure on risk assets, including cryptocurrencies. A strong dollar often implies tighter global liquidity or a 'risk-off' sentiment, making assets like ETHUSD less attractive to investors. The fact that the DXY is showing a strong upward trend on its daily chart (ADX at 33.32) reinforces this headwind. Furthermore, the recent surge in crude oil prices, with Brent hitting $110.48 and WTI at $102.76, adds another layer of complexity. While higher oil prices can sometimes signal robust economic activity, they also contribute to inflationary pressures. This can force central banks, particularly the Federal Reserve, to maintain a hawkish stance on interest rates for longer than anticipated. Higher interest rates generally make riskier assets less appealing as the opportunity cost of holding them increases.
Navigating the Technical Landscape: ETHUSD's Short-Term Outlook
Zooming back into the 1-hour and 4-hour charts, the bullish signals are notable, albeit with caveats. On the 1-hour chart, ETHUSD finds itself trading just above the $2,053.01 mark. Key support levels to watch are clustered around $2,044.34, $2,048.53, and $2,054.37. A decisive break below the $2,044.34 level would invalidate the short-term bullish thesis and could signal a move towards the next significant support at $2,015.21 on the 4-hour chart. Conversely, immediate resistance lies at $2,064.40, $2,068.59, and crucially, the $2,090 level that has been mentioned as a target. A sustained move above $2,064.40 could embolden buyers, but the real test will be clearing the $2,090 mark, which represents a significant psychological and technical barrier.
The RSI(14) on the 1-hour chart is at 53.46, indicating some upward momentum but still plenty of room before reaching overbought territory. This suggests that there is still fuel in the tank for a potential rally. The MACD indicator on this timeframe is positive, with the MACD line above the signal line, further supporting the short-term bullish case. However, the Stochastic oscillator presents a conflicting signal. With K at 54.83 and D at 65.56, it indicates a potential bearish crossover or a move towards overbought conditions from a higher position, which could foreshadow a short-term pullback. The ADX, measuring trend strength, is low at 14.74 on the 1-hour chart, indicating a lack of strong directional conviction and suggesting that price action might remain choppy or range-bound in the immediate term. This low ADX reading means that any breakout above immediate resistance needs to be confirmed by increasing volume and momentum.
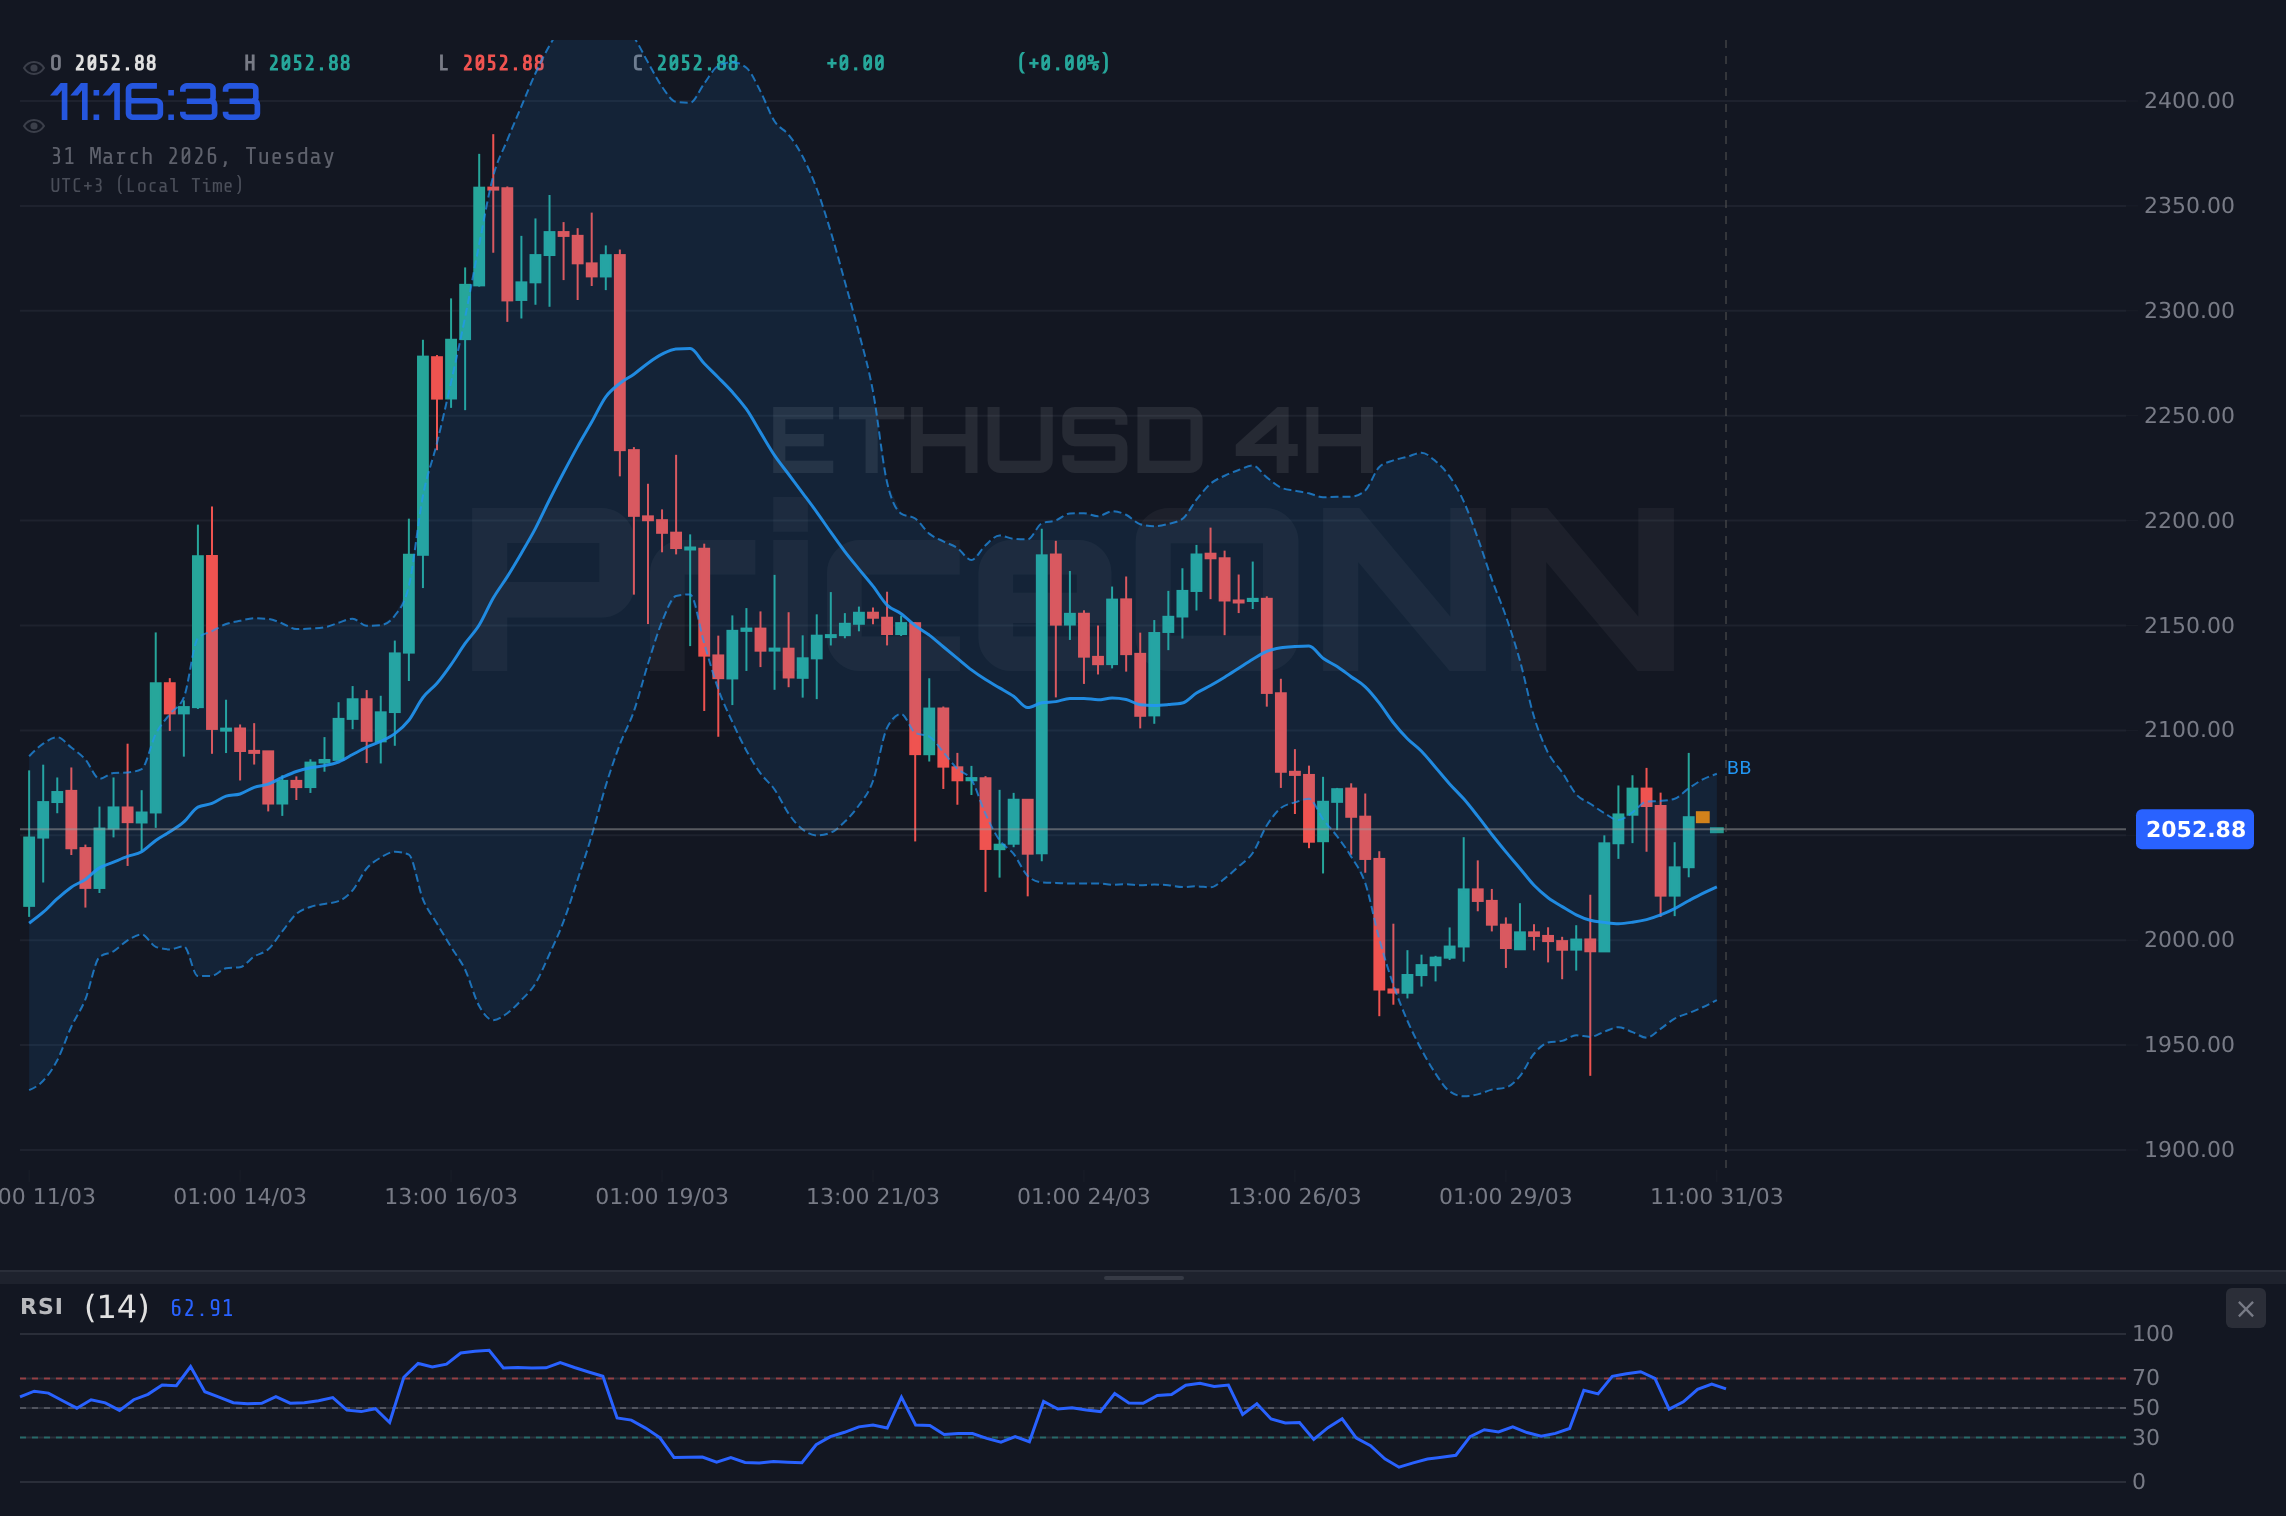
The 4-hour chart offers a similar, though slightly more cautious, perspective. ETHUSD is trading above the middle Bollinger Band, which generally supports a bullish outlook. The RSI is at 53.24, again suggesting room for upside. However, the MACD is positive, and the Stochastic K line (67.55) is above the D line (81.01), indicating a bullish signal, but this is a somewhat weaker signal compared to the 1-hour chart. The ADX here is slightly higher at 25.42, indicating a stronger, albeit still moderate, trend. The general signal count across all indicators on the 4-hour timeframe is 5 'Buy' and 3 'Sell', leaning positive but not overwhelmingly so. This reinforces the idea that while short-term momentum might be positive, the underlying trend is not yet firmly established, and significant resistance levels loom.
The Daily Chart Divergence: A Cause for Concern?
The daily timeframe presents a starkly different picture, and it's crucial for any ETHUSD trader to acknowledge this divergence. The daily RSI is at 47.51, firmly in neutral territory but with a downward eğilim. This suggests that the recent price action, while potentially positive on shorter timeframes, is not yet strong enough to overcome the longer-term bearish sentiment. The MACD is clearly negative, with the MACD histogram below zero and the MACD line below the signal line. This is a classic bearish signal, indicating that downward momentum is dominant on a daily basis. Bollinger Bands are also situated below the middle band, further confirming the bearish bias on the daily chart.
The Stochastic oscillator on the daily chart provides a glimmer of hope for the bulls, showing K at 31.2 and D at 21.64, indicating a potential bullish crossover and a move out of oversold territory. However, this single bullish signal is heavily outweighed by the bearish readings from RSI, MACD, and Bollinger Bands. The ADX on the daily chart stands at 15.63, indicating a weak trend. While a weak trend can sometimes precede a strong move, the confluence of bearish indicators suggests that this weakness might be a precursor to further downside rather than a launchpad for a significant rally. The overall signal count on the daily chart is heavily skewed towards 'Sell' (2 Buy, 6 Sell), underscoring the risks associated with chasing short-term gains without considering the longer-term trend.
This divergence is a critical element for risk management. It implies that any bullish trades initiated based on the 1-hour or 4-hour signals should be treated with extreme caution. Tight stop-losses and profit targets are essential. A close below the $2,044.34 support on the daily chart would likely confirm the bearish thesis and could trigger significant selling pressure, potentially sending ETHUSD towards the 4-hour support levels around $2,015.21 and below. The market is essentially at a crossroads, and the daily timeframe's bearish undertones cannot be ignored. Investors must consider whether the short-term buying pressure is strong enough to overcome the entrenched long-term selling sentiment.
Correlation with Equities and the Dollar
The relationship between cryptocurrencies, particularly ETHUSD, and traditional markets like equities and the US Dollar Index (DXY) is a crucial factor influencing price action. As previously mentioned, the DXY is currently strong at 100.3, trading within a robust uptrend on its daily chart (ADX at 33.32). This strength in the dollar typically acts as a headwind for ETHUSD. When the dollar strengthens, it often signifies a 'risk-off' environment, where investors move capital away from riskier assets like cryptocurrencies and into perceived safe havens like the dollar itself. The RSI on the DXY's daily chart is at 64.58, indicating a healthy uptrend without being excessively overbought, suggesting further dollar strength could be on the cards.
The performance of major US equity indices, such as the S&P 500 and Nasdaq 100, also provides valuable context. Both indices are showing a bearish trend on their daily charts, with ADX values indicating strong downward momentum (S&P 500 at 50.27, Nasdaq 100 at 49.33). This suggests a decline in overall risk appetite within the broader market. A falling stock market often correlates with a decline in cryptocurrency prices, as investors tend to reduce their exposure to speculative assets during periods of economic uncertainty. The fact that both SP500 and Nasdaq are showing strong bearish signals on the daily timeframe, while ETHUSD's daily chart is also bearish (though less decisively), indicates a potential alignment of risk sentiment. If the equity markets continue to slide, it would likely exacerbate any downward pressure on ETHUSD.
The recent news regarding the surge in oil prices also plays a role. Brent crude at $110.48 and WTI at $102.76 are not only inflationary pressures but also indicators of geopolitical tension, particularly in the Middle East. Such geopolitical instability typically fuels demand for safe-haven assets, which can include the US dollar, further pressuring ETHUSD. While some might argue that increased energy costs could lead to increased inflation expectations, potentially benefiting assets like Bitcoin and Ethereum as inflation hedges, the current macroeconomic environment, characterized by a strong dollar and weakening equities, seems to be overriding this narrative. The immediate impact appears to be a dampening of risk appetite, which is detrimental to ETHUSD.
Trade Scenarios for ETHUSD
Given the conflicting signals and the current market environment, it's essential to outline potential scenarios for ETHUSD. The probabilities assigned reflect a blend of short-term bullish indicators and longer-term bearish concerns, alongside the macroeconomic backdrop.
Bearish Scenario: Downside Confirmation
65% ProbabilityNeutral Scenario: Consolidation and Observation
25% ProbabilityBullish Scenario: Short-Term Momentum Sustains
10% ProbabilityThe bearish scenario carries the highest probability, primarily due to the conflicting daily chart signals and the strong DXY. A break below $2,044.34 would likely trigger stop-losses and accelerate selling pressure. The neutral scenario anticipates a period of indecision, where the market digests the conflicting signals and waits for a clearer catalyst. This could involve sideways price action between the immediate support and resistance levels. The bullish scenario, while having the lowest probability, hinges on short-term momentum overpowering the longer-term bearish trend and macroeconomic headwinds. A breakout above $2,064.40 would be the first sign, but the ultimate test would be conquering the $2,090 resistance, which would then open the door to higher daily resistance levels.
Economic Calendar and Future Catalysts
Looking at the economic calendar, Tuesday, March 31st, 2026, shows a relatively quiet day for high-impact events concerning major currencies. There are no immediate high-impact releases scheduled for USD, EUR, GBP, or JPY that would drastically alter the short-term outlook for ETHUSD today. However, the underlying economic forces, such as inflation and interest rate expectations, continue to shape the broader market. The persistent strength in oil prices ($110.48 for Brent) remains a key inflationary concern, which could keep the Federal Reserve on a tighter leash regarding potential interest rate cuts. While the market may be pricing in some rate cuts this year, any data that points to sticky inflation could quickly recalibrate those expectations, strengthening the dollar and pressuring assets like ETHUSD.
The upcoming weeks will be crucial. Any significant shifts in economic data, such as Non-Farm Payrolls (NFP) or Consumer Price Index (CPI) reports, could provide a clearer direction. If inflation data continues to surprise to the upside, or if employment figures remain robust, the Fed's hawkish stance could solidify. This would likely translate into a stronger dollar and potentially lower risk asset prices. Conversely, any signs of cooling inflation or a weakening labor market could lead to a dovish pivot from the Fed, weakening the dollar and providing a much-needed tailwind for ETHUSD and other cryptocurrencies. Traders should closely monitor upcoming economic releases and central bank commentary for any hints about future monetary policy. The current geopolitical tensions, especially with oil prices remaining elevated, add a layer of uncertainty that cannot be ignored.
The cryptocurrency market itself also has internal catalysts. Developments regarding Ethereum's network upgrades, regulatory news, or significant institutional adoption announcements can independently influence ETHUSD's price action. However, in the current macro environment, it appears that broader market sentiment and macroeconomic factors are playing a more dominant role in dictating short-term price movements. The ongoing debate about whether Bitcoin's halving event will have a sustained positive impact on the broader crypto market, including ETHUSD, is also a factor to consider. While historically halving events have been bullish, the current macroeconomic headwinds might mute or delay such an effect. Therefore, while internal crypto catalysts are important, they may struggle to overcome the prevailing external pressures in the immediate future.
The Path Forward: Strategy and Risk Management
For traders looking to position themselves in ETHUSD, a strategy centered on risk management and patience is paramount. Given the conflicting signals between short-term bullish momentum and the longer-term bearish outlook, entering the market requires a clear plan. The bearish scenario, with a 65% probability, suggests that betting on downside continuation might be the more prudent approach. This would involve waiting for a clear break below the $2,044.34 support level, targeting $2,015.21 and potentially $1,979.97. Strict stop-losses should be placed just above the trigger level to limit potential losses if the market reverses unexpectedly.
For those who believe in the short-term bullish momentum, a more cautious approach is advised. The bullish scenario, with a 10% probability, suggests waiting for a confirmed breakout above $2,064.40, ideally with increasing volume, before considering a long position. The first target would be the key resistance at $2,090. However, given the daily bearish divergence and the strong DXY, it would be wise to use tighter profit targets and consider scaling out of positions as price approaches significant resistance levels. The neutral scenario, representing a 25% probability, implies a period of consolidation. In this case, waiting for price to break out of the range between $2,044.34 and $2,064.40 would be prudent, avoiding premature entries.
Ultimately, ETHUSD is at a critical juncture. The technical picture is mixed, with shorter timeframes showing some promise for buyers, while the longer-term daily chart and the macroeconomic environment present significant headwinds. The strong US dollar (DXY at 100.3) and elevated oil prices ($110.48 Brent) are creating an environment that is generally unfavorable for risk assets. Traders must respect the daily chart's bearish signals and manage their risk accordingly. Patience will be rewarded; waiting for a confirmed break of key support or resistance levels, aligned with the broader market trend, is the most sensible approach. The market always provides opportunities, but it's crucial to wait for the right setup with favorable risk/reward parameters.
Frequently Asked Questions: ETHUSD Analysis
What happens if ETHUSD breaks below the $2,044.34 support level?
A decisive close below $2,044.34 would likely invalidate the short-term bullish outlook and confirm the bearish sentiment seen on the daily chart. This could trigger stop-losses, accelerating a move towards the next significant support at $2,015.21, and potentially further down to $1,979.97.
Should I consider buying ETHUSD around the current $2,053.01 level given the mixed signals?
Buying at current levels is risky due to the bearish divergence on the daily chart and the strong DXY at 100.3. A more prudent approach would be to wait for confirmation, either a break above $2,064.40 resistance for a bullish entry or a confirmed break below $2,044.34 support for a bearish trade, always with strict risk management.
Is the RSI at 53.46 on the 1-hour chart a buy signal for ETHUSD?
An RSI of 53.46 on the 1-hour chart indicates some upward momentum but is not a definitive buy signal on its own. It suggests there is room for further upside before reaching overbought territory, but it should be considered alongside other indicators and the broader bearish context from the daily timeframe.
How will the strong US Dollar (DXY at 100.3) affect ETHUSD's price action this week?
A strong DXY, currently at 100.3 and trending upwards, typically exerts downward pressure on risk assets like ETHUSD. This suggests that further dollar strength could hinder any potential rallies in ETHUSD and exacerbate declines if risk sentiment deteriorates.
Track markets in real-time
AI-powered analysis, technical indicators and real-time price data.
Join Our Telegram Channel
Breaking market news, AI analysis and trading signals instantly.
Join Channel