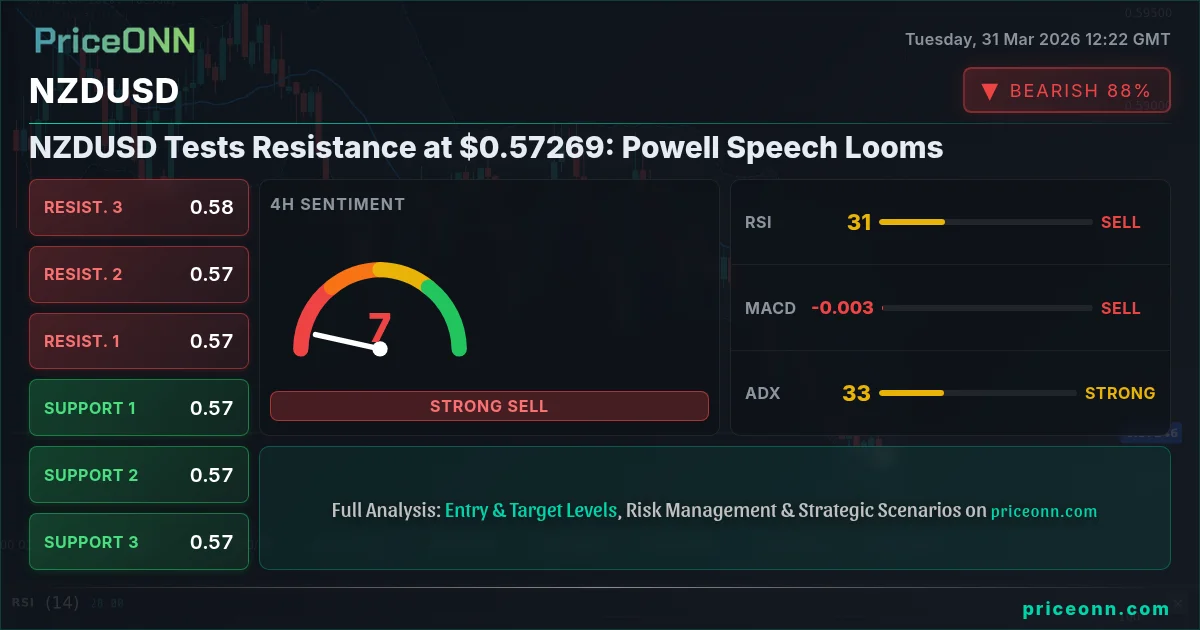
NZDUSD Tests Resistance at $0.57269: Powell Speech Looms
NZDUSD is testing resistance near $0.57269 as traders await Powell's speech. Technicals show a strong downtrend, but a potential breakout is monitored.
The NZDUSD pair finds itself at a critical juncture, hovering around the $0.57269 mark, a level that has proven to be a significant point of contention. With the US Dollar Index (DXY) showing mixed signals and a looming speech from Fed Chair Powell, market participants are on edge, seeking clarity on the future path of monetary policy. This analysis delves into the technical underpinnings of NZDUSD, examining its current price action, indicator readings, and the potential scenarios that could unfold in the coming sessions.
- NZDUSD is currently trading at $0.57269, facing resistance.
- The 1D ADX at 38.94 indicates a strong downtrend, but the 1H ADX at 25.83 suggests a potential shift.
- RSI(14) on the 1D chart is at 35.63, signaling oversold conditions, while the 1H RSI is at 55.04, showing neutral momentum.
- Key resistance is eyed at $0.57458, with support at $0.56959.
- Traders await Fed Chair Powell's speech for directional cues amid geopolitical tensions impacting oil prices.
The current price of NZDUSD at $0.57269 reflects a complex interplay of factors, from the broader market sentiment influenced by geopolitical events to specific currency dynamics. The recent surge in oil prices, exceeding $110 for Brent crude, continues to fuel inflationary concerns. This backdrop puts central banks, particularly the Federal Reserve, in a delicate position. While higher energy costs typically imply inflationary pressures, which might warrant a hawkish stance, the Fed also needs to consider the potential impact on economic growth. Fed Chair Powell's upcoming speech will be closely scrutinized for any hints regarding the future trajectory of interest rates, which could significantly influence the US dollar's strength and, consequently, pairs like NZDUSD.
From a technical standpoint, the daily chart presents a predominantly bearish picture for NZDUSD. The ADX indicator, a measure of trend strength, stands at a robust 38.94 on the daily timeframe, confirming a strong downward trend. This is further supported by the RSI(14) reading of 35.63, which, while in neutral territory, shows a bearish inclination and suggests room for further downside before hitting extreme oversold conditions. The MACD also indicates negative momentum, with its histogram below the signal line. The Bollinger Bands on the daily chart are positioned below the middle band, reinforcing the prevailing bearish sentiment. However, the price action on shorter timeframes paints a slightly different, albeit still cautious, picture.
Navigating the Shorter-Term Charts
On the 1-hour chart, the ADX is at 25.83, indicating a moderately strong trend, but this is significantly weaker than the daily trend strength. The RSI(14) at 55.04 sits squarely in the neutral zone, showing neither overbought nor oversold conditions, and exhibiting a slight upward bias. The MACD on this timeframe shows positive momentum, with the MACD line above its signal line, which is a divergence from the daily outlook. The Stochastic Oscillator on the 1H chart, with K at 38.36 and D at 27.83, shows a bullish signal (%K > %D), suggesting a potential upward move might be brewing in the immediate term. This contrast between the daily and intraday indicators highlights the current indecision and the importance of monitoring price action around key levels.
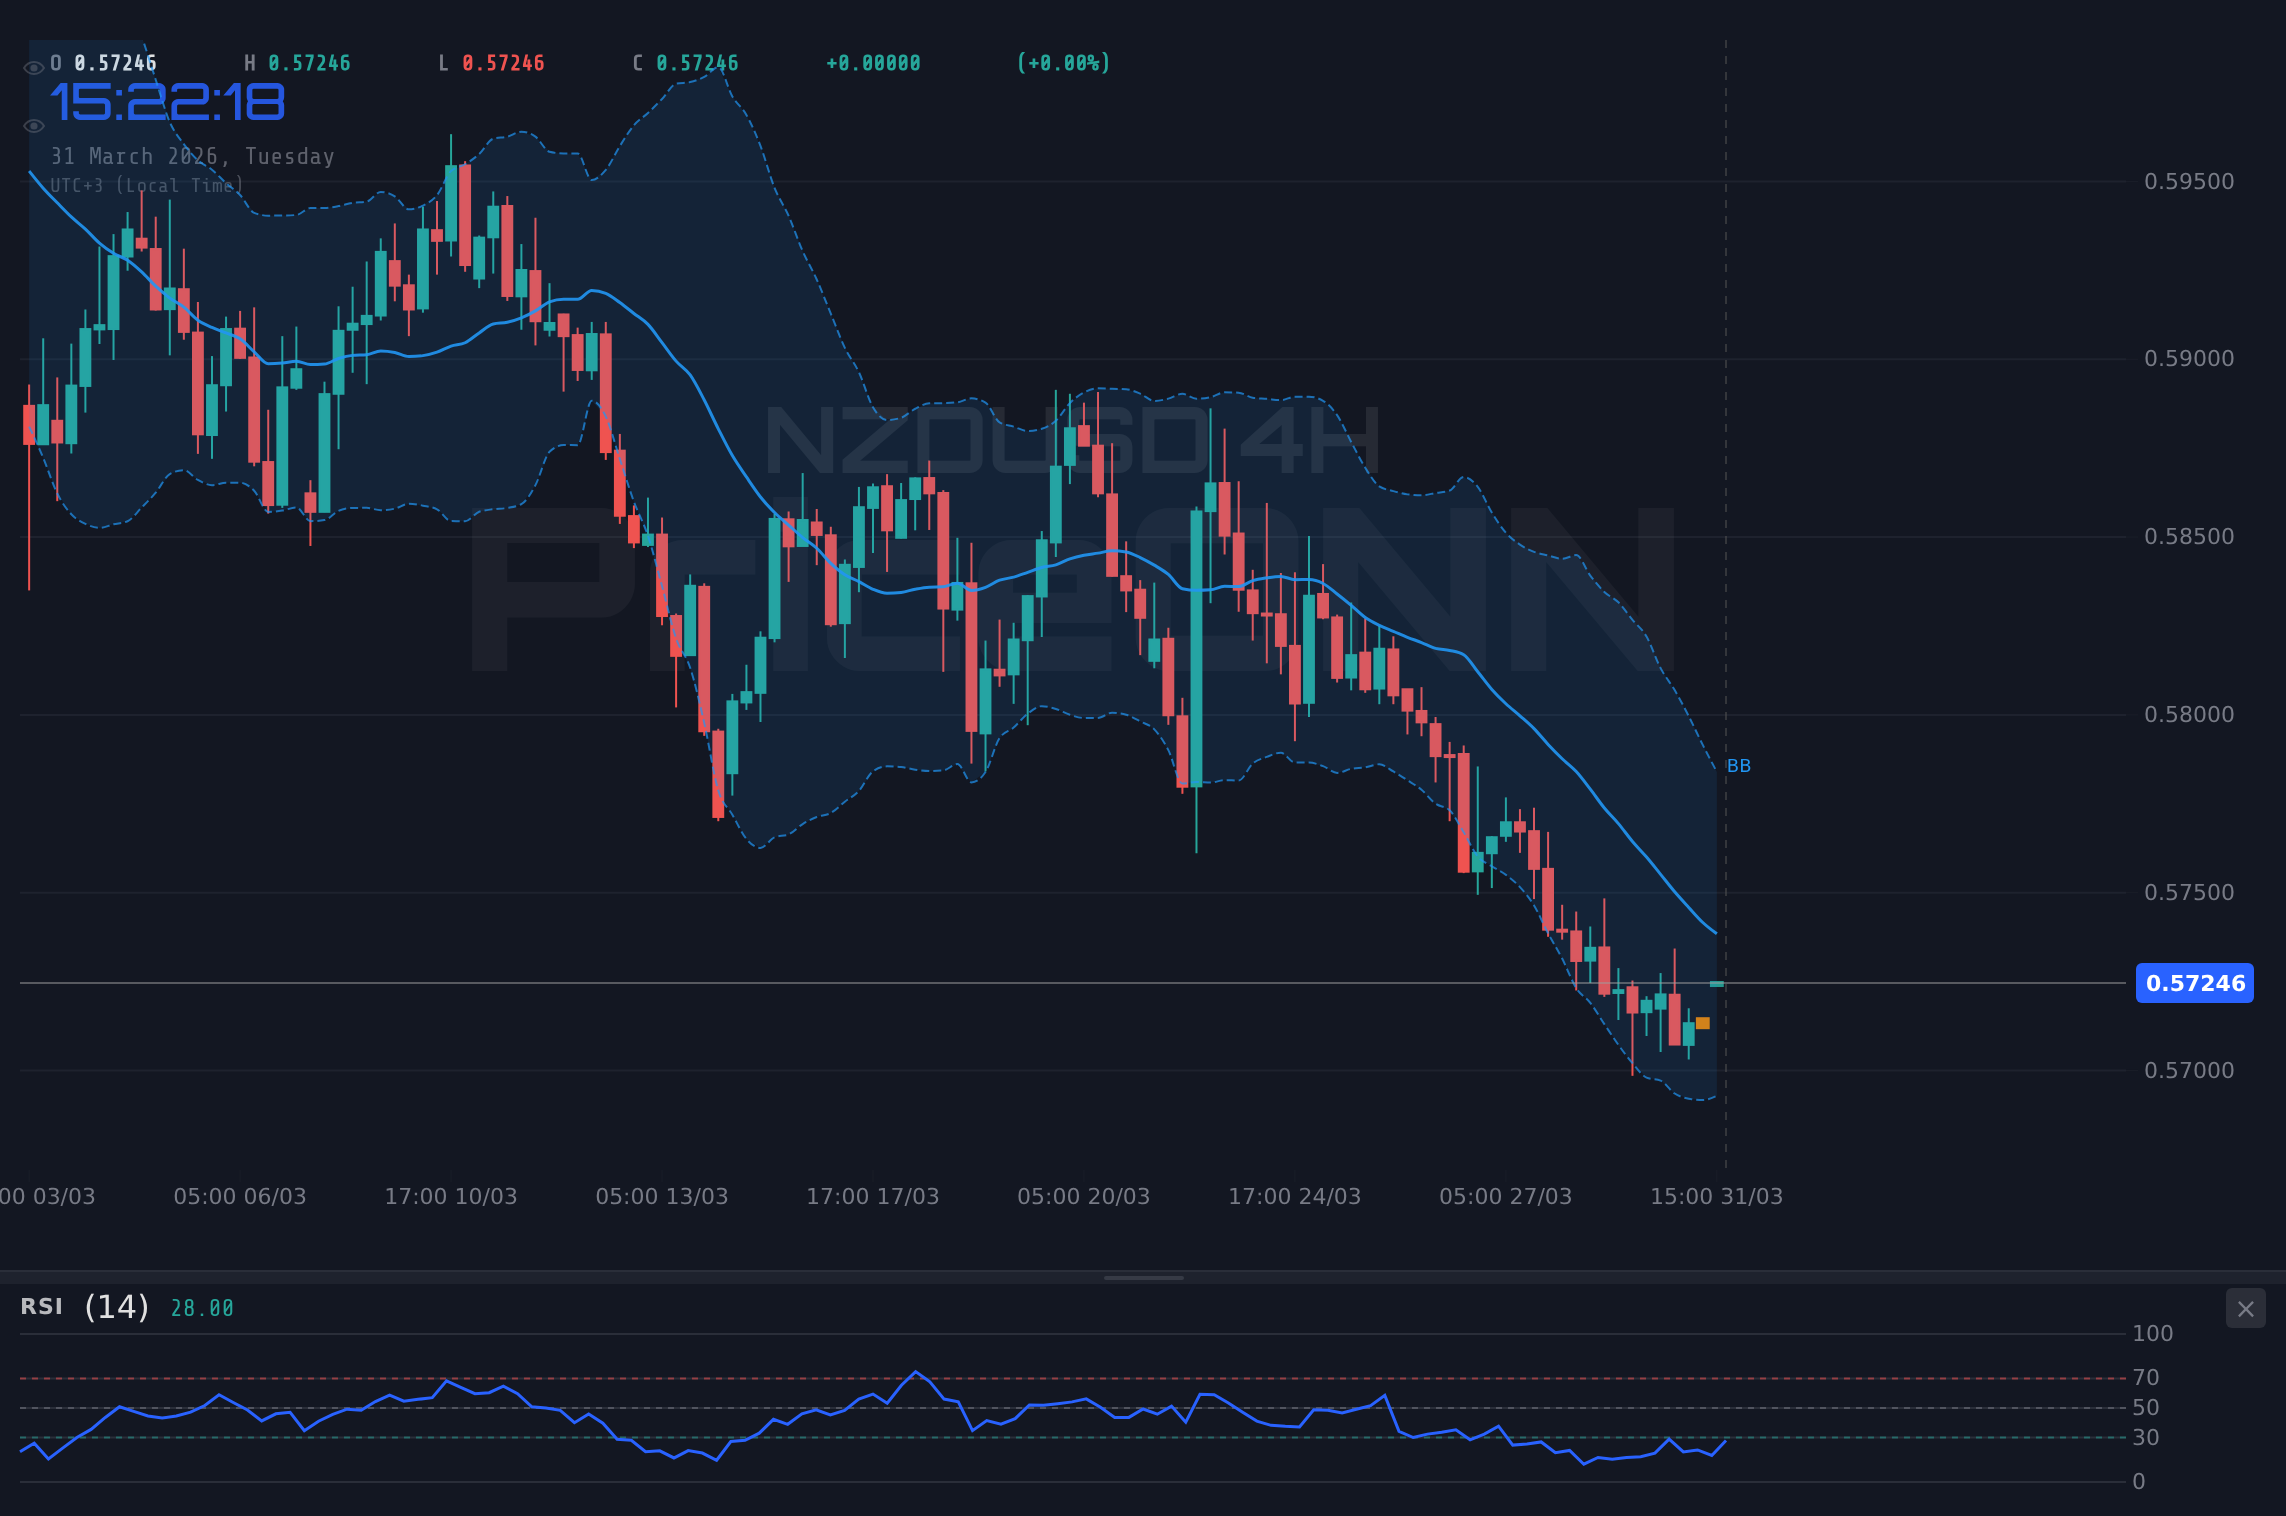
The 4-hour chart for NZDUSD offers a blend of these signals. The trend is classified as 'Düşüş' (Downtrend) with a high strength of 96%, reinforcing the daily bearish view. However, the RSI(14) at 30.68 is nearing oversold territory, hinting at a potential pause or reversal. The MACD shows negative momentum, aligning with the longer-term trend, but the Stochastic Oscillator, with K at 26.89 and D at 21.24, provides a bullish signal (%K > %D), suggesting a possible short-term bounce. The Bollinger Bands on the 4H chart are situated above the middle band, which is unusual for a strong downtrend and could signal a potential shift or a period of consolidation before the next move.
The Bear's Path: Downside Continuation
65% ProbabilityConsolidation Zone: The Waiting Game
25% ProbabilityThe Bull's Gambit: Reversal Attempt
10% ProbabilityThe most probable scenario, given the strong daily trend indicators, is a continuation of the downtrend. The ADX at 38.94 on the daily chart is a significant signal of trend strength, suggesting that the prevailing downward momentum is likely to persist unless a major catalyst intervenes. The RSI at 35.63, while not yet oversold, indicates that the pair is in the lower half of its range, affording bears more room to operate. A daily close below the immediate support at $0.56959 would likely confirm this bearish outlook, potentially triggering a move towards the $0.56723 and then $0.56460 levels. These levels represent previous areas of consolidation and significant support, where buyers might step in, but the current trend suggests they could be breached.
However, the market is rarely one-dimensional. The divergence seen in the shorter-term timeframes cannot be entirely dismissed. The 1-hour RSI at 55.04 and the Stochastic's bullish signal suggest that a short-term correction or a period of consolidation is possible. If price action fails to decisively break below $0.56959, we could enter a neutral phase. This 'waiting game' scenario, with a 25% probability, would see NZDUSD oscillating between the $0.56959 support and the $0.57458 resistance. Such a range-bound movement often precedes a significant move as traders and algorithms position themselves ahead of major economic events, like Fed Chair Powell's upcoming speech.
The bullish scenario, while currently holding a lower probability (10%), is contingent on a strong catalyst. A decisive break and sustained hold above the $0.57458 resistance level would be the primary trigger. This would require significant shifts in market sentiment, perhaps driven by weaker-than-expected US economic data or a dovish tilt from the Fed. If this bullish scenario materializes, the next targets would be $0.57721 and potentially $0.57957. However, given the prevailing daily trend strength and the broader macroeconomic environment, this outcome appears less likely in the short term without substantial new information.
Correlation and Context: DXY and Oil's Influence
The interplay between NZDUSD, the US Dollar Index (DXY), and oil prices is crucial for understanding potential market movements. Currently, the DXY is trading around 100.03, showing a slight daily decline. On the daily chart, the DXY exhibits a strong upward trend (ADX 33.32), suggesting underlying dollar strength. A rising DXY typically exerts downward pressure on pairs like NZDUSD, as seen in the daily chart's bearish signals. However, the intraday DXY charts show some weakness, which might be offering NZDUSD a temporary reprieve. The correlation is not always straightforward; for instance, the recent surge in oil prices, while potentially inflationary and dollar-supportive, is also a sign of global risk and supply chain issues, which can sometimes lead to safe-haven flows into currencies other than the dollar, or even impact risk-sensitive currencies like the NZD differently.
The ongoing geopolitical tensions in the Middle East, driving Brent crude prices above $110, add another layer of complexity. While higher oil prices can boost commodity-linked currencies like the AUD and NZD in theory, they also contribute to global inflation. This inflationary pressure is precisely what the Federal Reserve is battling. If Powell's speech hints at a more aggressive stance on inflation, it could strengthen the USD, thus pressuring NZDUSD further downwards, aligning with the dominant daily trend. Conversely, any indication of concern over growth due to high energy costs might be interpreted as dovish, potentially weakening the dollar and offering a reprieve to NZDUSD, even if it doesn't signal a full trend reversal.
The strength of the trend indicators on the daily chart for NZDUSD cannot be overstated. An ADX reading of 38.94 signifies a strong, established trend. For a reversal to occur, there would need to be a significant shift in underlying fundamentals or a clear breakdown in this trend strength on the daily chart. This would likely manifest as a weakening ADX, a break of the RSI from its current bearish bias into oversold territory (below 30), and a sustained move above key resistance levels. Until then, the path of least resistance appears to be to the downside, despite the conflicting signals on shorter timeframes.
Traders should be particularly attentive to the upcoming economic calendar. While specific high-impact events for NZDUSD's direct currency partners (EUR, USD, GBP) were not detailed with dates in the provided data, any major US inflation or employment figures released around Powell's speech could amplify market volatility. The general trend of economic data releases, coupled with central bank rhetoric, will be critical in shaping expectations for interest rate policy. For example, if recent US data has shown persistent inflation, Powell might adopt a more hawkish tone, strengthening the dollar and pushing NZDUSD lower. Conversely, signs of cooling inflation or slowing growth could lead to a more cautious outlook, potentially weakening the dollar.
| Indicator | Value | Signal | Interpretation |
|---|---|---|---|
| RSI (14) | 35.63 | Bearish | Approaching oversold on Daily, Neutral on 1H |
| MACD Histogram | - | Bearish | Negative momentum on Daily, Positive on 1H |
| Stochastic | K=8.66, D=16.05 | Bearish | Oversold on Daily, Bullish signal on 1H |
| ADX | 38.94 | Strong Trend | Daily trend strength is high |
| Bollinger | Middle Band | Below Band | Bearish bias on Daily & 4H |
The technical landscape for NZDUSD suggests that while short-term charts show signs of potential consolidation or even a minor bounce, the longer-term daily trend remains firmly bearish. The strong ADX reading on the daily chart is a key indicator that bears are in control. The upcoming speech from Fed Chair Powell represents a significant potential catalyst that could either reinforce the existing trend or trigger a sharp reversal. Traders should exercise caution, manage risk diligently, and await clear signals before committing to a position. Patience and adherence to the identified key levels will be paramount in navigating this uncertain environment.
Frequently Asked Questions: NZDUSD Analysis
What happens if NZDUSD breaks below the $0.56959 support level?
A break below $0.56959 on the daily chart would likely confirm the strong bearish trend indicated by the ADX at 38.94. This could lead to further downside towards the next support levels at $0.56723 and potentially $0.56460.
Should I buy NZDUSD at current levels around $0.57269 given the oversold RSI on the daily chart?
Buying at current levels is risky given the strong daily downtrend and the RSI at 35.63, which is not yet oversold. While the 1H chart shows some bullish signals, a confirmed daily close above $0.57458 resistance would be needed for a higher-probability bullish setup.
Is the Stochastic's bullish signal on the 1H chart a reliable buy signal for NZDUSD?
The 1H Stochastic showing %K above %D is a bullish signal, but it contradicts the stronger daily trend. This signal is best interpreted as a potential short-term bounce within the larger downtrend, rather than a trend reversal signal.
How will Fed Chair Powell's speech affect NZDUSD this week?
Powell's speech is a key event. If he signals a hawkish stance on inflation, it could strengthen the USD and push NZDUSD below $0.56959. A more dovish tone or concerns about growth might weaken the USD, offering temporary support to NZDUSD around the $0.57269 area.
Track markets in real-time
AI-powered analysis, technical indicators and real-time price data.
Join Our Telegram Channel
Breaking market news, AI analysis and trading signals instantly.
Join Channel