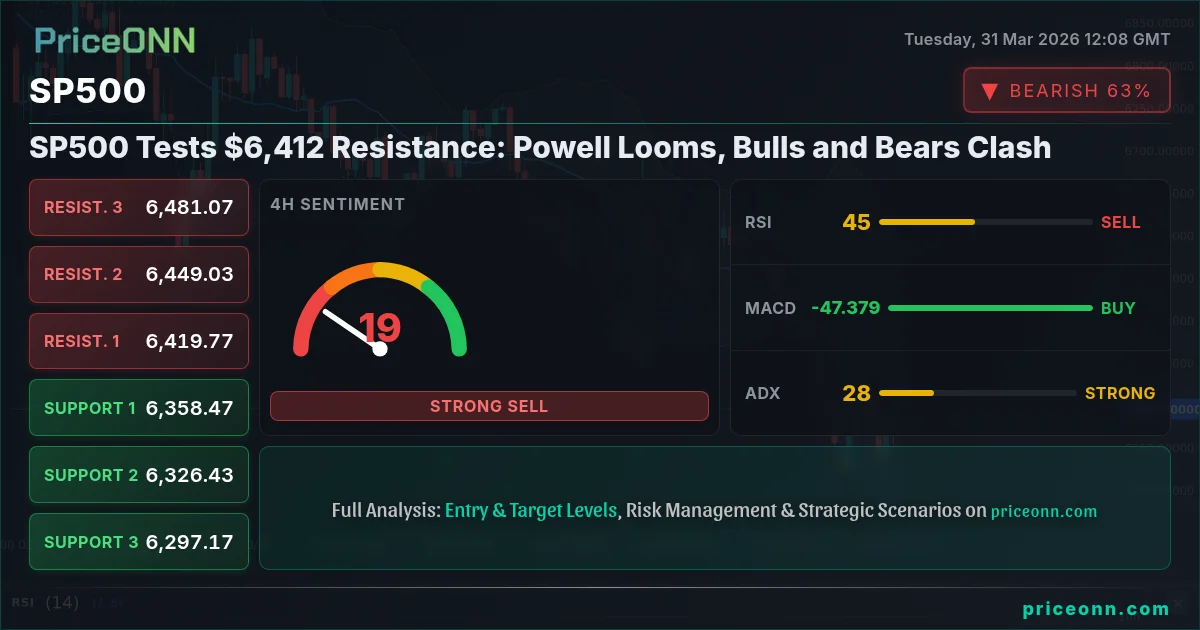
SP500 Tests $6,412 Resistance: Powell Looms, Bulls and Bears Clash
SP500 trades at $6,412.35, facing resistance as traders eye Powell's speech and geopolitical tensions. Technicals show a mixed picture.
The battle lines are drawn for the SP500 as it hovers precariously around the $6,412.35 mark, testing a significant resistance level. In a market environment defined by geopolitical shocks, surging oil prices, and the ever-present shadow of central bank policy, the bulls and bears are locked in a fierce tug-of-war. The upcoming speech from Fed Chair Powell looms large, threatening to tip the scales and dictate the next major directional move for US equities. This analysis delves into the intricate technical tapestry and the underlying fundamental currents shaping the SP500's immediate future, exploring the conditions that could fuel a breakout or trigger a sharp retracement.
- SP500 hovers around $6,412.35, testing a key resistance level.
- RSI at 57 indicates upward momentum, but ADX at 14.35 suggests a weak trend, lacking commitment.
- Bearish scenario targets $6,359.30 if resistance holds, while bullish outlook eyes $6,424.10 and beyond.
- Market sentiment is cautious, with geopolitical risks and Fed policy expectations creating uncertainty.
The Bullish Case: Resilience Amidst Uncertainty
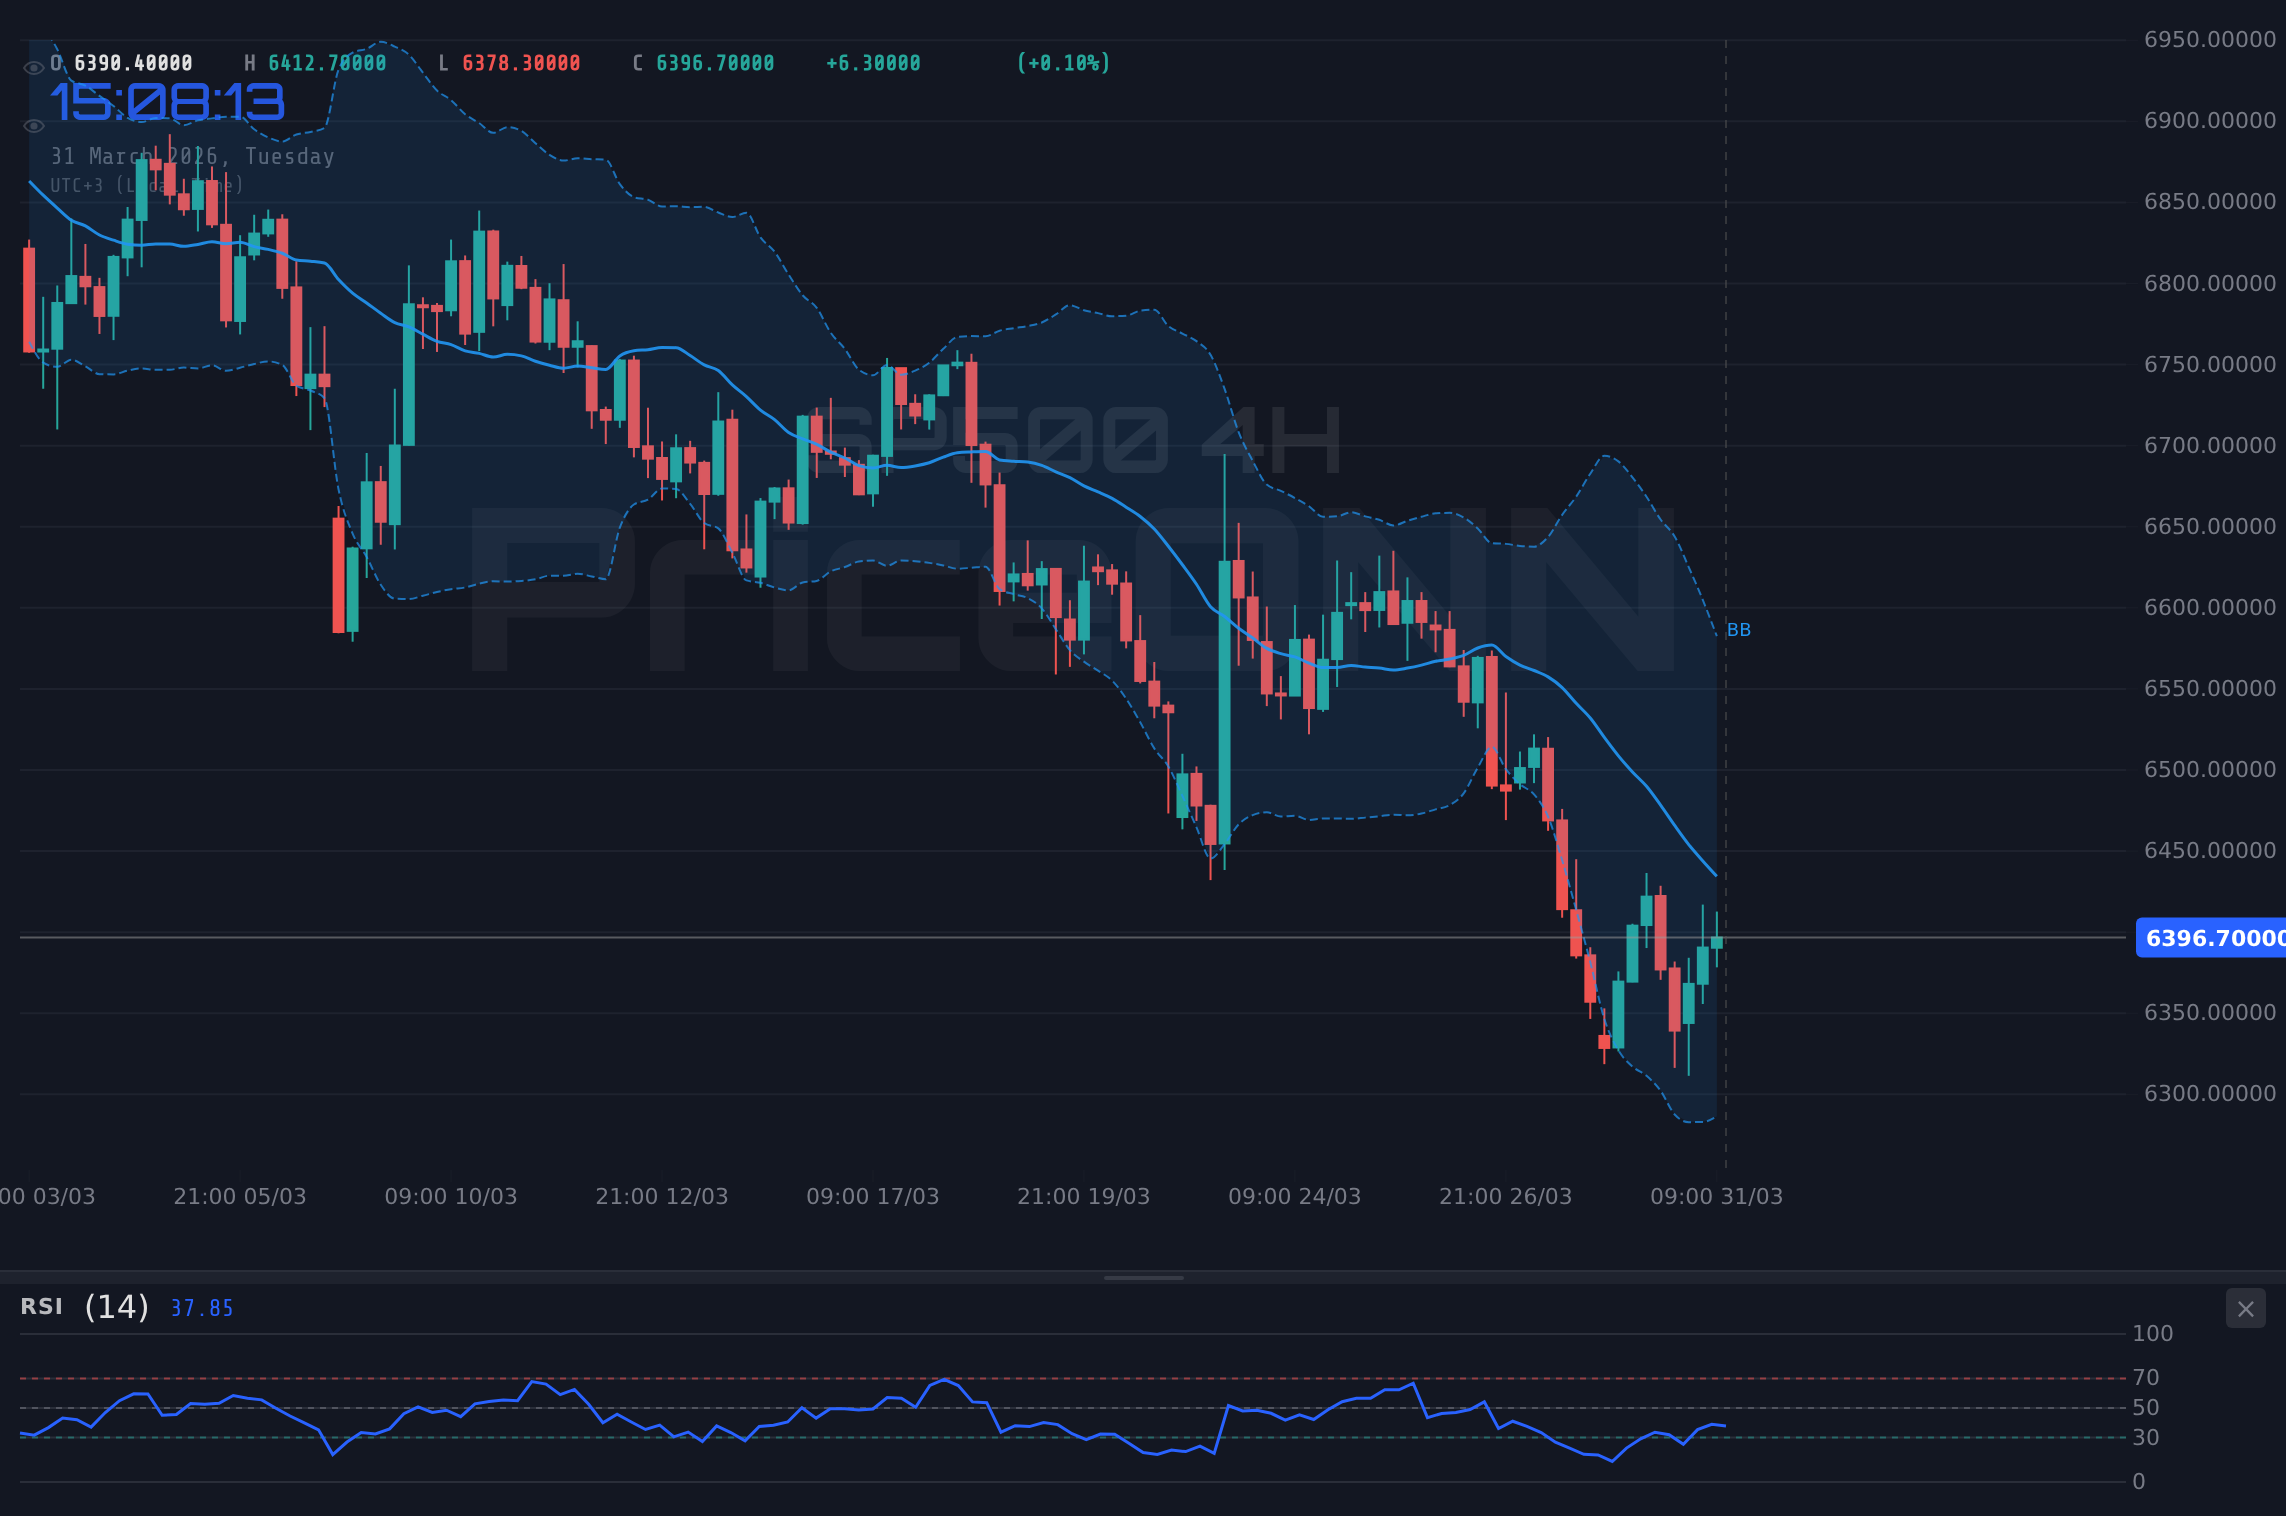
On the surface, the SP500's ascent to $6,412.35 represents a remarkable display of resilience. The index has shrugged off significant headwinds, including escalating geopolitical tensions in the Middle East and the persistent upward pressure on oil prices, which recently saw Brent crude flirting with $120. This stubborn strength suggests underlying demand from investors who may be anticipating a softer landing from the Federal Reserve or are simply positioning for a potential rally driven by corporate earnings. The 1-hour chart shows a generally positive signal mix, with the RSI at 57 indicating bullish momentum, and the MACD histogram positioned positively, albeit with the MACD line below the signal line. The Stochastic oscillator, with %K at 58.57 and %D at 73.31, is showing a bearish crossover in the short term, but the overall trend strength, as measured by ADX at 14.35, remains weak. This suggests that while buyers are present, the conviction for a sustained move higher is not yet fully established. The 4-hour chart presents a more nuanced picture; while the RSI at 44.49 suggests a potential dip, the MACD is positive and the Stochastic is showing a bullish crossover, indicating potential for a bounce. However, the ADX at 28.33 on this timeframe points to a stronger downtrend, creating a conflict of signals that demands careful interpretation.
The daily chart, however, paints a more cautious picture for the bulls. With an RSI of 33.31, the index is approaching oversold territory, hinting at potential exhaustion for sellers. The MACD is firmly in negative momentum territory, and the Stochastic %K (11.37) has crossed above %D (26.94), indicating a potential bullish signal from the oversold region. Yet, the ADX at a formidable 50.27 signals a very strong downtrend, underscoring the significant challenges buyers face. This divergence between short-term positive signals and long-term bearish indicators highlights the choppiness of the current market. The ability of the SP500 to hold above key support levels, such as $6,380.90 on the 1-hour chart and $6,358.47 on the 4-hour chart, will be crucial for maintaining any bullish narrative. Failure to do so could quickly invite selling pressure, especially with the psychological level of $6,400 now acting as a pivot.
The Bearish Counter-Argument: Macro Headwinds and Technical Weakness
Despite the SP500's recent push towards $6,412.35, a compelling bearish case can be built upon several pillars: persistent inflation fears, the potential for hawkish central bank rhetoric, and clear signs of technical weakness across longer timeframes. The surge in oil prices, exacerbated by Middle East tensions, directly fuels inflation concerns. This complicates the Federal Reserve's task, potentially forcing them to maintain a restrictive monetary policy for longer than markets have priced in. The CME FedWatch tool, while not explicitly provided here, typically shows market participants grappling with the probability of rate cuts versus hikes, and any hawkish signals from Fed Chair Powell in his upcoming speech could spook equity markets. The current DXY (Dollar Index) is trading at 100.04, showing a daily decline, but its overall uptrend on the 4H and 1D charts suggests underlying dollar strength that can pressure global risk assets like equities. A strengthening dollar often correlates with tighter financial conditions, which is bearish for stocks.
Technically, the longer-term charts present significant red flags for the bulls. The daily SP500 chart exhibits a very strong downtrend, evidenced by the ADX reading of 50.27. The RSI at 33.31, while approaching oversold territory, is still well above the critical 30 level, and the MACD remains deeply negative, with the histogram showing continued bearish momentum. The fact that the price is trading below the middle Bollinger Band on the daily chart further reinforces the bearish sentiment. On the 4-hour timeframe, the ADX at 28.33 still indicates a strong downtrend, and the RSI at 44.49 suggests further downside potential. While the 1-hour chart offers some fleeting bullish signals, the overwhelming evidence from the 4-hour and daily perspectives points towards prevailing weakness. The resistance at $6,419.77 on the 4-hour chart and $6,411.77 on the daily chart are critical battlegrounds. A failure to decisively break and hold above these levels could see the SP500 quickly retrace towards its support levels, such as $6,358.47 (4H support) or even $6,291.57 (1D support).
Navigating the Resistance: Key Levels and Powell's Influence
The immediate focus for SP500 traders is the $6,412.35 level, where the price is currently encountering resistance. This is not just a technical barrier; it represents a psychological point where the market is weighing the resilience shown so far against the formidable macro and technical headwinds. The resistance levels on the 1-hour chart at $6,402.5, $6,413, and $6,424.1 provide immediate targets for any upward momentum, but the more significant hurdle lies at the 4-hour resistance of $6,419.77 and the daily resistance of $6,411.77. A decisive close above $6,424.10 on the 1-hour chart would be the first sign of bullish conviction, potentially paving the way for a test of higher levels. Conversely, a failure to hold above $6,400 could signal a bearish reversal, with immediate support found at $6,380.90 (1H S1) and $6,369.8 (1H S2), followed by the more significant 4-hour support at $6,358.47.
Fed Chair Powell's upcoming speech is the wildcard. Markets will be dissecting his every word for clues about the Fed's stance on inflation and future monetary policy. If Powell strikes a hawkish tone, emphasizing the need to combat persistent inflation and signaling a higher-for-longer interest rate environment, it could trigger a significant risk-off move across financial markets. This would likely see the DXY strengthen, bond yields tick higher, and the SP500 tumble. Conversely, any hint of dovishness, perhaps acknowledging cooling inflation or expressing concern over economic growth, could embolden buyers and fuel a rally. Given the current technical divergence and the high stakes of Powell's commentary, extreme caution is warranted. Traders should be prepared for increased volatility around the speech, as the market attempts to price in the Fed's next move.
Technical Confluence: Indicators in Conflict
The technical indicators are painting a picture of indecision, reflecting the broader market tension. On the 1-hour chart, the RSI at 57 suggests buyers are still somewhat in control, but the Stochastic's bearish crossover (%K < %D) signals a potential short-term pullback. The ADX reading of 14.35 indicates a lack of strong trend conviction, meaning any move could be prone to reversals. Moving to the 4-hour timeframe, the RSI at 44.49 hints at a potential shift from bullishness towards neutrality or even a slight bearish bias. However, the Stochastic's bullish crossover and the positive MACD momentum offer counterbalancing signals. The ADX here rises to 28.33, suggesting a more defined, albeit still potentially weak, downtrend is present. This conflict between shorter and medium-term indicators underscores the current market's ambiguity.
The daily timeframe presents the most bearish technical outlook. The RSI at 33.31 is approaching oversold conditions, which could provide a floor. However, the MACD remains deeply negative, and the ADX at 50.27 signifies a very strong, established downtrend. The price trading below the daily middle Bollinger Band reinforces this bearish bias. This divergence is critical: short-term indicators might suggest a bounce, but the long-term trend and momentum are decidedly negative. Confirmation of a sustained bullish move would require a clear break above the daily resistance at $6,411.77, ideally accompanied by improving MACD readings and a rising RSI. Until then, the default assumption should be that the strong daily downtrend remains intact, and any rallies are potential selling opportunities.
Scenario Analysis: Mapping the Path Forward
Given the conflicting signals and the pivotal nature of the current price action around $6,412.35, a scenario-based approach is essential for navigating this market. Each scenario considers specific triggers, invalidation levels, and potential price targets derived from the provided market data.
Bearish Scenario: Sellers Reassert Control
65% ProbabilityNeutral Scenario: Consolidation and Waiting Game
25% ProbabilityBullish Scenario: Breakout Above Resistance
10% ProbabilityThe Fed's Shadow and Inflationary Pressures
The macroeconomic backdrop remains a critical factor influencing the SP500's trajectory. The recent surge in oil prices, moving towards $110-$120 for Brent crude, is a double-edged sword. On one hand, it signals robust global demand and potentially higher corporate revenues for energy giants. On the other, it stokes inflation fears, complicating the Federal Reserve's fight against rising prices. Investors are keenly awaiting Fed Chair Powell's upcoming remarks for any indication of future monetary policy. The market has been pricing in a certain number of rate cuts for 2026, but persistent inflation, potentially fueled by energy costs and ongoing geopolitical disruptions, could force the Fed to adopt a more hawkish stance. This would involve maintaining higher interest rates for longer, which typically puts downward pressure on equity valuations. The DXY trading around 100.04, while currently showing a daily dip, has exhibited strength on higher timeframes, indicating that the US dollar remains a favored safe-haven asset amidst global uncertainty. A stronger dollar generally makes US exports more expensive and can weigh on corporate earnings, adding another layer of complexity for the SP500.
Economic calendar data released in the last 3 days and the upcoming week, though not detailed with specific outcomes here, play a crucial role. Any data points suggesting sticky inflation or a surprisingly resilient labor market could reinforce the Fed's hawkish bias. Conversely, signs of economic cooling or a significant drop in inflation would embolden calls for rate cuts. The interplay between these macro factors and the technical setup at $6,412.35 creates a highly sensitive environment. The market is essentially waiting for a catalyst – be it Powell's speech, crucial inflation data, or a geopolitical development – to break the current stalemate.
Conclusion: A Market on Edge
The SP500 stands at a critical juncture, trading at $6,412.35 and facing stiff resistance. The technical indicators offer a conflicting narrative: short-term charts hint at potential upside, while longer-term analysis reveals a strong prevailing downtrend. The bullish case hinges on the market's ability to absorb current geopolitical risks and a potentially dovish signal from the Federal Reserve, while the bearish case is underpinned by persistent inflation, the specter of higher-for-longer interest rates, and clear daily chart weakness. The upcoming speech from Fed Chair Powell is the most significant event on the horizon, likely to provide the directional impetus the market craves. Until then, expect volatility to remain elevated as traders grapple with these opposing forces. Patience and disciplined risk management will be paramount in navigating these choppy waters.
Frequently Asked Questions: SP500 Analysis
What happens if SP500 breaks above the $6,424.10 resistance level?
A sustained break above $6,424.10 on the 1-hour chart, supported by strong volume, could trigger a bullish scenario. This might lead to a retest of higher resistance levels, potentially targeting $6,449.03 (4H R2) and then $6,481.07 (4H R3).
Should I consider buying SP500 at current levels of $6,412.35 given the mixed signals?
Given the strong daily downtrend (ADX 50.27) and resistance at $6,412.35, buying at current levels carries significant risk. A more prudent approach might be to wait for a confirmed breakout above resistance or a retest of support levels around $6,358.47, aligning with a higher probability bearish scenario.
Is the RSI at 33.31 on the daily chart a buy signal for SP500 right now?
While an RSI of 33.31 approaches oversold territory, it is not a standalone buy signal, especially with the ADX indicating a strong downtrend. Confirmation from other indicators like MACD and price action holding support would be necessary before considering a long position.
How will Fed Chair Powell's upcoming speech affect the SP500 this week?
Powell's speech could be a major catalyst. A hawkish tone emphasizing inflation concerns might lead to a sharp decline as markets price in higher-for-longer rates, potentially pushing SP500 towards support levels. A dovish tone could fuel a rally, but this scenario currently holds a lower probability based on technicals.
| Indicator | Value | Signal | Interpretation |
|---|---|---|---|
| RSI (14) | 57.00 | Bullish | N/A |
| MACD | Positive | Bullish | N/A |
| Stochastic | K=58.57, D=73.31 | Bearish Crossover | N/A |
| ADX | 14.35 | Weak Trend | N/A |
| Bollinger | Middle Band Above | Bullish | N/A |
Track markets in real-time
AI-powered analysis, technical indicators and real-time price data.
Join Our Telegram Channel
Breaking market news, AI analysis and trading signals instantly.
Join Channel