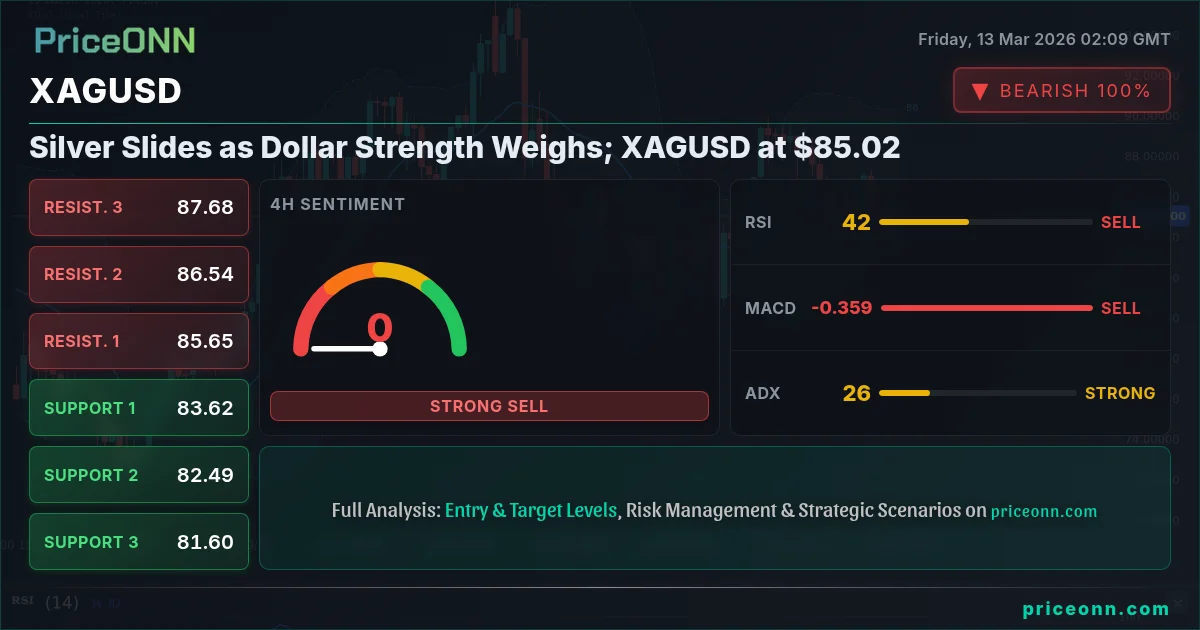
Silver's recent volatile run has hit a snag, with XAGUSD currently trading at $85.02. The strength of the US dollar, as reflected in the rising DXY, is exerting downward pressure on the precious metal. Can silver recover, or are further declines in store?
- XAGUSD is currently trading at $85.02, down -0.8% on the day, pressured by a rising DXY.
- Key support lies at $84.26, with a break below potentially targeting $83.50.
- Stochastic on the 1H chart signals a potential bullish reversal, but ADX indicates a strong downtrend.
- Upcoming USD data releases on Friday could add volatility and drive short-term price action.
Dollar's Dominance: A Headwind for Silver
The US Dollar Index (DXY) has been on a tear, currently at 99.44, up 0.56% on the day. This surge is fueled by a combination of factors, including geopolitical tensions and expectations of a more hawkish Federal Reserve. As the dollar strengthens, it makes silver, which is priced in dollars, more expensive for buyers holding other currencies, thus dampening demand. The news wires are abuzz with talk of the DXY eyeing the 100 level as geopolitical risk fuels safe-haven demand, according to recent reports.
Furthermore, the Dow Jones Industrial Average took a significant hit, falling 1.56% as U.S. markets closed. Asian markets also faced headwinds, with Australia's S&P/ASX 200 declining by 1.31% and Indonesia's IDX Composite Index down. This risk-off sentiment further supports the dollar's appeal, adding to the pressure on silver. With the SP500 down -0.92% and Nasdaq100 down -1.18%, investors are fleeing to safety, and the dollar is benefiting.
Technical Picture: A Mixed Bag
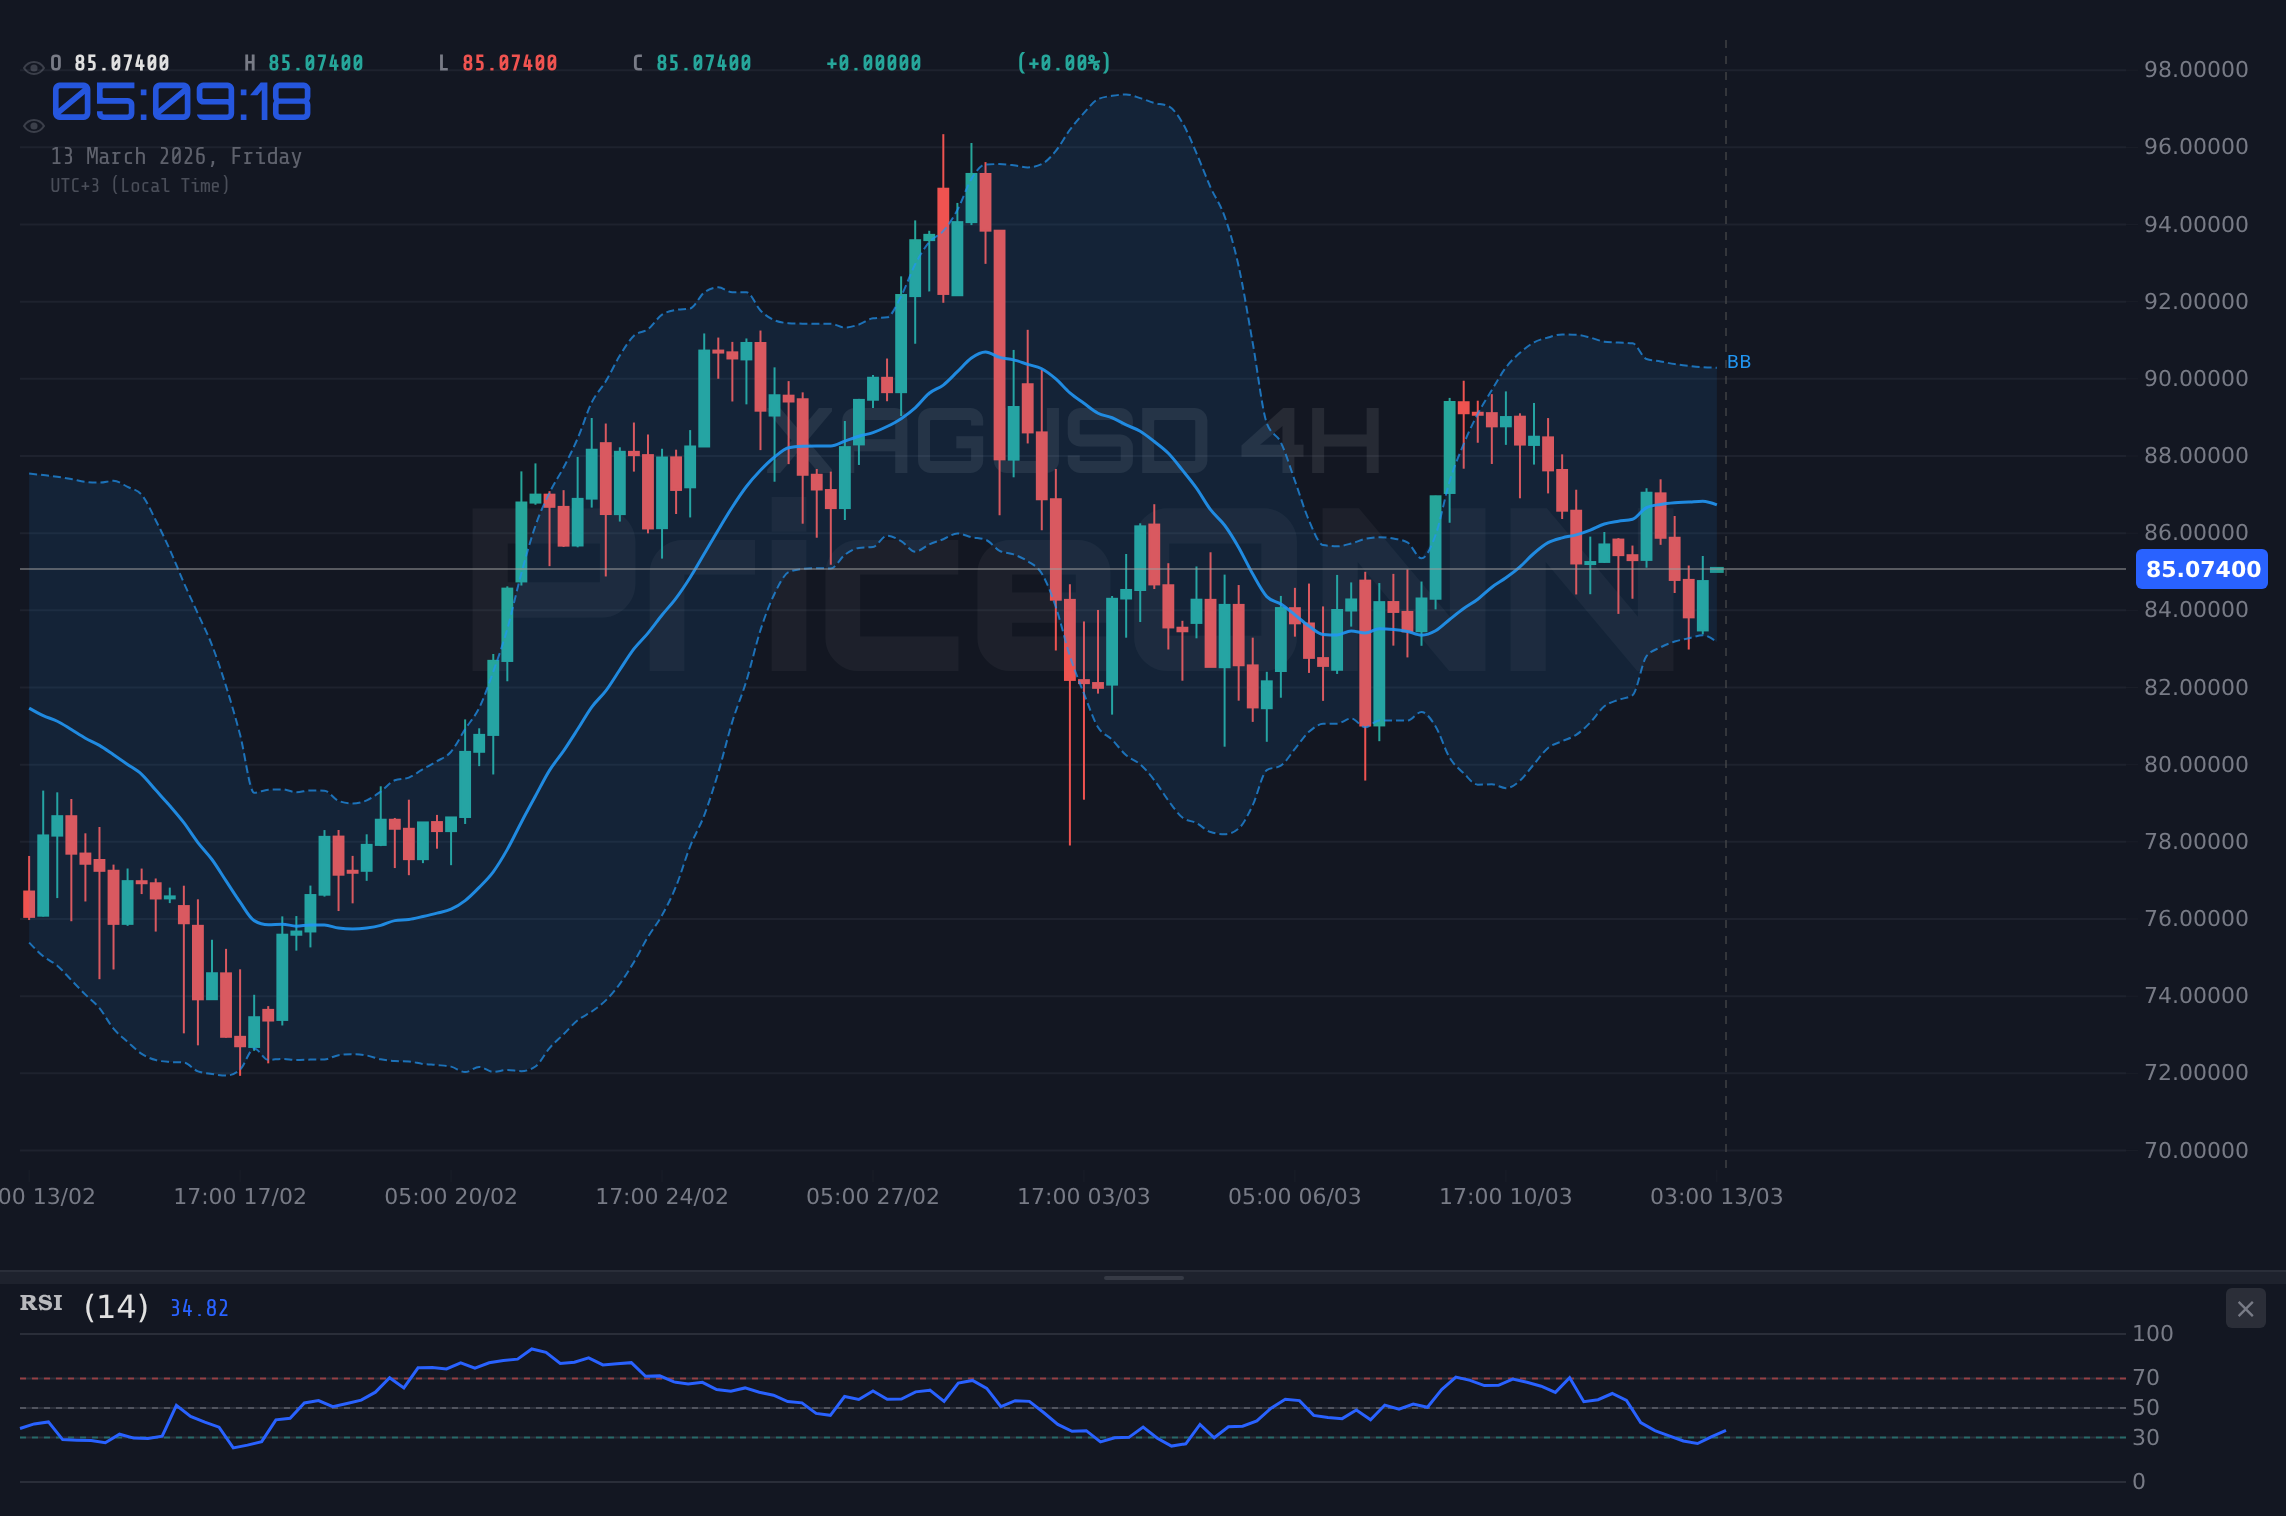
Looking at the technical indicators, the picture for XAGUSD is somewhat mixed. On the 1H timeframe, the RSI is at 46.95, indicating neutral momentum but with a downward trend. The MACD is showing negative momentum, with the MACD signal line below zero. However, the Stochastic is signaling a potential bullish reversal, with %K at 61.75 above %D at 28.79. But the ADX is at 34.68, signaling a strong downtrend. This divergence suggests caution is warranted.
The 4H timeframe paints a similar picture. The RSI is at 46.88, also in neutral territory but trending down. The MACD is negative, and the Stochastic, at K=28.8, D=32.82, signals a bearish continuation. The ADX is at 25.03, confirming the strong downtrend. The silver bulls are really getting pressured here, but the Stochastic does offer some hope.
Zooming out to the 1D timeframe, the RSI is at 50.01, neutral but trending upward. The MACD is positive, and the Stochastic is bullish, with %K at 45.76 above %D at 39.14. However, the ADX is at 14.98, indicating a weak trend and sideways movement. This suggests that while the long-term outlook may be more positive, the short-term pressure from the dollar could continue to weigh on silver.
Key Levels to Watch
For traders watching XAGUSD today analysis, several key levels are worth keeping an eye on. Immediate support lies at 84.26. A break below this level could open the door to further declines towards 83.50 and then 83.11. On the upside, initial resistance is at 85.42, followed by 85.81 and 86.58. These levels represent potential areas where selling pressure could intensify.
On the 4H chart, stronger support can be found at 82.81, followed by 81.81 and 80.64. Key resistance levels are at 84.99, 86.17, and 87.17. A sustained break above 87.17 would be a significant bullish signal, potentially invalidating the current bearish trend. For longer-term traders, keep an eye on 88.58 as a key level to break to the upside.
Upcoming Economic Data: A Potential Catalyst
The economic calendar is relatively light today, but several USD data releases could still impact XAGUSD. The previous reading for one key economic indicator was 4.3, and another was 3. Traders will be watching closely to see if these numbers are revised or if new data points to a change in the economic outlook. On Wednesday, [EUR] data was released, and [USD] data was also released. The impact of these events is still being digested by the market, and any surprises could trigger volatility in XAGUSD.
Trade Plan: Riding the Downtrend
Given the current technical picture and the strength of the dollar, a short-term bearish strategy could be considered. However, the Stochastic signal on the 1H chart suggests caution is warranted, and waiting for confirmation of the downtrend before entering a position may be prudent.
Enter short if XAGUSD breaks below 84.26, targeting 83.50 and then 83.11. A sustained move below 83.11 could lead to a test of the 82.81 support level. This scenario aligns with the prevailing downtrend and dollar strength.
A break above 85.42 could signal a short-term reversal, targeting 85.81 and then 86.58. However, given the strength of the dollar, this scenario is less likely in the near term. A sustained move above 86.58 would be needed to confirm a bullish trend reversal.
XAGUSD's Volatile Run: Industrial Demand and Gold Correlation
The recent volatility in the silver price is partly due to its dual nature as both a precious metal and an industrial metal. Silver has surged above $86 due to strong investment demand, but also it is heavily correlated to gold and industrial metal factors. The Forexprostr reports also mention the recent volatility. Industrial demand plays a significant role in silver's price dynamics, and any slowdown in global economic activity could negatively impact demand, putting downward pressure on prices. It is also worth noting that the percentage of gold industrial demand is lower than that of silver, making silver more sensitive to industrial cycles. The industrial demand percentage vs silver is a critical factor to consider.
Frequently Asked Questions: XAGUSD Analysis
What happens if XAGUSD breaks below $84.26 support?
A break below $84.26 could trigger a further decline towards $83.50 and then $83.11. These levels represent potential areas where selling pressure could intensify, and traders should be prepared for increased volatility.
Should I short XAGUSD at current $85.02 levels given RSI at 46.95?
The RSI at 46.95 suggests neutral momentum, but the downward trend indicates caution. Consider waiting for confirmation of the downtrend, such as a break below 84.26, before entering a short position. Manage your risk and set a stop-loss order to protect your capital.
Is the Stochastic signal on the 1H chart a reliable buy signal for XAGUSD?
The Stochastic signal on the 1H chart indicates a potential bullish reversal, but it should be viewed with caution given the overall downtrend and strength of the dollar. Waiting for confirmation from other indicators, such as a break above 85.42, is advisable.
How will Friday's USD data releases affect XAGUSD this week?
Friday's USD data releases could add volatility to XAGUSD, depending on whether the actual numbers deviate significantly from expectations. Positive data could further strengthen the dollar and pressure silver, while negative data could provide some relief for the precious metal.
Track markets in real-time
AI-powered analysis, technical indicators and real-time price data.
Join Our Telegram Channel
Breaking market news, AI analysis and trading signals instantly.
Join Channel