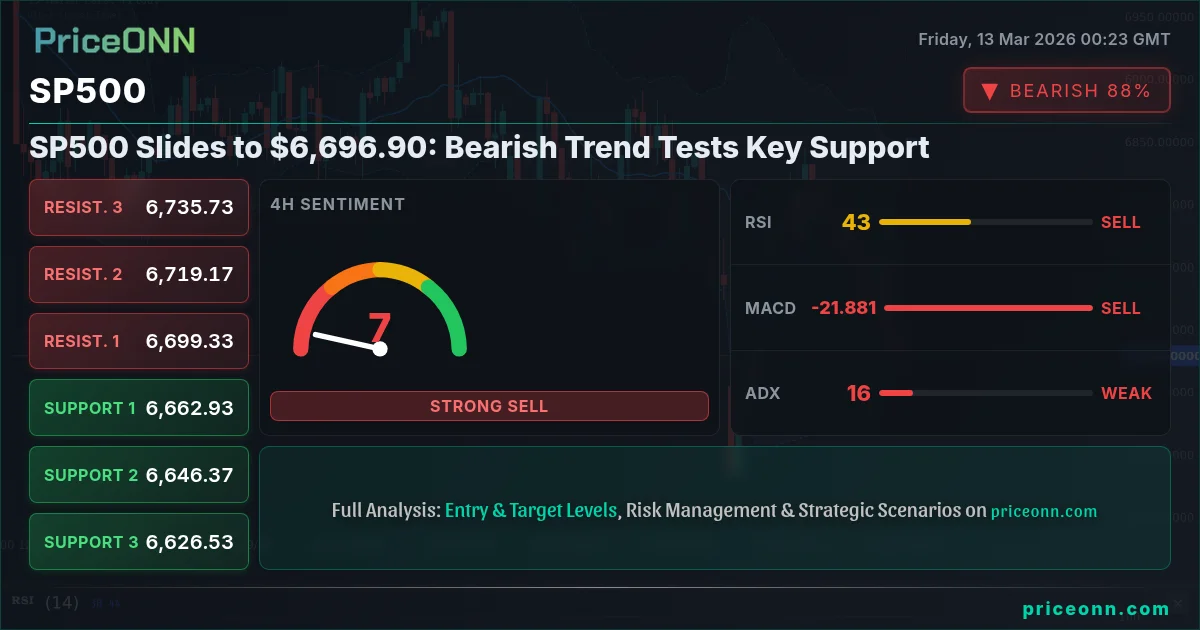
The SP500 is under pressure, currently trading near $6,696.90, as the battle between bulls and bears intensifies around a critical support zone. Investors are weighing geopolitical risks, a stronger dollar, and mixed technical signals, creating a volatile landscape for the index. The key question now is whether the bears can sustain the downward pressure or if the bulls will stage a comeback at these levels. SP500 today analysis reveals a market at a critical juncture.
- RSI at 42.16 on the 1H chart signals potential for further downside before oversold conditions are met.
- Critical support sits at $6,673.53, a break below which could trigger a sharper sell-off.
- MACD histogram shows increasing negative momentum, indicating bearish sentiment is strengthening.
- Strengthening DXY is putting downward pressure on SP500, exacerbating the bearish trend.
The Bullish Case for SP500
Despite the current bearish pressure, there are arguments to be made for a potential bullish reversal. The SP500's RSI on the daily chart sits at 37.66, nearing oversold territory. Historically, such levels have presented buying opportunities for longer-term investors. Furthermore, the Stochastic oscillator on the 1H chart shows a potential bullish crossover (K=33.64, D=17.44), suggesting that short-term downward momentum may be waning. A potential catalyst for a bullish reversal could be positive economic data releases, such as a weaker-than-expected DXY print, which could alleviate some of the downward pressure on the SP500. Scalpers might look for quick long opportunities if the price manages to hold above the immediate support at $6,676.97, targeting the $6,692.67 resistance level.
Looking at the broader market context, some analysts believe that the recent sell-off is a healthy correction within a larger uptrend. They point to strong corporate earnings and resilient consumer spending as fundamental drivers that could support a rebound in the SP500. Moreover, any de-escalation of geopolitical tensions could trigger a relief rally, sending the index higher. From a multi-timeframe analysis perspective, while the 1H and 4H charts show bearish signals, the daily chart presents a more neutral outlook, suggesting that the overall trend remains uncertain. A key level to watch for bullish confirmation is the $6,716.93 resistance on the 4H chart. A decisive break above this level could signal a shift in momentum and pave the way for a retest of higher resistance levels.
The Bearish Case for SP500
On the other hand, the bearish case for the SP500 remains compelling. The index has broken below its 50-day moving average, a key technical indicator often watched by traders. The daily MACD histogram is also showing increasing negative momentum, suggesting that selling pressure is intensifying. Moreover, the strengthening DXY, currently at 99.37, is putting significant downward pressure on the SP500, as a stronger dollar typically weighs on risk assets. The Dow Plunged 1.5% as North American Markets Face Broad Sell-Off, as per recent news, reflecting the widespread bearish sentiment.
A key driver of the bearish sentiment is escalating geopolitical tensions, particularly in the Middle East, which are fueling safe-haven demand and risk aversion. As mentioned in recent news, oil prices are soaring due to the conflict, adding to inflationary pressures and potentially forcing the Federal Reserve to adopt a more hawkish monetary policy stance. This, in turn, could further weigh on the SP500. From a technical standpoint, the ADX on the 1D chart is at 35.92, indicating a strong downtrend. Swing traders might look for shorting opportunities if the price breaks below the $6,673.53 support level, targeting the $6,655.07 and $6,630.13 supports. Long-term investors should be wary of further downside risk if the SP500 fails to hold above these critical support levels.
Technicals as a Tiebreaker: Multi-Timeframe Analysis
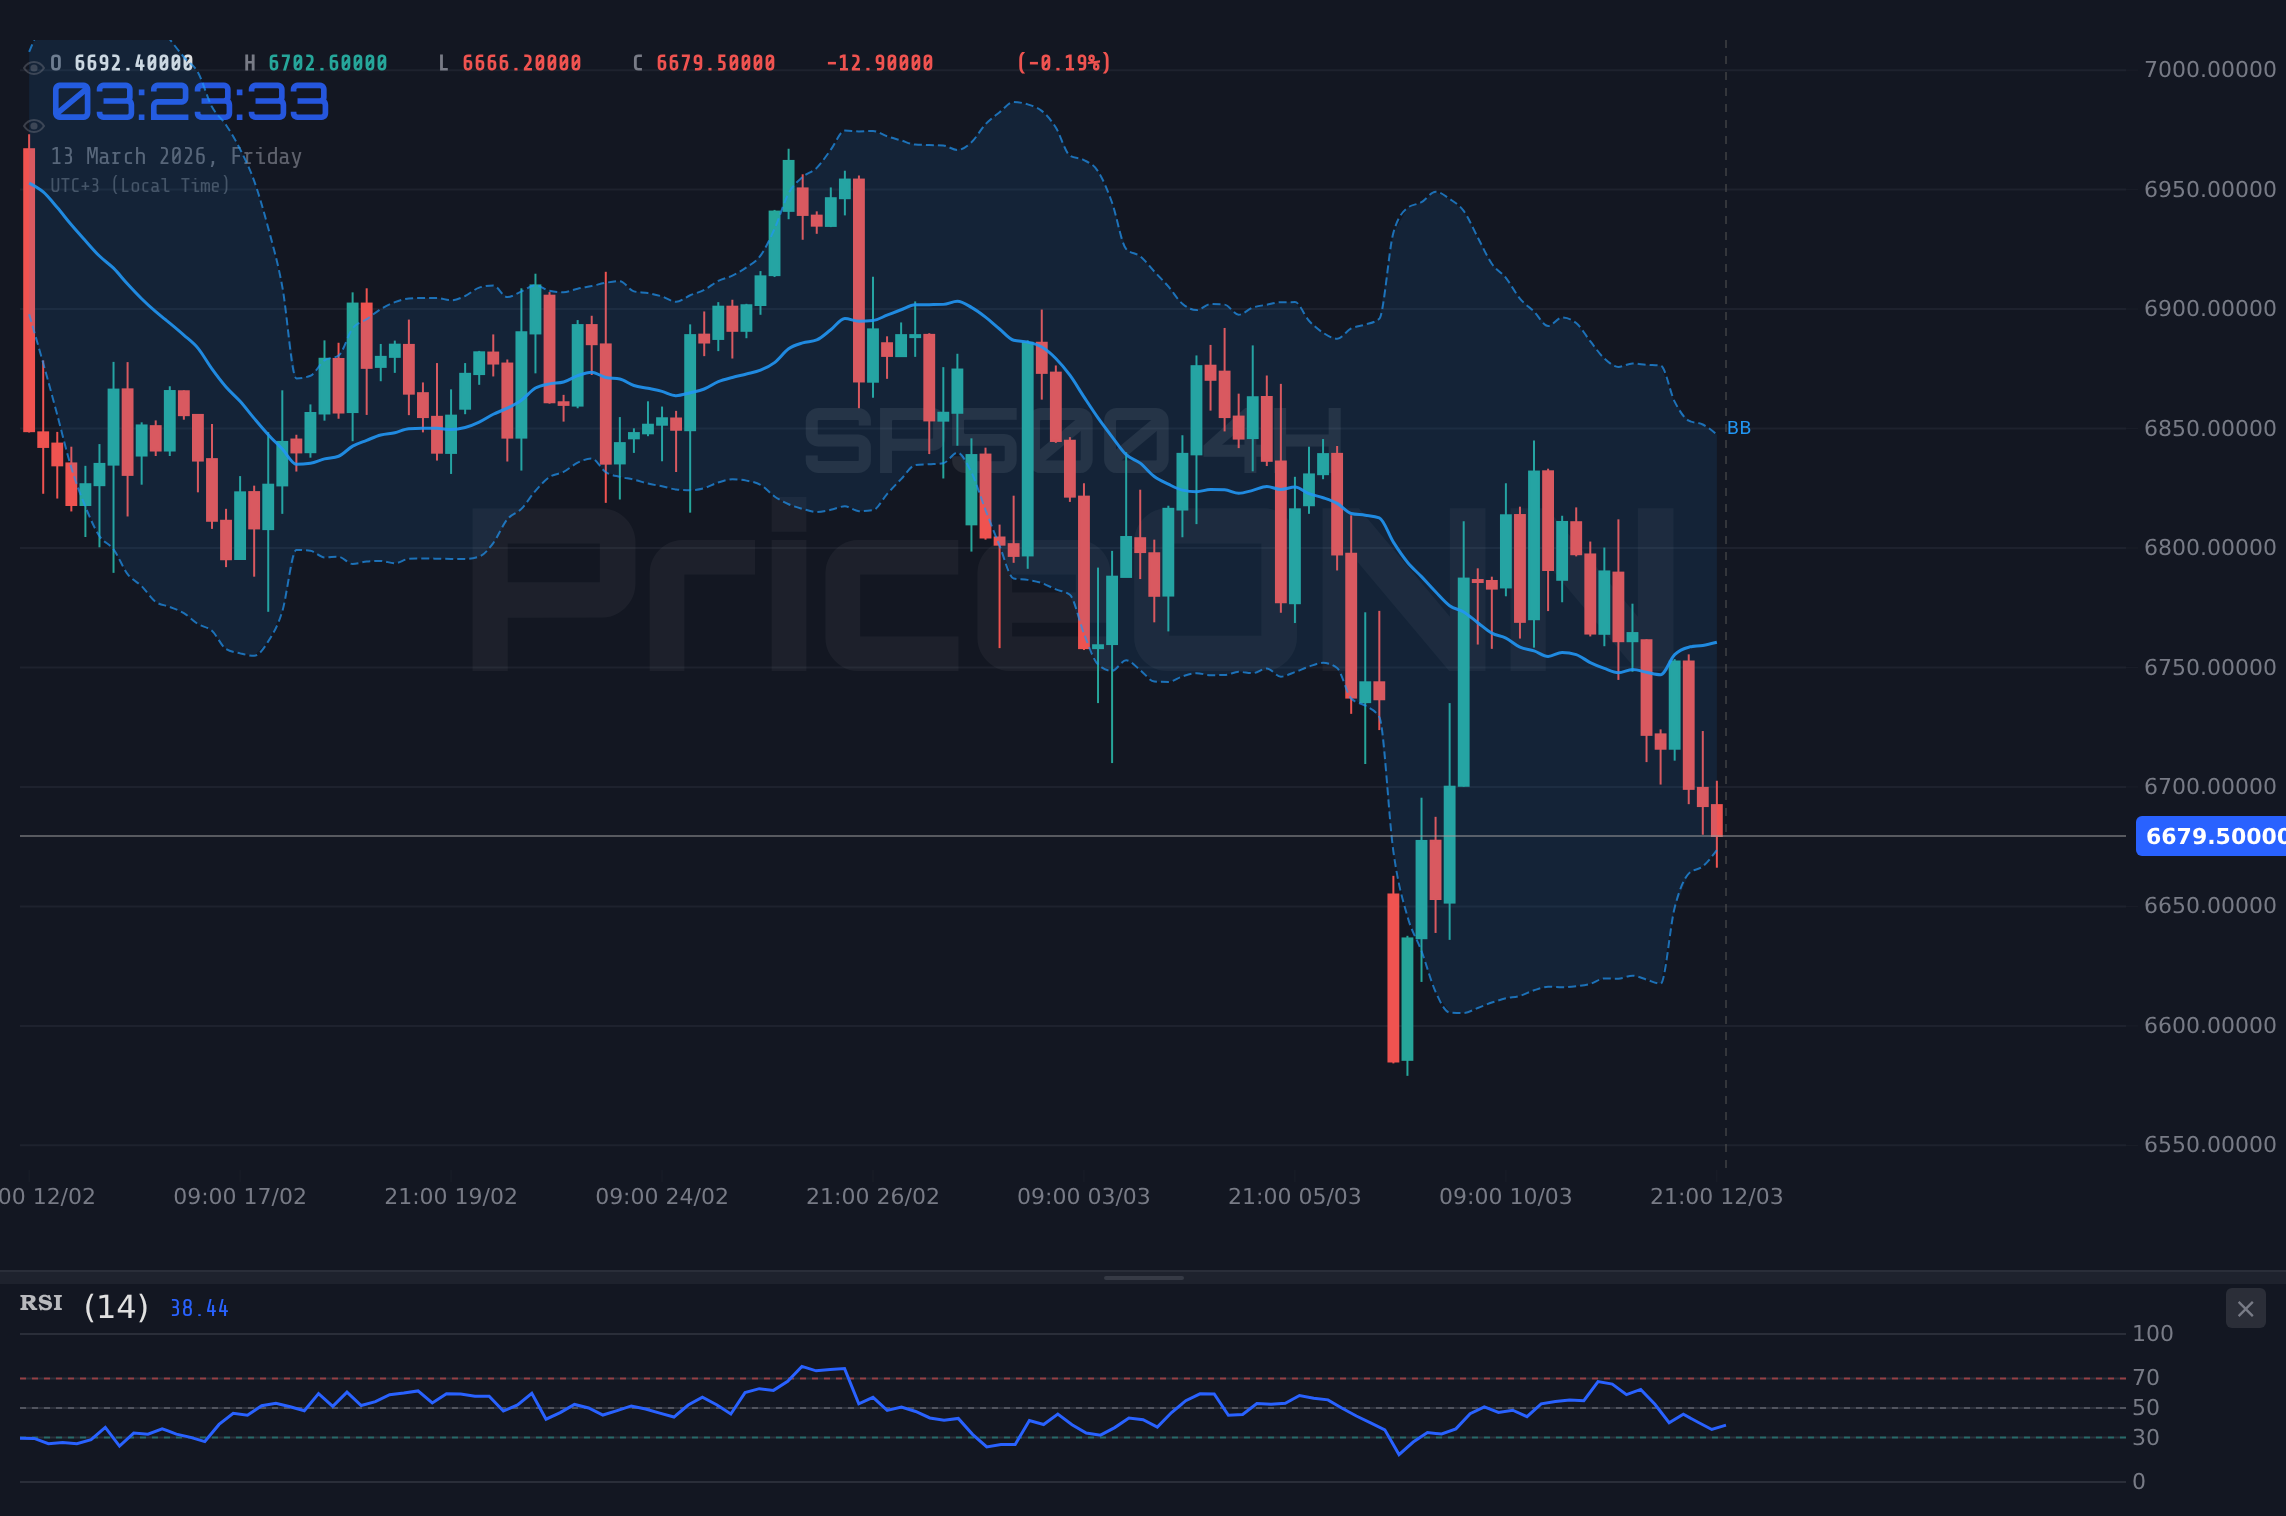
To gain a clearer picture of the SP500's potential trajectory, it's essential to analyze the technicals across multiple timeframes. On the 1H chart, the SP500 is exhibiting a bearish trend, with the price trading below the 200-period moving average. The RSI at 42.16 indicates that there's room for further downside before oversold conditions are met. However, the Stochastic oscillator is signaling a potential bullish crossover, suggesting that short-term downward momentum may be waning. On the 4H chart, the trend remains bearish, with the price trading below the middle band of the Bollinger Bands. The RSI at 42.27 reinforces the bearish sentiment, while the MACD histogram shows increasing negative momentum. The 1D chart presents a more mixed picture. While the price is trading below the 50-day moving average, the RSI at 37.66 is nearing oversold territory. The Stochastic oscillator is also signaling a potential bullish crossover, suggesting that a reversal could be in the works.
The ADX, a measure of trend strength, paints a compelling picture. On the 1H chart, the ADX is at 24.12, indicating a moderate downtrend. The ADX on the 4H chart is at 15.73, suggesting a weak trend. However, the ADX on the 1D chart is at 35.92, indicating a strong downtrend. This suggests that while the short-term trend may be uncertain, the overall trend remains bearish. Furthermore, the 1H Stochastic is showing K=33.64 and D=17.44 which could mean the price is due for a short term bounce.
Correlation Analysis: DXY, Bonds, and Oil
Understanding the SP500's correlations with other assets is crucial for assessing its potential trajectory. The SP500 has a strong inverse correlation with the DXY (Dollar Index). As the DXY strengthens, it typically puts downward pressure on the SP500, as a stronger dollar makes US assets more expensive for foreign investors. Currently, the DXY is trading at 99.37 and is showing a strong uptrend on the daily chart, further reinforcing the bearish sentiment for the SP500. SP500 today analysis must consider the DXY.
The SP500 also has a correlation with bond yields. Rising bond yields typically weigh on the SP500, as they increase borrowing costs for companies and reduce the attractiveness of equities relative to bonds. Currently, Treasury yields are rising due to expectations of higher inflation and a more hawkish Federal Reserve, adding to the downward pressure on the SP500. Furthermore, the SP500 has a complex relationship with oil prices. Rising oil prices can initially boost the SP500, as they benefit energy companies. However, sustained high oil prices can also weigh on the SP500, as they increase inflationary pressures and reduce consumer spending. The recent surge in oil prices, driven by geopolitical tensions, is adding to the uncertainty surrounding the SP500.
Trade Recommendation: Watch Zone
Given the mixed technical signals and the uncertain market environment, a clear trade setup is not yet evident. The ADX at 15.73 on the 4H chart indicates that the market is choppy and ranging, making a trade plan risky. While the RSI and MACD histogram are aligned, providing a clear directional signal, the Stochastic is in a tradeable zone, not yet indicating extreme oversold or overbought conditions. A daily close above $6,716.93 would open the door for a potential bullish reversal, targeting the $6,741.87 and $6,760.33 resistance levels. Conversely, a break below the $6,673.53 support level would signal further downside, targeting the $6,655.07 and $6,630.13 supports. Until a clear breakout or breakdown occurs, traders should exercise caution and wait for confirmation before initiating new positions. Scalpers should be extra careful given the low ADX reading.
Frequently Asked Questions: SP500 Analysis
What happens if SP500 breaks below $6,673.53 support?
A break below the $6,673.53 support level could trigger a sharper sell-off, targeting the $6,655.07 and $6,630.13 support levels. This scenario would be further confirmed by a strengthening DXY and continued geopolitical tensions.
Should I buy SP500 at current levels of $6,696.90 given the bearish trend?
Given the bearish trend and the mixed technical signals, it's prudent to exercise caution before initiating new long positions. A daily close above $6,716.93 would be a key condition to watch for bullish confirmation.
Is RSI at 37.66 on the daily chart a buy signal for SP500 right now?
While an RSI of 37.66 suggests the SP500 is nearing oversold territory, it's not a definitive buy signal. Traders should look for additional confirmation, such as a bullish crossover on the Stochastic oscillator or a break above key resistance levels.
How will the upcoming Fed decision affect SP500 this week?
The upcoming Fed decision could have a significant impact on the SP500. A more hawkish stance, signaling higher interest rates, could weigh on the index, while a dovish stance could provide support. Traders should closely monitor the Fed's commentary and economic projections for clues about the future direction of monetary policy.
Track markets in real-time
AI-powered analysis, technical indicators and real-time price data.
Join Our Telegram Channel
Breaking market news, AI analysis and trading signals instantly.
Join Channel